


 Arguments


Recent Comments
Prev 1144 1145 1146 1147 1148 1149 1150 1151 1152 1153 1154 1155 1156 1157 1158 1159 Next
Comments 57551 to 57600:
-
scaddenp at 08:20 AM on 25 June 2012Ten Things I Learned in the Climate Lab
pluvial - what do you hope this will achieve? I dont work in climate code but for models I work with the immediate issues would be: 1/ halve the resolution and you double the processing time. This limits what we can do with our models. Resolution has improved as no. of cpu goes up and get faster. 2/ The numeric method being used may have issues. Its little help to understanding reality if fine scales simply amplify rounding error in copying bounding conditions to nodes. 3/ Parameterization is often done to account for subscale processes. Increasing scale should theoretically allow for eliminating this but only by actually directly modelling these processes. Doing this is likely to be at least as complex as the large scale models and so massively increasing cpu time requirements. If you dont model these processes, then you potentially lose the reason for smaller scale in first place. -
shoyemore at 07:23 AM on 25 June 2012Adding wind power saves CO2
Paul D #37, I noted the data was very sparse on the right, relative to the left. The loess is probably inappropriate to show the trend, and an estimator should be used with error bars. The errors bars could be so large as to render the fit after 600MW or so meaningless. It is also not clear what is meant by "instantaneous CO2 emissions". PS I chose 1000MW arbitarily, could as easily have said 600MW. PPS Ireland has about 2000MW of installed wind power capacity. -
Paul D at 06:01 AM on 25 June 2012Adding wind power saves CO2
Shoyemore@36 Why on Earth would 1000MW be special?? Thats about two average sized power stations in the UK (or anywhere). Should be noted that the population of Ireland is about 10 times smaller than the UK. Also on that article a number of commentors have pointed out the cherry picking nature of the data and a reference is made to Dr Udo. Seems like that research has been thoroughly rebutted. The commentor from AWEA points out that a cold period seems to have been chosen which boosted fuel burnt for heating. Also found this. http://coloradoenergynews.com/2011/09/fact-check-fred-udos-bogus-numbers-on-wind-and-emissions-savings/Moderator Response: TC: Made link live. -
dana1981 at 04:20 AM on 25 June 2012Simply Wrong: Jan-Erik Solheim on Hansen 1988
Fred, short and simple, you're focusing on short-term noise and missing the long-term signal. If you want to deny that the planet is still warming, please go to one of the appropriate threads, like this one. Bottom line is that there is a warming trend, and that trend corresponds to ~3°C sensitivity. People really need to get over Scenario C. Scenario C didn't happen - it's a moot point, a red herring, a distraction. Just pretend it's not there. Kevin C is also going to have a very interesting post on surface temperatures in a couple of weeks which will put another nail in the 'no warming' myth. -
Bob Lacatena at 02:40 AM on 25 June 2012Simply Wrong: Jan-Erik Solheim on Hansen 1988
Fred,We have three independent sources all showing flat temperature trends...
False. Foster and Rahmstorf (2012) Another viewTo quote Gavin: “The basic issue is that for short time scales (in this case 1979-2000), grid point temperature trends are not a strong function of the forcings...
You appear to have completely misunderstood what he was saying. The quote is about "grid-points" -- spacial temperature trends, applied locally. Your follow-on assessment that this somehow means "CO2 emissions had little to do with 20th Century temperature increases" is utterly wrong.His “projections” test the science behind the models (CO2 et al forcing), not the statistics. They were intended to contrast what would happen if CO2 emissions continued to increase after year 2000, and what would happen if they did not.
Wrong. This is a strawman that you have constructed so you can choose to interpret things as you wish. This has been explained to you multiple times, and you keep trying to find ways to ignore the facts. The simple truth is the 24 years ago Hansen used a simple climate model and three specific scenarios out of countless possibilities to make a series of projection. His model was not as good as those today, his climate sensitivity was too high, none of his scenarios came to pass (and none is truly close), and a number of confounding factors in the past decade have all combined to cause current events to fail to match any of those predictions. This is the simple truth. So what, exactly, is the point that you are trying to make out of all of this? -
Fred Staples at 02:02 AM on 25 June 2012Simply Wrong: Jan-Erik Solheim on Hansen 1988
Most of these posts miss the point of the Hansen models. His “projections” test the science behind the models (CO2 et al forcing), not the statistics. They were intended to contrast what would happen if CO2 emissions continued to increase after year 2000, and what would happen if they did not. It does not matter if Hansen’s sensitivities were accurate, as long as they were non-zero. Why not? Because the CO2 concentration in the C line after year 2000 is assumed to be constant. It is a base line against which the impact of the actual CO2 can be assessed. I would plead with everyone who wishes to debate this to look at the Hansen chart at the Real Climate update or Post 48 here. Up to 2006 the B line, the C line, and the actuals moved together. Gavin Schmidt could reasonably claim, as he did, that he science behind the model reflected reality. (By that time the exponential A line had been disowned and “we are moving up the B line”). Most of the 20th century increase occured from 1985 to 2006, which is why the overall trend lines (B, C and actuals) are similar, post 37. CO2 concentrations increased from 350 to 380 ppm over the period, and to just short of 400ppm from 2006 to date. But after 2006 the B and C lines diverged sharply, and they must continue to do so. The actuals, on all measurements, followed the C line, as Dana points out. As of today, 24th June, 2012, on any measurement, the global average temperature is more than 0.5 degrees below the Hansen projection. Now to explain that discrepancy we can invoke measurement error, model error, or short-run statistics. We have three independent sources all showing flat temperature trends following the C line since year 2000 – satellite, radio-sondes, and land stations. Random fluctuations in the real global temperature is a possible explanation. Purely by chance, we might be observing a run of increasingly depressed temperatures. To quote Gavin: “The basic issue is that for short time scales (in this case 1979-2000), grid point temperature trends are not a strong function of the forcings - rather they are a function of the (unique realisation of) internal variability and are thus strongly stochastic. (Incidentally, if true, this means that CO2 emissions had little to do with the 20th Century temperature increases). Finally, of course, there are countervailing forces – aerosols, La Nina preponderance, “heat” transfer to the deep oceans, reductions in other greenhouse gasses. All these explanations of the Hansen error must eventually reverse, and it is possible that the actual trend will move sharply up to the B line, and stay there. But while we wait the gap (B to C) will grow. And it is pointless to lower the temperature sensitivity to force B into line with C. Eventually they must diverge, and we will have to wait to see which line the actual temperatures follow. In the mean-time surely we have to accept that the Hansen models offer no corroboration whatsoever for the CO2 forcing theory of AGW. If temperatures remain flat, eventually falsification will loom. -
shoyemore at 01:19 AM on 25 June 2012Adding wind power saves CO2
 MarkR, Tom, & Anyone Else
Could you take at look at this chart for me? Information is here:
Eirgrid Ireland "instantaneous" CO2 emissions & loess fit
The author (who is not a climate science denier or possessed of hangups about renewables) suggests this shows CO2 emissions increase with wind power capacity above 1000MW. I have my own idea about what is wrong, but would like to hear some other opinions.
Thanks.
MarkR, Tom, & Anyone Else
Could you take at look at this chart for me? Information is here:
Eirgrid Ireland "instantaneous" CO2 emissions & loess fit
The author (who is not a climate science denier or possessed of hangups about renewables) suggests this shows CO2 emissions increase with wind power capacity above 1000MW. I have my own idea about what is wrong, but would like to hear some other opinions.
Thanks.
-
les at 23:55 PM on 24 June 2012Review of new iBook: Going to Extremes
Ahhh - I tried from iPhone. -
Jim Powell at 23:34 PM on 24 June 2012Review of new iBook: Going to Extremes
Les: I show it for sale in the UK store. Not sure what the problem is. Others: I have added the missing hyphen and updated the iBook. Try that in a print book! As a reminder, because of the software used to accomplish the interactivity, these Apple iBooks only work on an iPad. I hope that will change and believe it will. -
Tom Curtis at 22:53 PM on 24 June 2012Simply Wrong: Jan-Erik Solheim on Hansen 1988
dana @56, the important paragraph in the google translated version at WUWT reads:"The CO 2 emissions since 2000 to about 2.5 percent per year has increased, so that we would expect according to the Hansen paper a temperature rise, which should be stronger than in model A. Figure 1 shows the three Hansen scenarios and the real measured global temperature curve are shown. The protruding beyond Scenario A arrow represents the temperature value that the Hansen team would have predicted on the basis of a CO 2 increase of 2.5%. Be increased according to the Hansen’s forecast, the temperature would have compared to the same level in the 1970s by 1.5 ° C. In truth, however, the temperature has increased by only 0.6 ° C."
(My emphasis) The 1.5 C anomaly compared to the 1960-70s mean compares well with the size of the arrow. Hence I take this to be Solheim's real "prediction". The 1.9 C increase mentioned in the caption to Solheim's figure makes little sense. It may refer to the increase in Solheim's projection out to 2050 relative to temperatures assumed not to increase further in temperature, or perhaps even to decrease. As a comparison between even Solheim's inflated projections and observations, it is not true over any period up to and including 2012. -
PluviAL at 19:10 PM on 24 June 2012Ten Things I Learned in the Climate Lab
How hard is it to set a model with two grid patterns, one with inputs on the grid scale availabe from commonly available data, and one in very fine scale, say in grid cells of 10 meters instead of 10s of kilometers? Is that doable? What kind of person count would you need? How big a system? How long to build a working model? How long to test it and make it reliable? -
chuck101 at 18:20 PM on 24 June 2012Greenhouse gases are responsible for warming, not the sun
Hmmm, difficult stay away from political comments when Heartland is, at heart (sorry), a political institution; set up by big business and big oil, to look after their interests, and with the stated aim of casting doubt in the minds of the public about AGW. In order to do this, they hire scientists willing to plead their cause. Sadly, since the science is so rock solid, the only way they can do this is by twisting the science itself, by a combination of 'errors', 'mistakes', misrepresentation, and in some cases, outright falsification. These aren't accidental mistakes or errors. They are deliberate, so no way are these guys going to retract. They would lose their funding from Heartland. Hence the same scientists keep making the same sorts of 'errors'. They get called on it, refuse to admit it, then get called on it again in some other context, refuse to admit it, etc, and so the merry *Gish Gallop' continues. For example Bob Carter, the serial cherry picker, gets called on it time after time, but still we get 'GW stopped in 1998', or 'slight decline since 2002', or 'no warming since (insert future date here)'. Still he continues, because he is not out to persuade fellow scientists, he is out to bamboozle the general public, who are, in the main, scientifically challenged and do not even see the various cunning tricks that have been played on them. So while these 'scientists' need to be held to account scientifically, (and you guys are doing a great job), the actual battle is in the political area. The scientific battle was won long ago. -
BaerbelW at 18:15 PM on 24 June 2012Review of new iBook: Going to Extremes
Thanks D_C_S for the heads-up! Re-reading the statement, I realised that the "14" is actually the number of "billion-dollar" weather disasters happening in the U.S. in 2011 and not the amount they incurred. I have updated the post accordingly. -
curiousd at 16:51 PM on 24 June 2012Hansen and Sato Estimate Climate Sensitivity from Earth's History
Hi Newbie Physics guy, non climate guy interested in teaching this stuff here: Pointing out something that might possibly relate the 1981 Hansen, et al Science paper to this recent determination of sensitivity by fitting to past data? In 1981 paper, CO2 alone gives 1.2 degrees no feedbacks. (Model 1) By holding relative humidity constant ( water vapor feedback) sensitivity increased to 1.9 C. ( Hansen model 2)So 1.9 - 1.2 is 0.7 degrees which is 0.58 times the 1.2. Then if you just take these two effects alone why don't you get the real sensitivity = 1.2 (1 + .58 + .58^2 + etc) which by this being a geometric series gives 1.2 / (1-.58) = 2.9 degrees C? Which is about the same as the fitted climate sensitivity from Hanson and Sato?????? Or is this non runaway water vapor thing here already taken into account by the method of Hanson and Sato? Also does not this way of looking at it mean that it is a darned good thing that the "water vapor constant relative humidity assumption" gives 0.7 extra degrees , instead of twice that?, which would be more than the original 1.2 degrees? 1.2 / (1-.. -
dana1981 at 14:19 PM on 24 June 2012Simply Wrong: Jan-Erik Solheim on Hansen 1988
Tom - Solheim's figure was entirely unclear to me. I couldn't tell if his arrow was intended to stop at the supposed actual forcing-corresponding temperature change, or if it was just pointing in that direction. Given that he said the model overestimates the temperature by 1.9°C, I just couldn't figure out what he was trying to show in that figure. The arrow didn't indicate a 1.9°C discrepancy unless it was simply pointing upwards toward a much higher temperature. Likewise the arrow in my Figure 1 is simply intended to point upwards in a non-specific manner. Regardless, Solheim royally screwed up, the only question is exactly how royally. If you're correct that he applied a 2.5% CO2 growth rate starting in 1951, well, that would indeed be a very royal screw-up. -
D_C_S at 11:01 AM on 24 June 2012Review of new iBook: Going to Extremes
Make that $55billion. -
D_C_S at 10:27 AM on 24 June 2012Review of new iBook: Going to Extremes
The article states that the US experienced $14billion in weather disasters in 2011. There were 14 $billion-plus-each weather-related disasters in the US in 2011, for a total cost of $54billion. See the January 26 post here: http://www.wunderground.com/blog/JeffMasters/archive.html?year=2012&month=01 -
Tom Curtis at 09:59 AM on 24 June 2012Simply Wrong: Jan-Erik Solheim on Hansen 1988
dana, by pixel count, temperature anomaly that Solheim claims would have been predicted with actual forcings is 18% higher than that for scenario A. In contrast, you only show him as showing a forcing 9% greater than that in scenario A. Curiously, if you apply a 2.5% increment to the growth of CO2 from 1951 in a manner similar to that described in Appendix B of Hansen et al, 88, the result is an 18% greater increase of CO2 concentration from 1981 to 2011 than is shown in Scenario A. This strongly suggests that Solheim has not only applied the 2001-2011 growth rate of CO2 over the entire period of the projection, despite the well known fact that growth in CO2 concentrations was much reduced in the 1990s, but that he has also treated CO2 as the only forcing. It is not certain that that is what he has done, but it is the simplest explanation of his error. As it happens, in assuming that he took a more reasonable approach, you appear to have underestimated his error. -
Steve L at 07:47 AM on 24 June 2012Arctic sea ice takes a first nosedive
The solstice occurred on the 20th (where I am) this year, but in some years it occurs on the 21st or 22nd. So could comparing to same day-of-year be adding noise? Should comparison be made instead to days relative to the solstice? -
les at 06:20 AM on 24 June 2012Review of new iBook: Going to Extremes
Doesn't seem tone available from UK itoons book shop. -
dana1981 at 05:56 AM on 24 June 2012Christy Exaggerates the Model-Data Discrepancy
Bernard @15 - wow, assuming population density is uniform over entire countries? It doesn't get much sloppier than that - unless you consider McKitrick's previous work, I suppose. Mosher suspects that doing the analysis properly will strengthen McKitrick's conclusions. Let's just say I'm skeptical, but until he does it properly, his conclusions are wholly unsupported, and certainly don't deserve consideration by the IPCC. -
tomgraywind2 at 04:28 AM on 24 June 2012Adding wind power saves CO2
Here is today's example of the crossover between climate change denial and wind detraction--an op-ed in the Wall Street Journal by a Heartland Institute representative: The Anatomy of a WSJ Article on 'Europe's Green Energy Suicide'.--Tom Gray -
John Russell at 04:12 AM on 24 June 2012Ten Things I Learned in the Climate Lab
Some think that RCP 8.5 is not realistic, because humans won't let it become that bad. I guess that's true, in theory; however what concerns me is lag. Already we've got people like James Lovelock saying that it's all happening slower than expected. The big danger -- and I base this on the track record to date -- is that our scientifically-illiterate politicians (for, let's face it, that's what they tend to be), encouraged by the short-termism of economists and the masses, might set us unwittingly on a trajectory for 8.5 and not realise where we're headed until it's too late to do anything about it. To me that's the big worry. -
Rob Honeycutt at 03:21 AM on 24 June 2012Simply Wrong: Jan-Erik Solheim on Hansen 1988
angusmac maybe needs to go back and read Hansen 1988 again. Hansen specifically states that even then the NAS had concluded climate sensitivity was likely around 3C. -
Albatross at 03:01 AM on 24 June 2012Christy Exaggerates the Model-Data Discrepancy
Bernard @15, Interesting, but not entirely surprising. McKitrick clearly has strong confirmation bias and is not qualified to undertake research outside his field. Gavin Schmidt and Mosher have now identified glaring problems with McKitrick's paper. Ironically, the self-proclaimed auditor that the fake skeptics continually fawn over, and who is also McKitrick's close compadre, failed to identify any of the egregious errors in McKitrick's paper. What is laughable (yet tragic) is what Judith Curry had to say about the horrendous paper: "Congrats to Ross for getting his paper published in Climate Dynamics, which is a high impact mainstream climate journal. My main question is whether the lead authors of the relevant IPCC AR5 chapter will pay attention to these papers; they should (and the papers meet the publication deadline for inclusion in the AR5)." But why should they pay any attention to shoddy and seriously flawed work? Curry has once again exposed her severe bias and agenda. -
Albatross at 02:43 AM on 24 June 2012Christy Exaggerates the Model-Data Discrepancy
Angusmac, We see this sort of post written by you often when the cherry picking , distortions and misrepresentations of fake skeptics are exposed. Instead of acknowledging and openly condemning the misrepresentations and errors made by Christy, the tactic seems to be to try and divert attention away from the many problems with the fake skeptic's reasoning/argument. So before this thread goes too far off topic by addressing your "suggestions", how about you please start a constructive dialogue by directly speaking to Christy's misrepresentations, cherry picking and fallacious claims outlined in the main post? Thanks. -
Bernard J. at 02:41 AM on 24 June 2012Christy Exaggerates the Model-Data Discrepancy
At the risk of drifting off-topic, but in response to the above reference to McKitrick, Steve Mosher has recently been putting the boot in to Ol' Ross over at Curry's. All one can do is to shake one's head... -
ranyl at 02:23 AM on 24 June 2012Ten Things I Learned in the Climate Lab
"With great sadness I think that, based on the current political discourse in Australia and looking at what is happening globally, at present RCP 8.5 is a realistic future. " You may be right Chris but it isn't really a future in which humankind will actually survive beyond small pockets. Indeed 2oC isn't much rosier unless we start planning for it with an adaptation transformation process (i.e. Adaptation, mitigation, and societal and economic transformation) starting sort of nowish, remembering that 2oC by 2100 means getting to 350ppm by 2100 if the pliocene data is correct. But an adaptation transformation process involves stopping using fossil fuels basically within 5 years (and all that implies) and that is a very tight carbon budget (no room for spending thousands of tonnes of Co2e on renewables or nuclear) and that is seemingly impossible for it means using a lot less power and intermittent power for certain. Therefore I think you might right Chris and despite pre-knowledge it seems humankind at present would rather deny the possibility of what a global mass depopulation actually means in terms of process (i.e. war, starvation, disease and widespread death)and will keep burning fossil fuels, but lets hope not. -
Dikran Marsupial at 01:49 AM on 24 June 2012Christy Exaggerates the Model-Data Discrepancy
angusmac wrote "Dana, I notice that you use Gavin Schmidt's RC data for you comparison instead of the official AR4 chart." If you mean figure 2, I should point out that the CMIP5 model runs are publicly available and it is straightforward to download them and recreate the plot and find that the conclusions are exactly as Gavin suggests. I know this because I have done so for a paper I am writing at the moment (with Dana). Now if you feel that the AR4 diagram tells a different story then there are two possibilities (i) The IPCC have made a serious error in analysing the output of their GCM runs or (ii) perhaps there is some subtlety that explains the apparent difference between the two diagrams that you do not understand. I would suggest that (ii) is more probably a-priori. I would suggest you start by investigating the error bars on the projections so that you know what the models actually say. I would also suggest that you look into the details of how baselining of observations and model output is performed. Then I would consider whether the choice of observational dataset makes a difference (note that Gavin uses more than one). I tell my students that science is best peformed the way a chess player plays chess, you don't play the move that maximises your immediate gain, you play the move that mimises your opponents maximum advantage. In this case, for example, if the IPCC are arguing that there will be warming the if they use the HADCRUT observations that show lower warming than GISSTEMP, then their choice is not easily criticised as being a cherry pick. Likewise if you want to argue that there is a discrepancy between models and observations then choosing the dataset that maximises the discrepancy is a questionable move. Yes I know that is the one that the IPCC uses, but that doesn't make it an equally good choice for your (or Christies) argument because of the assymetry I have just pointed out. This sort of thing lies at the heart of scientific skepticism - it much begin with self-skepticism. I'd be happy to answer any questions you have about Figure 2, or at least my version of it (which is essentially identical). -
dana1981 at 01:34 AM on 24 June 2012Simply Wrong: Jan-Erik Solheim on Hansen 1988
angusmac - climate sensitivity did not fall, the sensitivity in Hansen's climate model "fell". Climate sensitivity has always been around 3°C. You still seem entirely focused on "Hansen was wrong", in which case I again refer you to the final section in the above post. -
dana1981 at 01:28 AM on 24 June 2012Christy Exaggerates the Model-Data Discrepancy
angusmac - I would suggest you go back and re-read the post, because you're making many of the same errors that Christy made. -
Tristan at 01:28 AM on 24 June 2012Simply Wrong: Jan-Erik Solheim on Hansen 1988
Forgot my addendum! *Note that my 'B)' is Hansen's 'Scenario C', lest there be any confusion. -
Tristan at 01:17 AM on 24 June 2012Simply Wrong: Jan-Erik Solheim on Hansen 1988
Consider Hansen 1988 as a piece of advice to policy makers and investors. The advice was that different emission regimes would result in different levels of warming over the next several decades. Importantly, he advised that the temperature difference between A) Continued exponential GHG growth and B*) An emissions plateau by 2000, could be as much as 0.8C by 2019. Was this bad advice? No. Although following his advice would have resulted in a carbon price that was too high, it would have been a lot more accurate than its actual price in 1988, which was $0.00. -
dhogaza at 00:40 AM on 24 June 2012Simply Wrong: Jan-Erik Solheim on Hansen 1988
"... Climate sensitivity has fallen from ≈ 4.2°C to ≈ 2.1-2.7°C, i.e., it has fallen to 50-64% of Hansen's 1988 estimates. The above errors do not represent pretty good estimates. They are actually pretty bad and I look forward to SkS's defence of these bad results." But no one is defending 4.2C as being an accurate figure for sensitivity, so what's your point? In addition, to quote from another SkS article: "Hansen's model correctly projected amplified warming in the Arctic, as well as hot spots in northern and southern Africa, west Antarctica, more pronounced warming over the land masses of the northern hemisphere, etc. The spatial distribution of the warming is very close to his projections." So given a reasonable value for sensitivity, spatial distribution and the overall trend would've been very good. The model was and is remarkably sound for having been published in 1988. It strengthens the argument that sensitivity is around 3C (his model did not account for the decade-long solar minimum we've just experienced, either, doing so would lead to a higher sensitivity than 2.7C showing a much better fit than did 4.2C). -
angusmac at 00:35 AM on 24 June 2012Christy Exaggerates the Model-Data Discrepancy
Dana, I notice that you use Gavin Schmidt's RC data for you comparison instead of the official AR4 chart. I am quite surprised that you do not use AR4 to criticise Christy. Therefore, I include the AR4 TS.26 chart below in order to compare Gavin's diagram with actual global temperatures and the discrepancy highlighted by Christy. Figure 1: Model Projections of Global Mean Warming Compared with Observed Warming. (after AR4 Figure TS.26)
The following points should be noted about Figure 1 and AR4 Figure TS.26:
Figure 1: Model Projections of Global Mean Warming Compared with Observed Warming. (after AR4 Figure TS.26)
The following points should be noted about Figure 1 and AR4 Figure TS.26:
- I have deleted the FAR, SAR and TAR graphic from Figure TS.26 in Figure 1 because they make the diagram more difficult to understand and because they are already presented elsewhere in AR4.
- The temperature data shown in AR4 Figure 1.1 does not correspond to that shown in Figure TS.26. The Figure 1.1 data appear to be approximately 0.026 °C higher than the corresponding data in Figure TS.26. I have assumed that this is a typographical error in AR4. Nevertheless, I have used the same 0.026 °C adjustment to the HadCRUT3 data in required for AR4 Figure 1.1 for Figure TS.26. My adjusted HadCRUT3 data points are typically higher than those presented in AR4 Figure TS.26.
- Despite items (1) and (2) above, there is very good agreement between the smoothed data in TS.26 and the adjusted HadCRUT3 data presented in Figure 1, particularly for the 1995-2005 period.
- It should be noted that AR4 uses a 13-point filter to smooth the data whereas HadCRUT uses a 21-point filter but these filters are stated by AR4 to give similar results.
- There is a huge discrepancy between the projected temperature and real-world temperature.
- Real-world temperature (smoothed HadCRUT3) is tracking below the lower estimates for the Commitment emissions scenario., i.e., emissions-held-at-year-2000 level in the AR4 chart. There is no commitment scenario in the RC chart to allow this comparison.
- The smoothed curve is significantly below the estimates for the A2, A1B and B1 emissions scenarios. Furthermore, this curve is below the error bars for these scenarios, yet Gavin shows this data to be well within his error bands.
- The emissions scenarios and their corresponding temperature outcomes are clearly shown in the AR4 chart. Scenarios A2, A1B and B1 are included in the AR4 chart – scenario A1B is the business-as-usual scenario. None of these scenarios are shown in the RC chart.
- The RC chart shows real world temperatures compared with predictions from models that are an "ensemble of opportunity". Consequently, Gavin Schmidt states, "Thus while they do span a large range of possible situations, the average of these simulations is not 'truth" [My emphasis].
Moderator Response: [Dikran Marsupial] Please restrict the width of the images in your posts (I have restricted this one to 450 pixels) -
Dave123 at 23:47 PM on 23 June 2012Christy Exaggerates the Model-Data Discrepancy
Ross McKittrick is a signatory to the Cornwall Alliance Declaration: WHAT WE BELIEVE We believe Earth and its ecosystems—created by God’s intelligent design and infinite power and sustained by His faithful providence —are robust, resilient, self-regulating, and self-correcting, admirably suited for human flourishing, and displaying His glory. Earth’s climate system is no exception. Recent global warming is one of many natural cycles of warming and cooling in geologic history. We believe abundant, affordable energy is indispensable to human flourishing, particularly to societies which are rising out of abject poverty and the high rates of disease and premature death that accompany it. With present technologies, fossil and nuclear fuels are indispensable if energy is to be abundant and affordable. We believe mandatory reductions in carbon dioxide and other greenhouse gas emissions, achievable mainly by greatly reduced use of fossil fuels, will greatly increase the price of energy and harm economies. We believe such policies will harm the poor more than others because the poor spend a higher percentage of their income on energy and desperately need economic growth to rise out of poverty and overcome its miseries. WHAT WE DENY We deny that Earth and its ecosystems are the fragile and unstable products of chance, and particularly that Earth’s climate system is vulnerable to dangerous alteration because of minuscule changes in atmospheric chemistry. Recent warming was neither abnormally large nor abnormally rapid. There is no convincing scientific evidence that human contribution to greenhouse gases is causing dangerous global warming. We deny that alternative, renewable fuels can, with present or near-term technology, replace fossil and nuclear fuels, either wholly or in significant part, to provide the abundant, affordable energy necessary to sustain prosperous economies or overcome poverty. We deny that carbon dioxide—essential to all plant growth—is a pollutant. Reducing greenhouse gases cannot achieve significant reductions in future global temperatures, and the costs of the policies would far exceed the benefits. We deny that such policies, which amount to a regressive tax, comply with the Biblical requirement of protecting the poor from harm and oppression. Signature page I do not consider it an ad homenim attack when someone publicly declares that his mind is made up, and he cannot be confused by the facts. Why should any University accept any work by McKittrick as a serious work of scholarship, as opposed to theologically motivated propaganda? -
Dikran Marsupial at 22:30 PM on 23 June 2012Simply Wrong: Jan-Erik Solheim on Hansen 1988
@angusmac in your opinion, how close an agreement should we expect to see between a "good" projection and the observations? I ask this because the model projections are necessarily only a projection of the forced component of climate, whereas the observations are the results of both the forced component and an unforced component (i.e. "weather noise"). So even if the models project the forced component perfectly, the projection will still be expected to differ from the observations. In 1988, Hansen didn't have the computing power to also estimate the error bars on the projections, but assessment of model skill still needs to be dependent on the inherent uncertainties. My question is intended to determine whether your expectations of the projections are reasonable, and on what basis you decide whether a projection is good or bad. -
angusmac at 21:38 PM on 23 June 2012Simply Wrong: Jan-Erik Solheim on Hansen 1988
Moderator@47 thank for the off-topic clarification. Dana@33 (also Tom Curtis@34 & Sphaerica@35) I am not missing the point regarding Scenario C being the best fit for actual temperatures – whether coincidental or not. Nevertheless, instead of using the "incorrect" Scenario C , I shall try to explain by using Dana's amendment to Scenario B, which I will call Scenario D. In Scenario D, Dana multiplies the Scenario B data by a factor of (0.9*3/4.2), which equates to temperature sensitivity of 2.7°C. I assume that the Scenario D multiplication factor is based on the approximation in Schmidt (2009). The resulting temperatures are compared with Hansen's projections in Figure 1 (see SkS for the Scenario D data and GISS for real-world temperatures).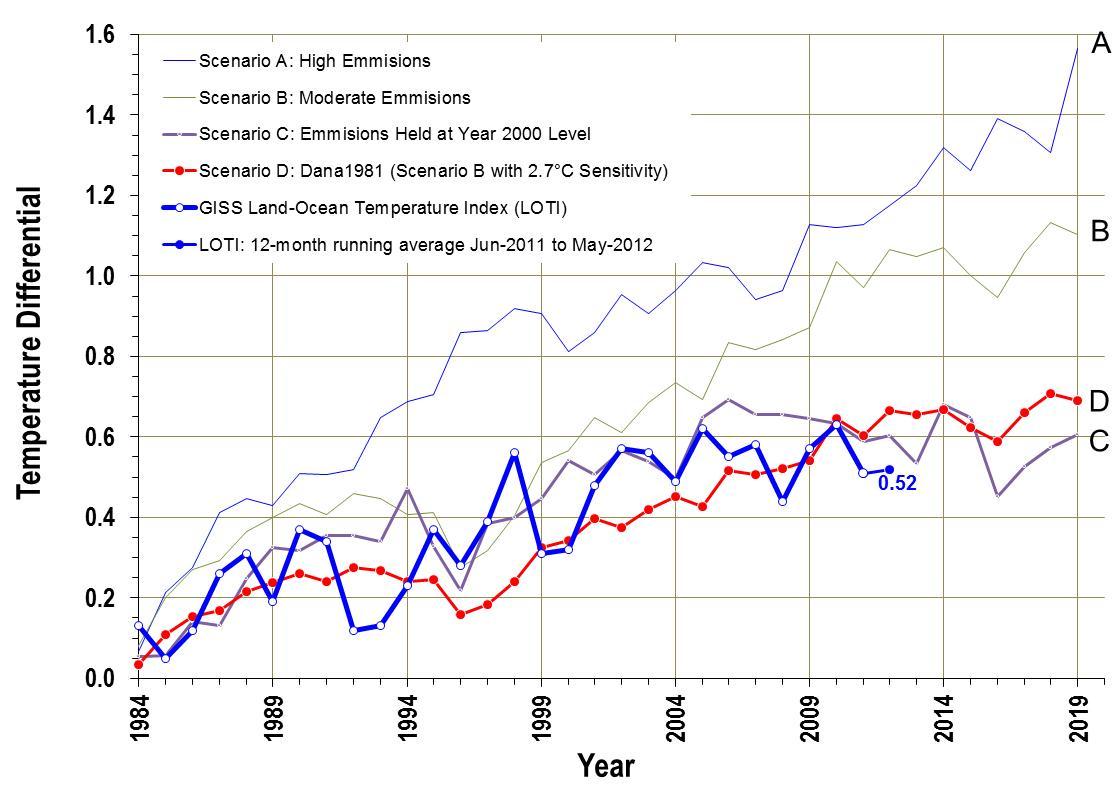 Figure 1: Hansen's 1988 Scenarios compared with Real-world Temperatures
It is evident from Figure 1 that the differences between Scenarios A and B and the "correct" Scenario D are huge. They certainly are not small, nor are they of the order of 10% as stated in RealClimate (2011).
I summarise the conclusions from the scenarios and the real-world data compared with Hansen (1988) as follows:
Figure 1: Hansen's 1988 Scenarios compared with Real-world Temperatures
It is evident from Figure 1 that the differences between Scenarios A and B and the "correct" Scenario D are huge. They certainly are not small, nor are they of the order of 10% as stated in RealClimate (2011).
I summarise the conclusions from the scenarios and the real-world data compared with Hansen (1988) as follows:
- Temperature projections for 2019 have plummeted from 1.57°C in 1988 (Scenario A) to 0.69°C in 2011 (Scenario D).
- Estimates of actual temperature (LOTI) for 2012 are in error by ≈ 60% for Scenario B and 127% for Scenario A.
- Climate sensitivity has fallen from ≈ 4.2°C to ≈ 2.1-2.7°C, i.e., it has fallen to 50-64% of Hansen's 1988 estimates.
-
angusmac at 18:49 PM on 23 June 2012Simply Wrong: Jan-Erik Solheim on Hansen 1988
Tom Curtis@34 & Sphaerica@35 I apologise if you find the term "SkS faithful" condescending but at least it is not abusive in the way that the term "denialist" is. Yet, "denialist" frequently populates SkS. Furthermore, if you check the synonyms for "faithful" from the Cambridge Dictionary here and shown below for ease of reference they suggest, "as-good-as-your-word, reliable, consistency". There is nothing condescending in the above synonyms for "faithful".
To the contrary the term "denialist" is objectionable and insulting when applied to someone who has valid but contrary scientific views.
It is most objectionable when applied to climate change sceptics because it conjures up the spectacle of a fanatic denying the Holocaust. To call someone who is sceptical about a theory, e.g., AGW, a "denialist" is an insult to the way that real science works.
Notwithstanding the above, neither Tom nor Sphaerica called me a "denialist", although Sphaerica did suggest that I post on WUWT. No thanks Sphaerica. In my occasional posts, I prefer to try to advance rational scientific debate on this site.
Moderator Response: [Dikran Marsupial] A common rhetorical device used by skeptics in the climate debate is to portray the mainstream view as a religion with followers blindly acting on faith rather than rationally. Thus talking of the "SkS faithfull" is likely to be inflamatory, as is "denialist" (as noted in the comments policy). Please let us all avoid the use of either term (or variants) in the interest of productive discussion of the science. Further discussion of the meanings of "faithful" and "denialist" are off-topic and will be deleted.
There is nothing condescending in the above synonyms for "faithful".
To the contrary the term "denialist" is objectionable and insulting when applied to someone who has valid but contrary scientific views.
It is most objectionable when applied to climate change sceptics because it conjures up the spectacle of a fanatic denying the Holocaust. To call someone who is sceptical about a theory, e.g., AGW, a "denialist" is an insult to the way that real science works.
Notwithstanding the above, neither Tom nor Sphaerica called me a "denialist", although Sphaerica did suggest that I post on WUWT. No thanks Sphaerica. In my occasional posts, I prefer to try to advance rational scientific debate on this site.
Moderator Response: [Dikran Marsupial] A common rhetorical device used by skeptics in the climate debate is to portray the mainstream view as a religion with followers blindly acting on faith rather than rationally. Thus talking of the "SkS faithfull" is likely to be inflamatory, as is "denialist" (as noted in the comments policy). Please let us all avoid the use of either term (or variants) in the interest of productive discussion of the science. Further discussion of the meanings of "faithful" and "denialist" are off-topic and will be deleted. -
Riccardo at 18:37 PM on 23 June 20122012 SkS Weekly Digest #24
I've not much to say to someone who frame the discourse politically and then claim that science is held hostage. This is exactly what he's trying to do and what the scientists are fighting against. -
adamski5807 at 17:19 PM on 23 June 20122012 SkS Weekly Digest #24
Soundoff - I am sick of this line of attack. Garth Paltridge's puff piece shows how capitalists genuinely fear AGW, not because of the devastation that they KNOW is more and more likely to occur the more we pollute, but rather the changes in social relations, hierarchy, decision making and power. Challenging the current economic model is a challenge to neo-liberial laissez-faire capitalists like Paltridge where the principles and laws of science must be bypassed, ignored or even suspended to protect faith based beliefs. A post modernist claiming post modernist science?? Pathetic. -
Chris McGrath at 16:27 PM on 23 June 2012Ten Things I Learned in the Climate Lab
As I understand RCP 8.5, it is based on burning pretty well all of the globes' recoverable fossil fuels. Speaking from an Australian perspective (I am in the State of Queensland which has a lot of coal and CSG), burning all our fossil fuels irrespective of whether CCS is ever viable is pretty well the accepted paradigm from government, industry and the community. We (i.e. the State of Queensland) have something like 150 years of coal at current production rates (of 200 Mt/yr) and some truly enormous new mines being proposed, plus enormous CSG development. We plan to dig it all up and allow it to be burnt here or overseas. Our national and state governments, not to mention the mining and CSG industries, are fully committed to this future. While we soon will have a small price on direct carbon emissions in Australia (although no price on emissions from coal and CSG exports) our main strategy seems to be to postpone any major reduction in emissions for decades (we have a target of an 80% reduction by 2050, which is punting it well down the track for future governments to deal with). With great sadness I think that, based on the current political discourse in Australia and looking at what is happening globally, at present RCP 8.5 is a realistic future. -
tomgraywind2 at 12:08 PM on 23 June 2012Adding wind power saves CO2
#18 SoundOff Yes, UWIG (whose name has been changed to Utility Wind Integration Group) is an excellent source for factual information, in as much detail as anyone could want, about utility integration of wind power. Readers should be sure to use www.uwig.org and not just uwig.org to access it, as for some odd reason the latter will not work. See especially the Variable Generation Integration Library in the left column of the page--it contains many high-quality technical papers on the topic.--Tom Gray -
tomgraywind2 at 12:02 PM on 23 June 2012Adding wind power saves CO2
#26 Lowcarbonkid It is also wind's misfortune to be the first major energy technology to come along after the advent of the Internet, which allows misinformation to spread at the speed of light, and everyone to become a publisher. Virtually every local anti-wind group in the world has a website that gathers and shares misinformation from all other anti-wind websites.--Tom Gray -
tomgraywind2 at 11:57 AM on 23 June 2012Adding wind power saves CO2
#9 MarkR Yes, wind technology has improved dramatically since the 1980s, and I agree this probably accounts for the difference in EROI. There is a significant advantage to larger scale--since A equals pi x r squared, a small addition to blade length means a large addition to rotor swept area--and today's larger machines take advantage of that. Also, taller turbines can harvest enough additional energy from the more energetic winds higher off the ground to more than pay for the extra tower cost. There have been many, many incremental technology improvements, but those are two of the big ones.--Tom Gray -
tomgraywind2 at 11:49 AM on 23 June 2012Adding wind power saves CO2
#8 Rob Honeycutt, I think your impression that there is a mismatch between established energy industries and emerging ones in terms of resources is correct. Not too long ago, I saw a brief report that said the advertising by a single large U.S. oil company for a quarter was larger than the advertising spending by all of the U.S. renewable energy industries put together for an entire year. It's hard to overstate the difficulties this poses, though I'm sure they are familiar to those working in the climate communications field.--Tom Gray -
tomgraywind2 at 11:44 AM on 23 June 2012Adding wind power saves CO2
I'm a consultant and do some work (in communications) for the American Wind Energy Association (AWEA). In that capacity, I spend much of the time responding to, shall we say, "wind detractors"--many of them writing under the banner of the same groups and outlets that feature climate deniers. Quite a relief to come here and find a largely fact-based discussion, so thanks. EROI is not something that gets a ton of attention in the detractor-sphere, but wind's supposed inability to reduce emissions comes up fairly regularly. You can see AWEA's response to the Argonne study (the one that looks only at Illinois in isolation) here: Fact check: Coverage of Argonne wind and emissions study flawed, June 1, 2012.--Tom Gray -
climatehawk1 at 10:56 AM on 23 June 2012Adding wind power saves CO2
@6 Mark R, What the citation from ORNL actually says is that the thermal energy in a ton of coal is equivalent to 6,152 kWh. About two thirds of that thermal energy is lost during the generation of electricity--the actual output from coal-fired generation is roughly 2,000 kWh per ton (making it easy to remember). -
SoundOff at 10:24 AM on 23 June 20122012 SkS Weekly Digest #24
Here’s an article that ran today and that really raised my ire. Perhaps someone at SkS has the energy to respond to it. Science held hostage in climate debate – a Financial Review article by Garth Paltridge -
Bob Lacatena at 10:20 AM on 23 June 2012Ten Things I Learned in the Climate Lab
It's nice to hear from the troops in the trenches! A lot of people could learn a lot from hearing about what it's like to actually work with climate models (as opposed to the vacuous, echo-chamber pseudo-understanding that most people have of climate models). I look forward to seeing more posts (with maybe more detail, and an anecdote or two) like this one.
Prev 1144 1145 1146 1147 1148 1149 1150 1151 1152 1153 1154 1155 1156 1157 1158 1159 Next


