


 Arguments


Recent Comments
Prev 1147 1148 1149 1150 1151 1152 1153 1154 1155 1156 1157 1158 1159 1160 1161 1162 Next
Comments 57701 to 57750:
-
tonydunc at 01:07 AM on 21 June 2012Simply Wrong: Jan-Erik Solheim on Hansen 1988
Poodle, the problem might be that you are not noting that everyone, Hansen included, accepts that Hansen's sensitivity of 4.2°C for doubling of CO2 was wrong at least for the short term. This is something that I have repeatedly pointed out to deniers but it is almost never acknowledged. SO yes his predictions are too warm for that reason. Also there are numerous factors such as Asian aerosols, persistence of La Niña, etc, that could be dampening the effects of CO2 on the short term as well. That could also "make" his "predictions" wrong" but not his science. -
MarkR at 00:57 AM on 21 June 2012Adding wind power saves CO2
#3 john mfrilett Johnny Vector is right. The Energy Return on Investment counts the energy in the fuel as 'free'. This is a way of getting an idea of the useful energy returned to the economy based on inputs. A random figure I didn't want to bulk out the text with: ORNL says you get ~6150 kWh of electricity per ton of coal. A 3.6 MW wind turbine weighs hundreds of tons and over 20 years produces ~30,000 tons of coal worth of electricity. Suddenly the EROI figures sound a bit more believable. -
Johnny Vector at 00:04 AM on 21 June 2012Adding wind power saves CO2
john @3: This calculation does not include the energy in the fuel. This is strictly looking at the energy coming out of the plant divided by the total energy it takes to build and operate the plant over its lifetime. That includes the energy to make the materials out of which the plant is built, to build it, to maintain it, to mine/pump and transport the fuel, and to shut the plant down safely when it's no longer useful. So, coal takes a lot of energy to mine and transport, which reduces the lifecycle efficiency. Nuclear plants, OTOH, get a lot of power out of a smaller amount of mining (I think), but their decommissioning takes a lot of energy. Wind turbines probably cost more per kW to build and install than coal plants, but they require almost no energy to operate and decommission. So they win in this measure. The reason this is important is that you could imagine wind turbines being so large and complex that the energy needed to build them would be more than the energy you would ultimately get from them. Ethanol from corn, for example, is on the hairy edge of being energy neutral in this way. Growing the corn and processing it takes roughly (i.e. within a factor of 2) the same amount of energy as you get by burning the ethanol. -
MA Rodger at 23:46 PM on 20 June 2012Adding wind power saves CO2
cynicus The anti-wind lobby do a good job of disinformation and sadly the wind industry seem singularly inept (here in UK) at presenting its case. In 'your recent online discussion', I'd say I smell a rat. Getting information "first-hand from the plant operators" sounds like rubbish unless it is a public source, one which "the other" appears to be keeping private. Note also to crazy logic of saying "gas is currently so expensive" so the coal plants are used as the 'spinning reserve' resulting in "very high balancing costs." A few years back, the UK power industry was trying to get subsidies for new gas power-plants by pleading that high wind capacity would result in all their new gas power-plants running intermittently as the 'spinning reserve'. .e.g. here. Their latest wheeze to get gas catagorised as 'low carbon' for the next 30 years appears to be more successful. e.g.here. And of course, within such a political ding-dong any amount of crazy logic is par for the course. However, such talk, whatever the source, doesn't mean it describes something that is actually happening. -
john mfrilett at 23:45 PM on 20 June 2012Adding wind power saves CO2
Some one please explain to me how a coal plant can produce more energy that it consumes? The coal generating station would have to operate at greater than 100% efficiency to produce numbers on the graph. I thought coal plants needed about 3 units of energy (sorry I have no reference for this) for every unit they produced? To my mind wind is a far better deal than this article suggest. -
Riccardo at 23:38 PM on 20 June 2012Seagrasses Can Store as Much Carbon as Forests
In general, I'd expect that calcareous species will be/are affected most by a pH reduction, not sea-grass which might even benefit from added CO2. Though, I should have said I don't know, I'm sure a google search will do better. -
thepoodlebites at 22:19 PM on 20 June 2012Simply Wrong: Jan-Erik Solheim on Hansen 1988
18. Belay my last, make that Hansen's 1988 (not 1998) temperature predictions (both A and B) were too warm. Sorry about that, I try to be careful. Those responsible for sacking the people who have just been sacked, have been sacked. -
thepoodlebites at 22:13 PM on 20 June 2012Simply Wrong: Jan-Erik Solheim on Hansen 1988
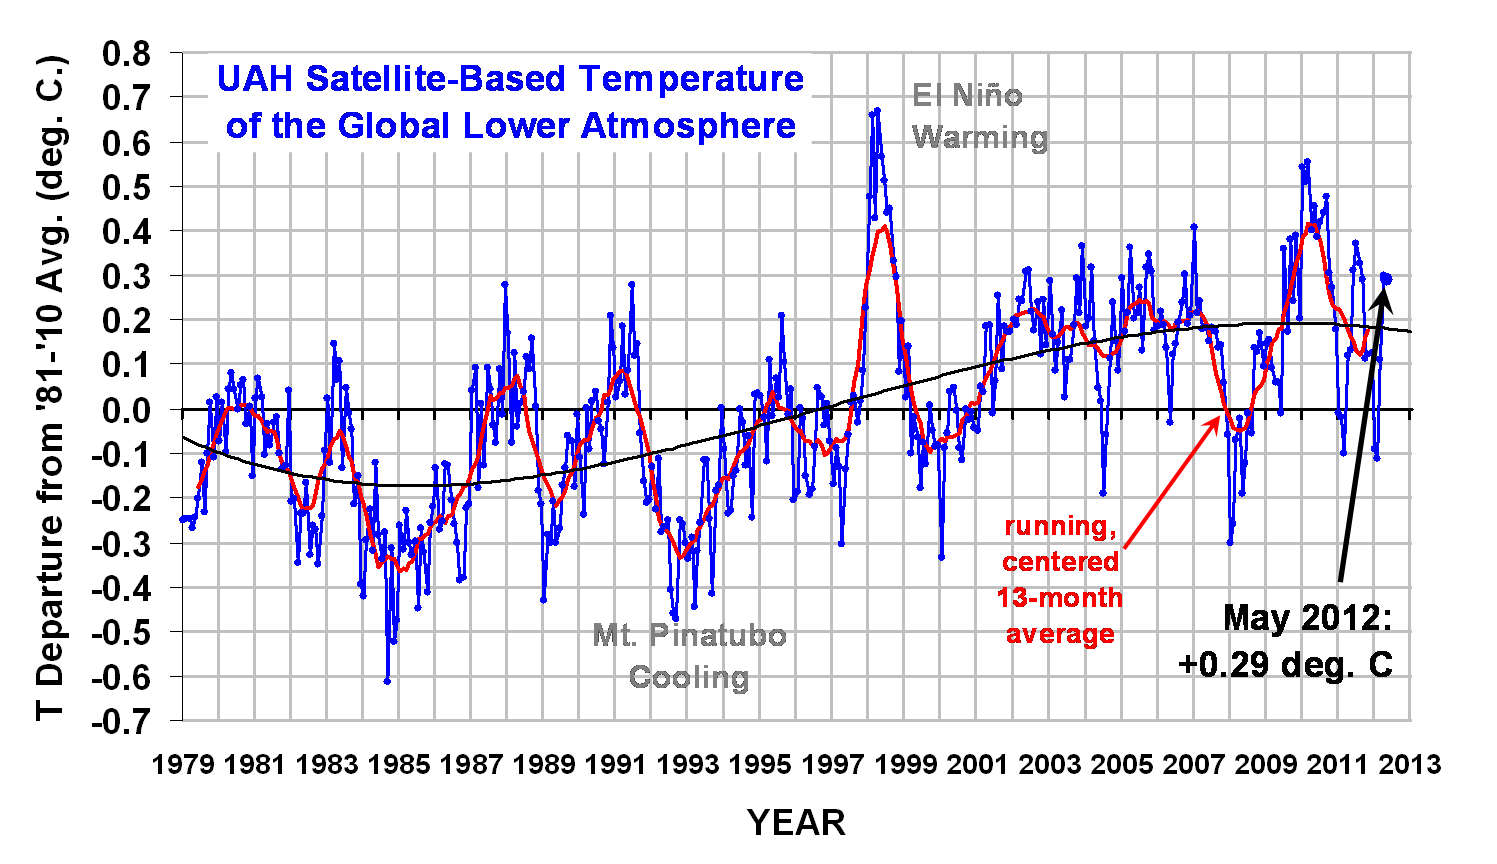
Bill, you're accusing me of persnickety strawmen but I'm just trying to understand the woodfortrees.org plot. Thanks Dana1981. A 60-month average definitely changes how one interprets the observations. I've included the 13-month UAH plot and we can clearly see the 1998 and 2010 El Nino events. I agree that Solheim's 1998 peak seems exaggerated but this doesn’t change the argument that Hansen’s 1998 temperature predictions (both A and B) were too warm. I’m still skeptical about actual emissions being closer to B but will study more about that. I guess you can accuse me of being a nit-pick about the empirical evidence but it represents the best ground truth that we have so far. -
funglestrumpet at 22:03 PM on 20 June 2012Seagrasses Can Store as Much Carbon as Forests
What effect does ocean acidification have on seagrass? -
cynicus at 19:56 PM on 20 June 2012Adding wind power saves CO2
Question about: "The inefficiency from turning power stations on and off takes a bite out of the savings that wind power brings, but since the most polluting power stations get turned off first the savings are still big." I recently had an online discussion where I claimed this, since gasturbines (e.g. STEG powerplants) are much more suitable and efficient in loadfollowing then coal-plants, the wind-intermittency would be balanced by the gasturbines. The other claimed that gas (in Western-Europe) is currently so expensive that coal-plants are used to do the balancing, causing massive CO2 releases from wind-balancing and very high balancing costs (i.e. 30 Euro/MWh which is 10x higher then most studies show in even high wind grid penetration levels). I have a hard time to believe this but he claims to have this information first-hand from the plant operators. Can anyone from the business comment on this? -
cynicus at 19:09 PM on 20 June 2012Adding wind power saves CO2
Another research paper (2009 thesis) by Bart Ummels from TU Delft in cooporation with grid operator TenneT that focusses on the situation in The Netherlands shows roughly the same results as Valentino et al. 2012: high levels of windpower can be integrated into the grid without large changes to the grid and provide significant CO2 emission reductions. As a sidenote: De Groot and LePair appear stereotypes for the retired physicist who venture into an area they know too little about but with an axe to grind. They are notorious in The Netherlands for their anti-wind news articles. They indeed show their true colors when they falsely argue that wind forecasts aren't used and that all backup is provided by the least efficient power stations possible (Open-Cyle Gas Turbines). Bart Ummels has also commented on the claims by LePair&co., unfortunately in Dutch, but his critique agrees with the critique provided here by MarkR. -
Neven at 18:07 PM on 20 June 2012Arctic sea ice takes a first nosedive
Now that you know what to look for, shoyemore, check out today's ECMWF weather forecast, click N-Hem. and then 144h onwards on the 500 hPa, SLP row. You see those huge high-pressure systems over the Canadian Archipelago? If those come about, the ice in the Northwest Passage is going to break up so hard. -
shoyemore at 17:43 PM on 20 June 2012Arctic sea ice takes a first nosedive
Neven & Sphaerica, Thanks guys. I am now fully armed for the melt season. -
scaddenp at 17:27 PM on 20 June 2012New Research Lowers Past Estimates of Sea-Level Rise
I cant find a really suitable solution thread, but I have continued here. -
scaddenp at 17:26 PM on 20 June 2012Three new studies illustrate significant risks and complications with geoengineering climate
Continuing a discussion that started here. Eric. There are multiple issues here: 1/ Progress might be inevitable, but you cannot expect progress that violates physical laws and you cannot assume that just because something can be done then it is economic to do so. Just looking at the hurricane or El Nino data and you see that minimum energy costs are huge. Why would you assume that it is economic to spend this energy rather reduce emissions? 2/ A chaotic system obeys physical laws. Not all states are possible. Air that is cold with respect to surrounding will settle creating the high just as warm air rises. You might move the cyclone belt around (with enormous energy inputs) within some bounds but its general position is determined by the radiative heating profile of the planet. 3/ The increasing southward trend is warming Antarctica's fringes, bringing rain to melt the ice and increasing the issues of sealevel rise, not decreasing it. Look at the GRACE map of mass loss/accumulation and ice loss trend. -
DSL at 14:53 PM on 20 June 2012Glimmer of hope? A conservative tackles climate change.
Total agreement, TC. Having the same conversation on several threads around the nets. I'm probably considered "progressive" by people who feel the need to label me. Even so, when I read the Fumento piece, I felt some sort of weight lift from my shoulders. -
Tom Curtis at 14:16 PM on 20 June 2012Glimmer of hope? A conservative tackles climate change.
pa32r @25, I come from a very different political perspective to either you or Daniel. However, I absolutely agree that the key issue here is whether or not you are guided by the science or not. I would gladly accept a conservative response to climate change, so long as it was an effective response; and am very happy for conservatives such as you, Daniel, Barry Bickmore and Richard Alley to have a voice. -
Tom Curtis at 13:56 PM on 20 June 2012Simply Wrong: Jan-Erik Solheim on Hansen 1988
Bill, haven't you heard of a "Straw Nit" fallacy before ... -
Daniel Bailey at 13:46 PM on 20 June 2012Glimmer of hope? A conservative tackles climate change.
"Anyway, my point is that there are people of a conservative frame of mind who are not enemies of facts."
As a conservative American who contributes to this forum, I felt your comment resonated with me. I hold many of the "classical" conservative values you mention dear yet differ from those Republicans I get classified (by default) with for much the same reasons as you."One would think that the readership of SkS would regard that as a good thing."
I do. Keep posting. -
pa32r at 13:17 PM on 20 June 2012Glimmer of hope? A conservative tackles climate change.
It's interesting to read the comments. I've blogged myself that I'm philosophically very aligned with "small l libertarianism" but that philosophy must yield to the realities of the limits of a finite planet in terms of resource depletion and self-poisoning (of which climate change is one, but not the sole, example). I'm also conservative in a classical sense of conserving natural resources, financial wherewithal, personal responsibility, the rights enshrined in the Bill of Rights, etc. I've also blogged that I'm most embarrassed, when describing myself as conservative, to be associated with today's Republican party and the so-called conservative mouthpieces. I've got a post entitled "I used to be a Republican," which I did. Of course, I ended that post with "But don't mistake me for a Democrat." Therefore, I'm a bit taken aback by comments from such as ralbin who would, I believe, write such as me off when I contrarily think "my type" is, in a sense, key to our chances. Anyway, my point is that there are people of a conservative frame of mind who are not enemies of facts. One would think that the readership of SkS would regard that as a good thing. -
bill4344 at 12:37 PM on 20 June 2012Simply Wrong: Jan-Erik Solheim on Hansen 1988
It appears that rather than addressing the meat of the post, poodle is trying to pick nits, but his nits are made of straw.
I completely agree, but I'm afraid I will have to arrest you for Crimes Against Metaphor... ;-) -
Neven at 09:42 AM on 20 June 2012Arctic sea ice takes a first nosedive
Thanks for that link, Sphaerica. That's a better explanation than I could ever come up with. -
Neven at 09:38 AM on 20 June 2012Arctic sea ice takes a first nosedive
The T stands for Tief, I believe, which is German for Low. Looking at the SLP numbers also helps. Anything above 1013 millibar or hPa is high-pressure system, below is low-pressure. So when from one isobar (the white lines) to the other the pressure goes up (for instance from 1015 to 1020 to 1025, etc) there's a high-level pressure system there. I don't look at the letters and colours too much, mostly the numbers and the shape of the isobars (telling me the direction of the wind). Again, it's very crude, but it works reasonably well. Highs on the Canadian side of the Arctic, and lows on the Siberian side, also known as the Dipole Anomaly, make the Beaufort Gyre gyre, the Transpolar Drift Stream drift. The ensuing ice transport, combined with clear skies and eventually pulling in of warm Pacific waters through Bering Strait (as happened in 2007), makes for the fastest ice decrease in summer. -
Bob Lacatena at 09:33 AM on 20 June 2012Arctic sea ice takes a first nosedive
shoyemore, This explanation of how to read such maps is helpful (armed with T = low and H = high). -
Bob Lacatena at 09:29 AM on 20 June 2012Arctic sea ice takes a first nosedive
shoyemore, I don't speak German, but from this I would guess that T is for trog (low pressure) while H is for hoch or hochdruck (high pressure). GPDM is short for geopotential decameters, while bodendruck is "pressure". -
shoyemore at 08:05 AM on 20 June 2012Arctic sea ice takes a first nosedive
Neven, Thanks, can you explain those Wetterzentrale maps, please? What does T mean? I presume H is high pressure, and the colour is the pressure gradient. Not knowing German makes it difficult. I see Ireland has a massive gloomy spot over it. That figures - national team dumped unceremoniously out of the European Cup (soccer) with nul points. -
dana1981 at 06:40 AM on 20 June 2012Simply Wrong: Jan-Erik Solheim on Hansen 1988
poodle, the troposphere is the lowest layer of the atmosphere. KR - I believe poodle's point is that there exists a data set with a certain smoothing for which the data around 1998 is hotter than the subsequent data. However, that argument is a strawman, because nobody said anything to the contrary. The above post correctly noted that there is no data set for which 1998 is hotter than subsequent years when a 5-year running mean (which Solheim claimed to apply) is used, as you show in your link (also linked in the post). It appears that rather than addressing the meat of the post, poodle is trying to pick nits, but his nits are made of straw. -
vrooomie at 06:13 AM on 20 June 2012Arctic sea ice takes a first nosedive
CBD@4: I *especially* love your subtle use of humor, in your post, by using the future tense; "will be." "...insanity will be pretty much all that is left for 'skeptics' at that point." Ar ar....{;=P -
KR at 05:44 AM on 20 June 2012Simply Wrong: Jan-Erik Solheim on Hansen 1988
thepoodlebites - Looking, as you suggest, at the WoodForTrees data (with a 60 month running mean, as per the actual discussion here), not even the RSS data shows 1998 as the peak anomaly, let alone UAH. So no, 1998 is not the peak year in either surface or lower tropospheric temperature data 5-year averages. Clearly, Solheim was not using a 5-year uniform mean filter; perhaps a Loess smooth, a tapered mean, or a shorter period? My best reconstruction of his graph is actually with an approximately 13-month running mean. At the very least he has poorly labeled/explained his data. Now - What point were you trying to make? -
Neven at 05:43 AM on 20 June 2012Arctic sea ice takes a first nosedive
The NSIDC has an extra June update explaining the recent nosedive. -
Neven at 05:01 AM on 20 June 2012Arctic sea ice takes a first nosedive
@ shoyemore I notice that JAXA seems to have revised downwards the big breaks they were posting for the past few days, and the Arctic Oscillation has turned positive. You can disregard that latest data point that JAXA reports. It's very low every day, and then gets revised significantly the next day. I don't use it for the ASI updates. Here's another tip with regards to that last bit about weather patterns: If you go to the ECMWF weather forecast on Wetterzentrale you can click on N-Hem. and then the daily forecasts (24h, 48h, 72h, etc) at 500 hPa. This allows you to see a couple of days in advance where the highs and lows are going to be. In 5 to 6 days that low that is dominating right now, is forecast to get pushed back again, with highs taking over the Canadian Archipelago and part of the Beaufort Sea. I'd like to be cautious, but if this comes about, there could be some more big drops keeping 2012 in the driver's seat. We'll see. A 6 day forecast can change from day to day. -
thepoodlebites at 04:52 AM on 20 June 2012Simply Wrong: Jan-Erik Solheim on Hansen 1988
10 dana1981 What's the difference between a lower troposphere temperature data set and a lower atmosphere data set? Why not say "which is not true of any surface temperature data set" and leave "or lower atmosphere data set" out of the sentence. What do you mean by "lower atmosphere data set"? -
CBDunkerson at 04:09 AM on 20 June 2012Arctic sea ice takes a first nosedive
Bernard, actually when the ice disappears I'm quite confident that the skeptic response will be, 'So what? Everyone knew that was going to happen. It is perfectly normal. Happened back in the 1930s too. Natural cycle. Look, e-mails!' All of which is, of course, completely insane... but insanity will be pretty much all that is left for 'skeptics' at that point. BTW, the first 'SEARCH' ice extent predictions for the year have been released. These were submitted prior to the recent rapid decline, but all predictions (even Watts) are for far below normal September extent. PIOMAS is also showing the same sharp drop in volume anomaly (i.e. the volume decline is much greater than average) starting in May which has characterized the past few years. What we've been seeing with extent and area in June suggests that this volume trend is continuing. -
dana1981 at 03:58 AM on 20 June 2012Simply Wrong: Jan-Erik Solheim on Hansen 1988
poodle - first of all, 13 months is not 5 years. Secondly, UAH is a lower troposphere temperature data set, not a surface temperature data set, and the Hansen 1988 projections were of surface temps. Third, 1998 is only hotter in UAH because El Nino is amplified more in atmosphere than surface temps (hence you shouldn't be comparing the two). -
MP3CE at 03:57 AM on 20 June 2012Arctic sea ice takes a first nosedive
Worth to mention here, but Tamino has also posted on his blog about Arctic Sea Ice: http://tamino.wordpress.com/2012/06/17/sea-ice-update/Moderator Response: [Sph] Hot linked. -
L. Hamilton at 03:54 AM on 20 June 2012Scientific literacy and polarization on climate change
That's a well-known pitfall for survey research, called "response set bias." It's something to always keep in mind when designing a survey, or when looking at data from a survey designed by others. My "just right" example above, for instance, has been carried on two different surveys, neither of which said another word about ice or polar regions. Despite different samples (one statewide and one national) and otherwise mostly different questions on each survey, they produced similar results. These conclusions I'm talking about are pretty robust. -
Eric (skeptic) at 03:40 AM on 20 June 2012Scientific literacy and polarization on climate change
L. Hamilton, thanks for the details. I agree the second question is just right and a "no brainer". My only quibble with the observation in your last sentence is that those similar correlations may come from the respondent's view of the questions as a whole. Will the respondent answer in "contrarian" ways because some questions (not your latest example but the prior one) appear oversimplified? If that is the case then the correlation is not from respondent qualities to each question but from respondent qualities to the whole set of questions. -
adamski5807 at 03:25 AM on 20 June 20122012 SkS Weekly Digest #24
Feeling so helpless and useless at the moment. Quite depressing. Did you guys read this?? Game Over For The Climate? 'Whatever happened to the green movement? It’s been 50 years since the publication of Rachel Carson’s classic Silent Spring, a powerful book about the environmental devastation wreaked by chemical pesticides. Since then we’ve had the rise and fall - or at least the compromised assimilation - of green groups such as Friends of the Earth, Greenpeace and Forum For the Future. Last week, the Independent marked the half-century with a well-meaning but frankly insipid ‘landmark series’ titled ‘The Green Movement at 50’. But there’s a glaring hole in such coverage; and, indeed, in the ‘green movement’ itself: the insidious role of the corporate media, a key component of corporate globalisation, in driving humanity and ecosystems towards the brink of destruction" http://www.medialens.org/index.php?option=com_content&view=section&layout=blog&id=1&Itemid=50 -
Bernard J. at 02:19 AM on 20 June 2012Arctic sea ice takes a first nosedive
Back in the day when frosts were common here*, I used to watch the frozen puddles go from being almost completely sheeted in ice to clear water in just a matter of minutes, once the mornings had warmed sufficiently. So it will be, I predict, that Arctic summer sea ice extent will appear to be still 'relatively' high for some small number of years into the future, but following a few warm summers that summer sea ice will spectacularly disappear - like the thinning ice used to do on the puddles on the west side of my house. Of course, anyone who follows Arctic sea ice volume (or thickness) rather than area/extent will not be caught off-guard, but I am sure that come the time there will be loud brays of faux surprise from those who currently claim that there's nothing more happening than a breezy shifting of a few burgs. [*Prior to the last decade it was usual in my area to have had by this time of year, as the austral winter approaches, about a dozen or so of of those teeth-setting crunchy frosts. So far this year we've had nothing even remotely resembling ice. There have been other changes too - to avoid going off-topic, I'll just note that I commented about them on Deltoid's June Open Thread, at tmie-stamp June 15, 12:57 pm.] -
thepoodlebites at 02:02 AM on 20 June 2012Simply Wrong: Jan-Erik Solheim on Hansen 1988
For Figure 2, the above statement "His plot shows the purported 5-year running average temperature around 1998 as hotter than at any later date to present, which is not true of any surface or lower atmosphere temperature data set" contains a link to a "woodfortrees.org" plot. But if you use Roy Spencer's website, the 13-month running mean clearly shows that 1998 and 2010 are tied (+0.4)C. So the assertion that 1998 was not hotter than at any later date is a bit misleading. Both 1998 and 2010 were peaks in global averaged temperatures in response to El Nino events. -
vrooomie at 01:42 AM on 20 June 2012Glimmer of hope? A conservative tackles climate change.
Lloyd@17, truer words I have not seen written here. I am usually fairly centrist, with a left-leaning tendency on social issues. The "right" has taken upon itself as a Crusade, to be against *anything* the "left" are for, irrespective of its basis in fact. As an earth scientist (geologist) with a strong interest in climate change, I find it increasingly and frustratingly difficult to use reason and logic with any denier. "I think conservatism [in the USA] has become obsessed with attacking the left and will attack most things that the left supports just because the left supports them. Libertarianism is threatened by the market not having an answer to AGW and hence is looking for reasons to believe it does not exist. Denialism is a club created by libertarians that has been enthusiastically adopted by many conservatives as something to beat the left with. With the libertarians the matter is what they are protecting. With conservatives it is part of the general attack on the left." -
Adam C at 01:40 AM on 20 June 2012Simply Wrong: Jan-Erik Solheim on Hansen 1988
He lost me at "150% wrong". There's no evidence of scientific literacy there at all. -
shoyemore at 01:25 AM on 20 June 2012Arctic sea ice takes a first nosedive
Neven, Great post & blog. I notice that JAXA seems to have revised downwards the big breaks they were posting for the past few days, and the Arctic Oscillation has turned positive. You have provided an excellent answer to the question I was going to ask! -
John Hartz at 01:20 AM on 20 June 20122012 SkS Weekly Digest #24
Note: This thread is now open to a discussion of the ongoing Rio+20 Conference . -
dana1981 at 01:09 AM on 20 June 2012Hansen 1988 Update - Which Scenario is Closest to Reality?
poodle - forcings are independent of climate sensitivity. The actual forcings are based on GHG concentration observations, linked in the Figure 3 caption. I suggest you read the Solheim post because the concepts you are confused about are explained more there, particularly in the last section. -
L. Hamilton at 23:35 PM on 19 June 2012Scientific literacy and polarization on climate change
"But to my eye the presence of a number of simplifications implies the possibility of oversimplification." Eric, survey questions have to be simplified, though it's a matter of degree. To my ear this question is too simple: 'Would you say the polar ice caps have gotten larger or smaller over the last 25 years?' whereas this one is just right: 'Which of the following three statements do you think is more accurate? Over the past few years, the ice on the Arctic Ocean in late summer ... Covers less area than it did 30 years ago. Declined but then recovered to about the same area it had 30 years ago. Covers more area than it did 30 years ago.' But either one correlates with respondent knowledge, politics and background characteristics in very similar ways. -
L. Hamilton at 23:23 PM on 19 June 2012Scientific literacy and polarization on climate change
"What would be really interesting would've been to divvy the group up into quartiles for example, to see if scientific literacy correlated differently with the understanding in "the middle" of the political spectrum...In fact I'm sure they could've done that though I dont' see it on glancing through the paper." I just noticed the lead-off question by Utahn; it seems worth mentioning that's exactly what Figure 1 in our paper does. -
thepoodlebites at 22:49 PM on 19 June 2012Hansen 1988 Update - Which Scenario is Closest to Reality?
What exactly are the "Actual" forcings based on in Figure 3? What climate sensitivity to CO2 doubling are you using, 3C? My point is that the satellite-based observations are clearly not following Hansen's Scenario A or B, even falling below Scenario C through May 2012. The empirical evidence suggests that model-predicted forcings are too high. (-snip-).Moderator Response: [DB] Moderation complaints snipped. -
curiousd at 21:50 PM on 19 June 2012Lessons from Past Predictions: Hansen 1981
Hello All, Thanks for all the help, everyone! I now have a glimmer of understanding. The idea of a "transient response" due to the ocean to even an apparently short term feedback (such as keeping the relative humidity constant) is crucial. And then on top of that you also have long term effects such as the ice albedo thing which will take much longer. I will next focus more on understanding the recent work where Hansen - I guess - takes the ancient record and obtains the climate sensitivity by fitting the old data. It is now conceivable to me that the fact that they got basically the same sensitivity with the 1981 model was slightly fortuitous, but probably only slightly. -
Bernard J. at 20:35 PM on 19 June 20122012 SkS Weekly Digest #24
The thing with "sustainable development" in natural systems, especially if they're living systems, is that at some point the "development" involves a greater or lesser degree of senescence. At the system level, development (which is analogous to complexity) is asymptotically constrained by energetic input into the system.
Prev 1147 1148 1149 1150 1151 1152 1153 1154 1155 1156 1157 1158 1159 1160 1161 1162 Next


