


 Arguments


Recent Comments
Prev 1161 1162 1163 1164 1165 1166 1167 1168 1169 1170 1171 1172 1173 1174 1175 1176 Next
Comments 58401 to 58450:
-
funglestrumpet at 07:11 AM on 24 May 20122012 SkS Weekly Digest #20
re Ocean Acidification See Ted Talk: 'Melissa Garren: The sea we’ve hardly seen' and the anwer to your question is 'probably not' -
jimspy at 06:42 AM on 24 May 2012If you want them to remember, tell a story
Vroomie #1: From race car mechanic to geologist?? I'll bet THAT'S a good story in itself! -
kampmannpeine at 06:38 AM on 24 May 2012If you want them to remember, tell a story
beautiful article. I just gave some 90 minute talks about climate change facts ... for a general public of our region here in Germany (Hannover) ... I had to struggle for stories around the very harsh and dry topice. Grace to God my wife - an excellent teacher - helped me a lot (though not being a scientist) and she attended the talks just for giving me feedback afterwards ... a super experiment. Thanks Tom - we need more of that kind ... -
Tom Curtis at 05:19 AM on 24 May 2012Hansen and Sato Estimate Climate Sensitivity from Earth's History
HumanityRules @6, Hansen & Sato's estimate of 3 degrees C per 4 Watt/meter squared of forcing is equivalent to 2.8 C per doubling of CO2 (1 sigma uncertainty - 2.3-3.2 C). That would be closer to splitting the difference between Schmittner et al's land and ocean estimates. -
vrooomie at 04:50 AM on 24 May 2012OA not OK part 20: SUMMARY 2/2
JMurphy@18: I owe you a thank-you: For the most part, I long ago learned to avoid WUWT, on the basis that I actually like reading *real* scientists' views (why I'm here) and getting an ever-increasing level of revulsion for what *passes* as real science at various denialist's (WUWT). I did take the time--ugh--to wadethrough that link w/Happ and am now even more delighted to be a part of this resource.Re: the Happ link and his website? Talk about a 'Dunning-Kruger bingo game!" Thanks to all here. -
CoalGeologist at 04:33 AM on 24 May 2012Dear Heartland, Stop using Arthur Robinson's Trick to Hide the Incline
Good work. I appreciate your documentation of efforts by AGW Denialists to silence the expression of skeptical viewpoints. (They commonly, and with little actual justification, accuse the mainstream science community of the same offense.) The key issue here is that the present day Sargasso Sea SSTs are significantly higher than indicated in the diagram by Robinson et al. (2007). This is fairly clear, but I'm still uncertain regarding a few minor details. The following graph is an overlay of parts of three of your figures. It's a bit of a mess, but I hope it will serve. The base graph is the 6th one (above). Your 1st diagram includes SST data from Station "S". These appear on my overlay as the squiggly line centered around 23°C, at approximately 1996. It is my understanding that this represents data from 1954 up to the time the paper was published in Keigwin (1996). These same (??) data appear as the black dots on the base diagram, beginning in 1954, extended up to the present. The green line presumably represents a linear best-fit (although this is not specified). Can you explain the apparent discrepancy between these two representations of the data?
Your 7th diagram indicates a "2006 temperature based on stated method", slightly higher than 24°C, but I didn't see where you state the method. This point differs from the "best fit" value indicated on the base diagram, although it does seem to fit the surrounding data from the base diagram.
Finally, you refer to the Heartland Institute as "a fossil-fuel-funded political pressure group". The recently leaked documents from Heartland indicating their funding sources did not appear to me to support this comment. Can you indicate what you base it on? Thanks.
Your 1st diagram includes SST data from Station "S". These appear on my overlay as the squiggly line centered around 23°C, at approximately 1996. It is my understanding that this represents data from 1954 up to the time the paper was published in Keigwin (1996). These same (??) data appear as the black dots on the base diagram, beginning in 1954, extended up to the present. The green line presumably represents a linear best-fit (although this is not specified). Can you explain the apparent discrepancy between these two representations of the data?
Your 7th diagram indicates a "2006 temperature based on stated method", slightly higher than 24°C, but I didn't see where you state the method. This point differs from the "best fit" value indicated on the base diagram, although it does seem to fit the surrounding data from the base diagram.
Finally, you refer to the Heartland Institute as "a fossil-fuel-funded political pressure group". The recently leaked documents from Heartland indicating their funding sources did not appear to me to support this comment. Can you indicate what you base it on? Thanks.
-
IanC at 04:07 AM on 24 May 2012CO2 has a short residence time
Dikran, Ah I see. I originally thought in 131 you are referring to the residence time for C14 and adjustment time for a perturbation of C14, which clearly are the same from the data. I tried explaining this from a more general model, and thought the large initial perturbation will lead to simplifications in the fluxes that will give you this result. Turns out this is unnecessarily complicated: after reading your paper again I realised that your model for the anthropogenic CO2 component can be applied to the C14 data with the addition of a source term, and all the right conclusions follow. -
dana1981 at 04:01 AM on 24 May 2012Hansen and Sato Estimate Climate Sensitivity from Earth's History
HR @6 - Hansen's temperature estimates in this case are based on deep ocean δ18O. -
Bob Lacatena at 03:44 AM on 24 May 2012New research from last week 20/2012
From Peru, From Dana's previous April 25 post here on Levitus 2012, it seems you can get the data here. -
From Peru at 03:32 AM on 24 May 2012New research from last week 20/2012
There is considerable activity in the (so called)skeptic field about this paper. For example, at WUWT: Trenberth’s missing heat still missing: new paper shows a near flat ocean temperature trend – 0.09°C over the past 55 years Clearly comparing the 1955-2010 trend with the current estimated rate of heating of earth surface (all in W/m^2) (i.e. the rate after the 1970s) is comparing apples to oranges. Where I can find the data for the paper "World ocean heat content and thermosteric sea level change (0–2000 m), 1955–2010" by Levitus et al. (2012)? With the data I can plot the ocean warming of the relevant periods (1975-2010, 1990-2003, 2003-2010, etc)to to compare it with the expectations of radiative imbalance caused by radiative forcing. -
HumanityRules at 03:13 AM on 24 May 2012Hansen and Sato Estimate Climate Sensitivity from Earth's History
"our present assessment of global LGM cooling must be partly subjective" (HS12) I don't see that much difference between Schmittner and HS12 except with regard to the quote above. Hansen likes the land paleo data more than ocean and as Schmittner shows his land based CS estimate is about inline with Hansen's.
-
citizenschallenge at 00:25 AM on 24 May 2012Dear Heartland, Stop using Arthur Robinson's Trick to Hide the Incline
Thanks for the heads up, I love writing. . . hate my misspellings and typos. Incidentally, I polished up on the whole of it this morning and made it a stand alone post. SkepticalScience.com compared to WUWT.com -
CBDunkerson at 22:02 PM on 23 May 2012Hansen and Sato Estimate Climate Sensitivity from Earth's History
This is the first study I've seen which attempts to determine a complete spectrum of sensitivity values for all forcings relative to the current climate state. The finding that a 'runaway greenhouse' scenario would require greater than 8 W/m^2 forcing (i.e. two 'doublings' of CO2e, or 1120 ppm) is 'comforting' as that seems likely to be towards the upper end of our possible range of GHG forcing. That is, the point at which we would slip into a runaway greenhouse effect seems to be well beyond the point at which the damage caused by 'constrained' greenhouse warming would be sufficiently catastrophic to end further anthropomorphic GHG accumulations. I.E. it doesn't matter how stupid we are... we can't wipe ourselves out with fossil fuels alone. Yay? Presumably the prominent 'bump' in the equilibrium climate sensitivity at ~2-4 W/m^2 forcing is the albedo shift from the melting of Greenland and Antarctica. That's also very significant as it indicates that a 4 W/m^2 forcing sustained for thousands of years, which at this point is entirely possible, would result in the melting of the polar ice caps and the geological end of the Pleistocene epoch / current ice age. That would constitute a truly 'Anthropocene' geological epoch. One item of immediate concern is the convergence of the fast feedback and equilibrium sensitivity values at ~8 W/m^2 forcing. Does that suggest that the polar ice caps could melt within a hundred years at sustained 8 W/m^2 forcing? If so, we could be looking at a radically different world map by 2200. -
Kevin C at 20:08 PM on 23 May 2012Hansen and Sato Estimate Climate Sensitivity from Earth's History
Thanks Macoles, I hadn't picked up on the significance of that point. That goes a long way to addressing my question. -
macoles at 19:45 PM on 23 May 2012Hansen and Sato Estimate Climate Sensitivity from Earth's History
Very interesting paper that shows the dependency of historical climate forcing sensitivity on the accuracy of the historical temperature reconstruction used. As Hanson and Sato say themselves: "Global temperature change calculated by multiplying the sum of the two climate forcings in Fig. 5c by climate sensitivity ¾°C per W/m2 yields a remarkably good fit to the "observed" temperature (Fig. 6). The observed temperature is based on the assumption that 4.5°C is a reasonable approximation of the LGM-Holocene surface temperature change, and thus a scale factor of 2 is used to convert δ18O deep ocean temperature change (equation 6) to surface temperature change. However, we could obtain an equally good match between the temperature calculated from the forcings and the temperature from δ18O if we assumed the LGM-Holocene warming was 6°C and fast-feedback climate sensitivity was 1°C per W/m2, or if we assumed that the LGM-Holocene warming was 3°C and climate sensitivity was 0.5°C per W/m2. If LGM cooling is so uncertain as to be anywhere in the range 3-6°C, we can only conclude that the fast-feedback climate sensitivity is 3 ± 1°C for a 4 W/m2 CO2 forcing. Thus accurate knowledge of the global temperature change between glacial and interglacial states is needed for empirical evaluation of fast-feedback climate sensitivity." So their 3±0.5°C for a 4 W/m2 CO2 at 68% probability looks like it is directly based on their estimate of LGM global cooling being 4.5±0.5°C at 68% probability. Therefore I think the really interesting part of their paper is the Fig7 Equilibrium Climate Sensitivity chart more than the narrowed sensitivity itself. -
Kevin C at 18:32 PM on 23 May 2012Hansen and Sato Estimate Climate Sensitivity from Earth's History
The recent Hansen and Sato papers are easy to read, make very simple arguments, and are very compelling. The thing I can't judge as an outsider of course is whether his selection of source data realistically reflects the range of estimates in the field, and as a result if he is realistically including all the uncertainties. Someone who is more deeply read in the paleoclimate literature might be able to comment on that. I'd be interested to see a robust critique, but I don't remember any examples of anyone taking on Hansen in the primary literature. And I'm slightly bothered by how round the numbers always are. S_ff is always 3C, and the uncertainty is always a round number. That's a stupid criticism, because it's probably just a desire not to implicitly suggest a greater precision, but it bothers me slightly. -
citizenschallenge at 17:48 PM on 23 May 2012Dear Heartland, Stop using Arthur Robinson's Trick to Hide the Incline
Yup, another great informative article. well... and yes... I couldn't pass up bootlegging a copy onto whatsupwiththatwatts.blogspot That "embed code" is the coolest. Also I started a thread over at SkepticSocietyForum that might interest some of you. ~ ~ ~ ~ ~ ~ ~ "SkepticalScience.com compared to WUWT.com" _________________________________________________ Post #1 Postby citizenschallenge » Wed May 23, 2012 1:05 am "So you have problems with my sources and I have problems with your sources" ~ ~ ~ "I know some claim SkepticalScience.com is no different from WattsUpWithThat.com. "I have been told: "it's just a different perspective, you choose to believe SkepticalScience.com and I choose to believe WUWT.” But, is it as simple as that? How do we decide on the respective veracity of each? . . . " ~ ~ ~ ~ ~ ~ ~ {and so on and so forth...} Keep up the good work :-) cheers, peterModerator Response: TC: voracity --> veracity. Let me know if I've misunderstood, for I am pretty voracious ;) -
Dikran Marsupial at 17:12 PM on 23 May 2012CO2 has a short residence time
IanC The adjustment time and residence time in my paper are both for the atmosphere. IIRC there is a preferential uptake of "light" CO2, so C14 would have a slightly longer residence time, but there is so little of it it would have no real effect on atmospheric residence and adjustment times. Martin A No, it doesn't depend on the system being non-linear. The one-box model discussed in my paper is linear, but it has different residence and adjustment times. I don't think the basic physics of ocean uptake is contraversial. Siegenthaler and Sarmiento would be a good place to start. However it would probably be a good idea to reconcile the difference between your model and mine before going on to the oceanic uptake. -
Glenn Tamblyn at 16:24 PM on 23 May 2012Hansen and Sato Estimate Climate Sensitivity from Earth's History
HS12 narrowing the error margins on their CS value to +/- 0.5 C is pretty significant compared to previous values more like +/- 1.5 C. If their methodology stands up to scrutiny this is quite useful. And it should make the cut for AR5. -
Yvan Dutil at 11:48 AM on 23 May 2012New research from last week 20/2012
Note: I did not know where to put this comment without being out of topic. I taking my chance here It would be interesting to see if the correlation between temperature anomaly and solar cycle claimed in this paper will survived the transition from HadCRU3 to HadCRU4. "Reconstructed Total Solar Irradiance as a precursor for long-term solar activity predictions: a nonlinear dynamics approach" Stefano Sello http://arxiv.org/pdf/1205.4966.pdf The nice thing with this model is it will be easily proven/or disproven within 5 years at a 3 sigma level (see figure 9).Moderator Response: TC: For your convenience: The plot is of HadCRUT3 Northern Hemisphere temperatures. Apparently, according to Sello Southern Hemisphere temperatures are not governed by solar activity /sarc. Until Dana adds Sello to his Lesson's from Past Predictions series, the best place to respond to this post is here
 -
Tom Curtis at 09:39 AM on 23 May 2012There's no empirical evidence
matzdj's questions @180 are either nonsensical or grossly misinformed. Take his first question as an example. His question assumes, falsely, that CO2 has a constant "absorption band" regardless of its concentration in the atmosphere. On the contrary, as the CO2 concentration increases, the current absorption band widens, and new absorption bands form, as can be seen by this comparison of modtran emission spectra for 375 and 999999 ppmv of CO2 in the atmosphere, and with no other greenhouse gases: 375 ppmv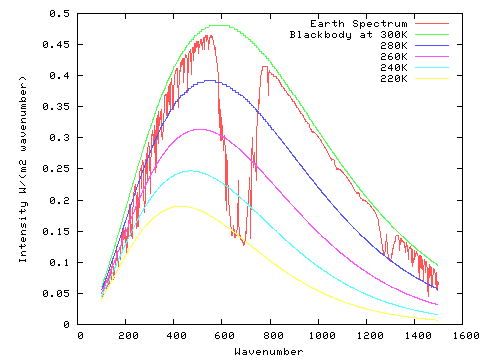 999,999 ppmv
 The Modtran model is reasonably, but not entirely accurate. In this instance it introduces a large inaccuracy by preserving atmospheric temperatures as if there was no change in CO2 content. If temperatures were allowed to adjust, the large W shape between wavenumber's 400 and 800 in the 99.99% example would be a large V or U shape instead, indicating much larger "absorption". The reason for this is that the outgoing spectra is not a product just of absorption of surface radiation, but also of radiation from the atmosphere.
For empirical comparison, here are the IR spectrums of the Earth, Mars, and Venus. Note that the absorption from Venus is from the surface radiation with a blackbody spectrum for 735 degrees K, not the 260 degrees K shown:
The Modtran model is reasonably, but not entirely accurate. In this instance it introduces a large inaccuracy by preserving atmospheric temperatures as if there was no change in CO2 content. If temperatures were allowed to adjust, the large W shape between wavenumber's 400 and 800 in the 99.99% example would be a large V or U shape instead, indicating much larger "absorption". The reason for this is that the outgoing spectra is not a product just of absorption of surface radiation, but also of radiation from the atmosphere.
For empirical comparison, here are the IR spectrums of the Earth, Mars, and Venus. Note that the absorption from Venus is from the surface radiation with a blackbody spectrum for 735 degrees K, not the 260 degrees K shown:
 In his second question, matzdj assumes the Earth is just 700 meters deep by using the OHC record for only that portion of the ocean. He would have done far better to use the OHC record for the first 2000 meters of the ocean, as below:
 Better yet, he should have used the data for the entire Earth, as in figure 4 above. So, "Isn't there information from NOAA that indicates that although Global Heat Content has risen over an extended period, it has recently done an abrupt levelling?"
Umm. No! Not unless you ignore the available evidence from NOAA that you find inconvenient.
Finally, in his third question, matzjd simply ignores the fact that the correlation between CO2 forcing and temperature was first predicted from physical principles around 200 years ago. The correlation of the Earth's temperature to large changes in CO2 forcing throughout Earth's history for at least the last 600,000 years (the period with any available data) did not come as a surprise to anyone. It was a predicted consequence of the observed fact that CO2 is transparent to visible light, and absorbs Far IR radiation, the observed fact that the Earth re-emits the energy received from the Sun, primarily as visible light and Near IR radiation in the Far IR spectrum, and that energy is conserved.
I have discussed extensively the experimental observations that make us confident of our understanding of the transmission and emission of CO2 in the atmosphere, and consequently make us certain that there is a greenhouse effect. As matzjd seems determined to ignore that evidence, here I shall simply show the correlation shown by the inexact (because of a lack of a precise temperature and humidity profile), and obsolete (1987 vintage) modtran model and observations:
Better yet, he should have used the data for the entire Earth, as in figure 4 above. So, "Isn't there information from NOAA that indicates that although Global Heat Content has risen over an extended period, it has recently done an abrupt levelling?"
Umm. No! Not unless you ignore the available evidence from NOAA that you find inconvenient.
Finally, in his third question, matzjd simply ignores the fact that the correlation between CO2 forcing and temperature was first predicted from physical principles around 200 years ago. The correlation of the Earth's temperature to large changes in CO2 forcing throughout Earth's history for at least the last 600,000 years (the period with any available data) did not come as a surprise to anyone. It was a predicted consequence of the observed fact that CO2 is transparent to visible light, and absorbs Far IR radiation, the observed fact that the Earth re-emits the energy received from the Sun, primarily as visible light and Near IR radiation in the Far IR spectrum, and that energy is conserved.
I have discussed extensively the experimental observations that make us confident of our understanding of the transmission and emission of CO2 in the atmosphere, and consequently make us certain that there is a greenhouse effect. As matzjd seems determined to ignore that evidence, here I shall simply show the correlation shown by the inexact (because of a lack of a precise temperature and humidity profile), and obsolete (1987 vintage) modtran model and observations:

-
pbjamm at 09:35 AM on 23 May 20122012 SkS Weekly Digest #20
I am not sure this is right place for this but it certainly belongs on SkS.
-
skywatcher at 09:26 AM on 23 May 2012There's no empirical evidence
matzdj, why do you post the same graph as you posted on the 17th May on another thread? Did you read the responses you were given (several detailed responses including at least nine links to follow from myself and DB)? Did you do any analysis to determine whether there has actually been a significant change in trend? Or are you just here to repeat tired old debunked talking points and not listen to the responses you were given? The graph you provide is not [ocean] heat content from NOAA - I provided you with the link to NOAA ocean heat content (the same as Rob's above) on 17th May. Until you do the analysis to determine whether there has been a change in trend, your comment is empty of substance in any case. -
Steve L at 09:25 AM on 23 May 2012If you want them to remember, tell a story
Folks might be interested in looking up Randy Olson ("Storyomics: proof that scientists evolved from humans" and "Don't be such a scientist: talking substance in an age of style"). -
Rob Honeycutt at 08:59 AM on 23 May 2012There's no empirical evidence
matdj... Here is the page I find for NOAA's Global Ocean Heat Content... LINK Note specifically the second panel in the series. 0-2000m. I don't think you're going to see any "leveling off." -
Rob Honeycutt at 08:08 AM on 23 May 2012There's no empirical evidence
matzdj... You're not presenting a chart of "Global Heat Content" as far as I can see. You're presenting a chart of surface temperature. Don't forget that most of the heat energy is retained in our planet's oceans. -
matzdj at 07:15 AM on 23 May 2012There's no empirical evidence
According to this thread, " What the science says... Direct observations find that CO2 is rising sharply due to human activity. Satellite and surface measurements find less energy is escaping to space at CO2 absorption wavelengths. Ocean and surface temperature measurements find the planet continues to accumulate heat. This gives a line of empirical evidence that human CO2 emissions are causing global warming." I have several quesitons: 1. What percentage of the energy in the absorption bands of CO2 are being absorbed today? 2. Isn't there information from NOAA that indicates that although Global Heat Content has risen over an extended period, it has recently done an abrupt levelling? 3. Isn't the information in the argument a collection of items that indicate a correlation, but not a causal relationship? What are the experiments that have been run to prove or disprove the causal relationshio?
Dave
Moderator Response:
3. Isn't the information in the argument a collection of items that indicate a correlation, but not a causal relationship? What are the experiments that have been run to prove or disprove the causal relationshio?
Dave
Moderator Response:[DB] Please document the paternity of your graphic (the data sources used and any changes made).
[Albatross] Please also familiarize yourself with the comments policy. Your questions have been addressed elsewhere at SkS, so your above comment constitutes "sloganeering" which is in breach of the comments policy.
As for the causal relationship between CO2 and global temperature, statistical tests have determined that changes in CO2 Granger cause changes in temperature (e.g., see here).
-
fydijkstra at 06:56 AM on 23 May 2012HadCRUT4: A detailed look
( -Repetitive accusations of dishonesty, malfeasance and conspiracy snipped- )Moderator Response:[DB] Please note that posting comments here at SkS is a privilege, not a right.
This privilege can and will be rescinded if the posting individual continues to treat adherence to the Comments Policy as optional, rather than the mandatory condition of participating in this online forum.
Moderating this site is a tiresome chore, particularly when commentators repeatedly submit offensive or intentionally misleading comments. We really appreciate people's cooperation in abiding by the Comments Policy, which is largely responsible for the quality of this site.
Finally, please understand that moderation policies are not open for discussion. If you find yourself incapable of abiding by these common set of rules that everyone else observes, then a change of venues is in the offing.
Please take the time to review the policy and ensure future comments are in full compliance with it. Thanks for your understanding and compliance in this matter, as no further warnings shall be given.
-
vrooomie at 06:26 AM on 23 May 2012David Evans: All at Sea about Ocean Warming and Sea Level Rise
Wait!! Hids wife is Jo Nova? OK....I'm now fully informed, viz. Dr. Evans...;) -
vrooomie at 06:23 AM on 23 May 2012David Evans: All at Sea about Ocean Warming and Sea Level Rise
Spaerica@27 sez... "From DeSmog Blog: Ph.D. Electrical Engineering, Stanford University, Stanford, California. M.S. Electrical Engineering, Stanford University. M.S. Statistics, Stanford University. M.A. Applied Mathematics, University Of Sydney. B.E. Electrical Engineering, University Of Sydney, Sydney Australia, University Medal (1983). B.Sc. Applied Mathematics and Physics, University Of Sydney." PERFECT!! Makes "Dr." Evans a *perfect* expert in climatology, and equally as clearly why the denialists embrace him. Now, why wasn't I smart enough to figger that out? /snark off -
vrooomie at 04:24 AM on 23 May 2012If you want them to remember, tell a story
My avocation (folk singer/guitarist) has *always* informed my vocations (race car mechanic, now geologist) in ways that I could not instruct anyone on how, but intuitively knew it was the correct way to 'get across' to an 'audience,' whether they be there to hear tales in song, or to hear tales in geological terms. In terms of speaking with people wrt climate change, I *always* attempt to 'story-fy' it, to put it (the science) in relatable terms for those who aren't scientists. It doesn't always work but I've found it works more often than not! -
Martin A at 04:16 AM on 23 May 2012CO2 has a short residence time
The non-equivalence of residence and adjustment time evidently depend the system being nonlinear. Is there a reference where a non-chemist can read up on the chemistry of equilibrium between CO2 in seawater and air, to the level of calculating diffusion rates? It seems to be a topic that is: - not simple - somewhat controversial. I'd like to do calculations of my own to understand the nonlinearity. -
John Chapman at 01:04 AM on 23 May 2012David Evans: All at Sea about Ocean Warming and Sea Level Rise
With degrees in applied maths, physics and statistics one wonders why Dr Evans' treatment of data has been so shoddy. Maybe the knowledge allows one to apply the maths to suit your objective which is partly to support wife Jo Nova's unscientific messages? -
John Hartz at 23:54 PM on 22 May 2012Latest Southern Ocean research shows continuing deep ocean change
Kevin and jyyh: The following statment suggests that the research findings summarized in the OP will be peer-reviewed and published in a scientific journal in the near future. "The new measurements, which have not yet been published, suggest the densest waters in the world ocean are gradually disappearing and being replaced by less dense waters." The forthcoming paper will undoubtedly address in detail the questions/issues that you have posed. -
Michael Whittemore at 23:50 PM on 22 May 2012Who Are the Most Prominent Advocates of Global Warming?
My bad Tom, if a Mod could fix it, that would be great :) -
Tom Curtis at 23:39 PM on 22 May 2012Who Are the Most Prominent Advocates of Global Warming?
LOL Apparently I am so prominent that you can't even get my name right ;) -
jyyh at 23:37 PM on 22 May 2012Latest Southern Ocean research shows continuing deep ocean change
I think the ABW will still be the densest water about so when it's amount diminishes it's rather an indication of GW itself. Effects on circulation might be f.e. fewer cool periods in southern tropics and subtropics. Totally another matter is whether the increase in Antarctic glacial meltwater will mess up the circulation higher up in the southern ocean. This might increase the variation in weather on the southern parts of South America, likely New Zealand but nothing much more. But I'm just speculating here, if someone can say better please tell. -
Michael Whittemore at 23:36 PM on 22 May 2012Who Are the Most Prominent Advocates of Global Warming?
Who Are the Most Prominent Advocates of Global Warming???? John Cook Dana Nuccitelli Rob Painting Doug Mackie Ari Jokimaki Andy Skuce Daniel Bailey James Wight Robert Way Glenn Tamblyn Riccardo Anne-Marie Blackburn Steve Brown Michael Sweet Barbel Winkler Neal J. King Hoskuldur Bui Jonsson and lets not forget, Tom Curtis Skeptical Science is the back bone of the Climate Change movement. Science today cant reach the community like skeptical science does. It is only early days for this website, but I see a noble prize on the table if everyone including all the great commenters, keep up this fantastic work.Moderator Response: [DB] Fixed text per request. -
Kevin C at 15:54 PM on 22 May 2012Latest Southern Ocean research shows continuing deep ocean change
Wikipedia on Antarctic Bottom Water. I suspect I'm not the only one who is a bit in the dark as to the implications. Is the rest of the ABW likely to go? If it does, will the thermohaline circulation shut down, or just change? Are there any clues as to what the resulting climate change would look like? (I presume that there are no answers to these questions of course.) -
IanC at 15:31 PM on 22 May 2012CO2 has a short residence time
Dikran, Sorry what I meant was, the residence time as the time it takes to reduce X to 0 in the absence of a source , which is just X divided by the flux of X out of the box. I believe this is the standard definition of the residence time. To clarify, in 131 are you referring to the residence time and adjustment time of CO2 or C14? I might have misunderstood you. -
Dave123 at 15:29 PM on 22 May 2012Who Are the Most Prominent Advocates of Global Warming?
@25 DalyPlanet- You strike me as playing the role of 'concern troll'. Try checking google scholar for Jim Hansen's scientific publication record....and then consider this question: There is a strain of global warming deniers who promote the following substitution judgemement: "If Global Warming were real and really a problem, scientists would be out demonstrating in the streets about it". How sure are you that demonstrating **really** reduces someones scientific stature...as opposed to simply providing fodder for the never-ending rhetorical games that the fake skeptics engage in having no facts or reasoning to support their case? Everyone else: Here's a counter billboard for Heartland- "Heartland created a phony billboard about who prominent advocates for the consensus global warming view are. We'd like to show you who the prominent deniers of global warming are- The rest of the billboard is blank, except for a footnote- "Drawing a blank? So did we... the denial of global warming is lead from a faceless backroom." And then let Inhofe, or Limbaugh, or Christy, Spencer etc complain. -
skywatcher at 15:18 PM on 22 May 2012Who Are the Most Prominent Advocates of Global Warming?
dalyplanet - The Hiroshima bomb is a perfectly commonly-used unit of energy that people can relate to. It has been used for many years in innumerable cotexts. Crying foul over it strikes me as an attempt to distract from the point, rather than accept the very large amount of energy being added to the Earth system daily. Such units come in all shapes and sizes. Brits often use units of "Wales" or "London Bus". Other units of measurement, including the Hiroshima Bomb, can be seen in this fun list of 10 unusual measurement units. Hiroshima has been used regularly by geologists and astronomers for indicating the energy involved in asteroid strikes and volcanic eruptions, so it's hardly odd to use it here. Wikipedia uses it for the Tunguska event a recent large meteoroid impact/explosion. -
dalyplanet at 14:35 PM on 22 May 2012Who Are the Most Prominent Advocates of Global Warming?
Hansen would be better served using Joules or at the least atomic bomb units as opposed to Hiroshima units. Thatcher as a "prominent advocate" has some concerns and needs to be ascribed the status of politician for accuracy.Moderator Response: TC: This comment consists of a simple reassertion of points you raised in a previous post, which has been well rebutted. As such, it constitutes simple repetition, and is in violation of the comments policy. Future violations may be simply deleted without comment. -
Tony O at 11:01 AM on 22 May 2012Latest Southern Ocean research shows continuing deep ocean change
Link is to UCLA press releases and does not relate to postModerator Response: [JH] Link fixed. Thanks for bringing this glitch to our attention. -
Bob Loblaw at 09:37 AM on 22 May 2012David Evans: All at Sea about Ocean Warming and Sea Level Rise
Hmmm. I have a brother with four degrees: a BA in musicology, two masters in musicology, and a PhD in musicology. As part of his PhD, he took some courses overseas and automagically got a second masters, even though he didn't really need it to complete his PhD. In a case like Evans', it is possible that he did a double-major at Sydney (thus the two B.xx), then a Masters, and then went on to Standford for a PhD, where he also got credit for courses that allowed him to get two M.S.s in the process. It's to his credit that he could cover all those requirements, but it wouldn't necessarily take 4+4+2+2+2+3 years... Just guessing about the details, though. ...and my guess is that my brother probably learned 2/3 as much about climatology in his four degrees as Evan seems to have learned in his six...! I only have two degrees: a B.Sc. and a Ph.D. I moved on to the Ph.D. program without needing to complete the M.Sc. program I'd started in. My Ph.D. had a specialization in physical climatology, though, so I think I'm ahead of both Evans and my brother. And quite a few people I've known for a while end up surprised when they find out I'm a "Doctor", as it's not the first thing I tell people. Don't get me started about Tim Ball, when it comes to bragging about credentials! -
JMurphy at 08:44 AM on 22 May 2012Who Are the Most Prominent Advocates of Global Warming?
The situation with regard to Thatcher and her apparent politically-motivated change of view later on in life, reminds me of the case of Roger Revelle and how he was shamefully used by the likes of S Fred Singer. -
dana1981 at 08:34 AM on 22 May 2012David Evans: All at Sea about Ocean Warming and Sea Level Rise
Hah Andy, nice one! -
Andy Skuce at 05:08 AM on 22 May 2012David Evans: All at Sea about Ocean Warming and Sea Level Rise
Dikran @ 26 "it certainly wouldn't go down well with an English audience" Not so fast. Mark Lynas is English and nobody accused him of boastfulness for titling his best-seller Six Degrees... -
Andy Skuce at 04:59 AM on 22 May 2012Who Are the Most Prominent Advocates of Global Warming?
It seems, based on davidpalermo's links, that the earlier views espoused by Thatcher were rooted in science, whereas her later change of mind, in her 2003 book Statecraft, was driven by politics. Sadly, Mrs Thatcher has suffered a severe decline in her health, including dementia, since the year 2000, so it would be impossible now to challenge her on her reversal of opinion. I actually don't see much problem using her earlier speeches. They demonstrate that a scientifically informed political leader with an indisputable conservative world-view can say sensible things about the climate crisis.Even if she later changed her mind, her earlier views prove that concern about climate change is not linked to left-wing politics. The Heartland Institute would have us believe that anyone alarmed about climate change is mad or bad. Peter Sinclair's excellent video demonstrates that such a view is totally and utterly false. -
Bob Lacatena at 04:14 AM on 22 May 2012David Evans: All at Sea about Ocean Warming and Sea Level Rise
I think that part of what's funny is that 3 of those degrees are in the same thing... EE. Most people would just say they have the PhD, not take credit for having a BA, an MS, and a PhD all in the same thing. How often have you heard someone say "Trust me, I'm a doctor with three degrees."
Prev 1161 1162 1163 1164 1165 1166 1167 1168 1169 1170 1171 1172 1173 1174 1175 1176 Next


