


 Arguments


Recent Comments
Prev 1195 1196 1197 1198 1199 1200 1201 1202 1203 1204 1205 1206 1207 1208 1209 1210 Next
Comments 60101 to 60150:
-
Kevin C at 19:28 PM on 18 April 2012GISTEMP: Cool or Uncool?
On the previous post, Skywatcher pointed out quite rightly that the rectangular projection I have used in the maps can create a misleading impression, because the area is exaggerated as you move away from the equator. This inflates the apparent impact of poor coverage at high latitudes. All the conclusions of this post are based on the global temperature averages, not on the illustrations, which are provided as an attempt to explain what is going on. However there is certainly one point which needs to be demonstrated more clearly, I'll try and clarify. In determining the impact of poor coverage at a given latitude, there are three factor at play: The fraction of the Earth's surface covered by that latitude band, the amount by which temperature anomalies in that latitude band differ from the global mean, and how much of that latitude band is missing. In the case of the Arctic, these pull in different directions. The Arctic covers a relatively smaller area than a corresponding latitude range at the equator, but the temperature anomalies are changing much more quickly and the coverage deficit is much more significant. How do these effects play out? That is shown in the following figure: To generate this figure, I took the GISTEMP gridded maps and reduced the coverage to match HadCRUT3 over a 30 degree latitude band, leaving the rest of the map untouched. I then calculated a temperature series from the gridded map series. I repeated this 6 times to produce 6 temperature series. I then took the difference with the original full-coverage data. The results are shown above.
Each line represents the bias added to the total temperature series by the loss of coverage in that latitude zone alone. As you can see, the Arctic is the biggest contributor to the recent cool bias of HadCRUT3, followed by the northern mid latitudes. The Antarctic actually provides a warm bias, but one which has been declining since 1998, thus actually adding to the cooling bias since that date. In fact every zone except the southern tropics has been contributing to the cooling trend in HadCRUT3 over the last 13 years.
In summary: When calculating area averaged global temperature anomalies, the GISTEMP data suggests that the Arctic, despite it's comparatively small area, is the largest single contributor to the cool bias due to poor coverage in HadCRUT3. The NCDC data suffers from the same problem at high latitudes, although its mid-latitude coverage is better.
The implications for HadCRUT4 are interesting.
To generate this figure, I took the GISTEMP gridded maps and reduced the coverage to match HadCRUT3 over a 30 degree latitude band, leaving the rest of the map untouched. I then calculated a temperature series from the gridded map series. I repeated this 6 times to produce 6 temperature series. I then took the difference with the original full-coverage data. The results are shown above.
Each line represents the bias added to the total temperature series by the loss of coverage in that latitude zone alone. As you can see, the Arctic is the biggest contributor to the recent cool bias of HadCRUT3, followed by the northern mid latitudes. The Antarctic actually provides a warm bias, but one which has been declining since 1998, thus actually adding to the cooling bias since that date. In fact every zone except the southern tropics has been contributing to the cooling trend in HadCRUT3 over the last 13 years.
In summary: When calculating area averaged global temperature anomalies, the GISTEMP data suggests that the Arctic, despite it's comparatively small area, is the largest single contributor to the cool bias due to poor coverage in HadCRUT3. The NCDC data suffers from the same problem at high latitudes, although its mid-latitude coverage is better.
The implications for HadCRUT4 are interesting.
-
skywatcher at 17:37 PM on 18 April 2012New research from last week 15/2012
#3 - wow. Clearly a result that needs corroboration / verification, but if that turns out to be right it is remarkable. Yet another blow to the fabled, mythical, "natural variations" that some skeptics tout to explain global warming. -
From Peru at 15:06 PM on 18 April 2012New research from last week 15/2012
Nature bombshell: The Atlantic Multidecadal Oscillation (AMO) was driven by man-made aerosol pollution according to improved climate models: This is an introduction in Nature News and Views: Climate science: Aerosols and Atlantic aberrations And this is the paper: Aerosols implicated as a prime driver of twentieth-century North Atlantic climate variability If this is confirmed by more research, then man-made climate change(in this case more in the form of "global dimming" than "global warming") is after all behind extremes in events like Atlantic hurricanes and the Sahel monsoon anomalies, phenomena that have been linked with the AMO. -
scaddenp at 14:31 PM on 18 April 2012Models are unreliable
Relevant to this discussion on skill/validation of models is Hargreaves 2010 -
skywatcher at 14:23 PM on 18 April 2012Data Contradicts Connection Between Earth's Tilt and the Seasons
Manny #20, my wording in #18 may have led to some confusion - I'm not implying that modellers made no mistake. I am implying that they have constructed a physical representation of Earth that is consistent with observational data. It is not arbitrarily constructed either, but constructed from our fundamental understanding of heat flows, radiation and the properties of solids, liquids and gases. It could be fundamentally flawed, but as it is based on physics and not on an arbitrary regression (as in the satirical example above), it has an awfully good chance of being closer to the truth than arbitrarily drawing a line through a few years of temperature data. As such, it has a very good chance of showing us what to expect over the next century, given assumptions of certain key parameters, like CO2 emissions and long-term solar activity. I've responded here as my comment relates to misinterpreting of my #18, but further discussion of models should continue on the thread as directed by scaddenp above. -
William Haas at 13:44 PM on 18 April 2012Shakun et al. Clarify the CO2-Temperature Lag
Let me take a little break here. I again want to thank you for all of the effort that has been put into this. There seems to be more than one person responding to my posts so that there are all that many more posts that I have to respond to. I guess my post 113 did not go all that badly. I do agree with quite a bit that has been said. Some of you seem to be jumping the gun on what conclusions I am going to come up with. I am not trying to espose anything that is revolutionary or sinister. I am just trying to find the truth as I am sure that your are too. I plan to continue to respond to posts in order. Some of them take additional effort on my part to consider and I am sure that, like you, I have a lot more going on in my life then just responding to posts on this site. -
scaddenp at 12:39 PM on 18 April 2012Data Contradicts Connection Between Earth's Tilt and the Seasons
I would also say that this is heading off-topic fast, so I have responded hereModerator Response: [DB] Fixed link -
scaddenp at 12:38 PM on 18 April 2012Models are unreliable
Continuing from a comment posted by Manny: Sorry, what is extraordinary about the claims of climate theory? They are fully consistent with everything else we know about physics. The time period for model validation is not some arbitrary no. (eg why stop at 100,000?) but more determined by internal variability which is calculable. However, the basic theory of surface temperature, if correct, must work throughout all times and on all planets. There are two problems going back long periods in time: 1/ computer power - full resolution, 100 year runs take a lot of muscle and time. Its more normal to look at specific parts of past time (eg LGM, ememian peak, YD, PETM etc). You dont gain a lot with very long runs. 2/ Uncertainty as to the inputs increase. ie what was past albedo, atmosphere composition, TSI etc. There are uncertainties in proxy records for those as well as uncertainties in the proxy temperature. You can say that paleoclimate temperature proxies are consistent with climate theory and proxies for climate forcings. Ditto for temperature regimes on other planets. However, paleoclimate isnt the only way to validate model - they after all push out predictions on huge no. of variables on various time scales. See Chpter 8 of that IPCC report. However, the modellers would also I am sure caution you that it is better to consider model skill rather than simple model validation. In considering the implication of the modelling for future planning, this is what matters. -
Manny at 11:35 AM on 18 April 2012Data Contradicts Connection Between Earth's Tilt and the Seasons
Scaddenp, I looked carefully at all the figures (I am visual) of the WG1 Paleoclimate document. That's what I was looking for, thanks. And indeed, the models are validated over 1,000 years, not 100. To go back to the main topic here -- that validation of a model on too little data is misleading -- I cannot help wonder why, since the 1,000 yr temperature data is mainly proxy, did the IPCC modelers not extend their validation with more ancient proxy data? There are Greenland ice cores going back 100,000 years and Antarctic going back 400,000 years. All they have to do is run their computer longer. Extraordinary claims require extraordinary evidence. -
danielc at 11:22 AM on 18 April 2012Shakun et al. Clarify the CO2-Temperature Lag
LOL... grrr... I went backwards: absorb 334kJ/kg on melting, release 334 kJ/kg on freezing - any chance of correcting that last post? 3x10^15 kJ absorbed per year just to melt the ice we are losing - does that heat absorbtion have a significant masking effect on what we measure with thermometers? -
skywatcher at 11:19 AM on 18 April 2012First Look at HadCRUT4
Excellent post, and an interesting prediction in the concluding line. I wonder if it is what we will see (a switch to using NCDC), or will the skeptics continue stubbornly using HadCRUT3 as the levels of denial bite harder and harder? One minor gripe I have is the representation of the globe as a rectangualr grid in visualisations, such as Fig 1. It's not a big gripe, as GISS have been doing it for years, and I know from personal experience that it's an awful lot easier to plot data in this way! But it does over-highlight, from a purely visual perspective (and for no other reason), the red areas at the top and bottom of the world. In the Hadley datasets also over-highlights the surface area covered by missing data. It should of course be noted, before anyone suffests otherwise, that this is accounted for in calculations of global anomalies! -
danielc at 11:12 AM on 18 April 2012Shakun et al. Clarify the CO2-Temperature Lag
How much of an effect does the latent heat of melting ice have? Take the present day, for example: if we are losing ~100 km^3 per year of ice (Howatt et al., 2008, PDF), that works out to 9x10^12 kg of ice melted, which would XXXXXXX absorb 334 kJ/kg, or 3x10^15 kJ per year (focused on areas where melting is most prominent). That seems like a lot to me...Moderator Response: TC: post edited at authors request. 1:34pm 18/4 -
skywatcher at 10:55 AM on 18 April 2012Shakun et al. Clarify the CO2-Temperature Lag
#116 - William, you really, really need to re-read Michael Whittmore's post at #109, and mine at #108. You might note I said at #108 that we live on a wet planet, and that WV was the largest component of the GH effect, we agree on that, and a surprising amount of correct (if obvious statements in your post). Your conclusions are still miles wide of the mark though. The first crucial phrase is this, used by you: "The average amount of water vapor depends on temperature." The second crucial point is that the average amount of water vapour in the atmosphere responds very quickly to temperature change, through evaporation and precipitation, also elucidated by you. Therefore something else must force the temperature in order to keep the water vapour in the air. Water vapour alone does not do it as, alone, eventually it finds a place to freeze and increase albedo (Lacis et al 2010). Orbital forcing can change temperatures locally, thus changing water vapour locally, much as excellently described by Michael Whittmore in #109. But this is still not enough forcing to get us out of an ice age. CO2 can change WV levels globally as it is non-precipitable and well-mixed. Michael Whittmore's excellent #109 (as well as the OP of course) describes succinctly the pattern of events leading to global warming at the end of the ice age. Perhaps you would care to explain where he is wrong, and how a variable that is locally effective on timescales of a week or two can be globally effective for century-scale warming (deglaciation or current)? -
Tom Curtis at 10:49 AM on 18 April 2012Shakun et al. Clarify the CO2-Temperature Lag
William Haas's comment at 113 is correct in every detail. It is also correct that thetotal increase in contribution to the Green House Effect from water vapour between the Last Glacial Maximum and the Holocene is greater than the equivalent increase for CO2, or indeed for all well mixed Green House Gases. It is important that we recognize where William is right, even though we think he takes those correct premises and goes of to a completely wrong conclusion. To be clear, what Haas has stated at 113 is that Water Vapour was a significant short term feedback on the milankovitch cycle effects at the initiation glacial to interglacial transition, and that that feedback strengthened the response. Indeed, the WV feedback strengthened the original response by a factor between 2 and 4. Unfortunately, Haas has been arguing that "...starting with an ice aged earth, H2O would dominate any green house gas triggering effects." However, as he states in 113:"Water vapor amounts in the atmosphere vary from day to day and water leaves the atmosphere through condensation but it is quickly replaced through vaporization or sublimation. Water takes up additional heat when it melts, vaporizes, or sublimes, but then it releases that heat when it condenses or freezes."
What he needs to recognize is that the same thing applies on the other side of the equation as well. If the WV content of the atmosphere exceeds the equilibrium level for temperature, it quickly precipitates out, so for time scales of a year or more it can be always assumed to be in equilibrium for the temperature and conditions. Consequently, the initial and significant response of the WV feedback could not have led to ongoing warming by itself. Its full effect, if no other factors were brought into play, would have been worked out within a century or so at most. Consequently, without the intervention of other factors, the WV feedback alone could not have lead to continuing warming centuries after the initial trigger. IMO, Haas needs to clearly state whether he agrees with, or disagrees with the last (and bolded) sentence. If he agrees, we have then just simply misunderstood what he has been trying to say. If he disagrees, he needs to clearly state why a factor which equilibriates over mere days can still be driving ongoing warming thousands of years later. Certainly nothing he has said in 113 suggests that it would. Of course, from the basis of the consensus on climate science, there is no issue here. WV is a strong short term feedback, but the long term increase in temperature from LGM to Holocene was driven by the far more stable factors of ice sheet melt and increased CO2 and CH4 concentrations. Because CO2 and ice sheets take thousands of years to equilibriate with temperature, there is no issue as to why they are able to drive warming over the long term. And because they are the long term drivers, they explain the transition in a way that WV cannot, even though WV contributed more to the change in the total GHE. -
danielc at 10:42 AM on 18 April 2012Shakun et al. Clarify the CO2-Temperature Lag
If water vapor could magically increase as a volume percentage of the atmosphere, and stay at those elevated levels over centuries... then it could be a forcing factor. As it stands, it is not a forcing factor... it is an amplifier, because it cannot and does not go into the atmosphere and stay there on its own. It must have "something" that acts to heat the atmosphere and keep it heated. The only thing that can do that is the interaction between increased insolation (the initial trigger) and subsequent enhancement and maintenance of increased CO2 levels. CO2 mixes and stays mixed for centuries. CO2 concentrations can be reduced via silicate weathering and photosynthesis + rapid burial of dead organic matter... but that process is much, much slower than the introduction and mixing of CO2 due to increased temperatures. Increased levels of H2O cannot cause global warming because they require the warming to exist beforehand. Once warming has started, the warmer atmosphere can then hold more H2O(v), and more H2O(v) is available due to enhanced evaporation, then it can begin to amplify already existing warming trends. Hence, H2O(v) is a feedback, not a driving force. -
skywatcher at 10:26 AM on 18 April 2012Return to the Himalayas
Steve Case avoided the crucial point, mentioned by KR in #36 and myself in #30. The problem is not about whether snow melts/sublimates quicker or slower than ice, the problem is the reliability of the runoff through the year. Some years will have lots of snow, and thus there will be snowmelt runoff throughout the year, whoopee... but other years will have relatively little snow, or the snow will be spread thinly, or for whatever reason will melt early in the dry season. What happens then? How many years will it take for the late-season lack of runoff to make a real mess of local agriculture? In places like the Himalayas, and elsewhere, the reliability of runoff is the absolutely crucial factor to agriculture, and that is where having a mass of glacier ice that will survive every summer, providing runoff through the year every year, is more valuable than relying on the vagiaries of annual snowfalls. Some years all the snow will melt and some of the stored glacier ice will melt too, other years not even all the snow will melt (so the glacier gains mass), but every single year there is runoff through the whole year. -
Eric (skeptic) at 09:50 AM on 18 April 2012Shakun et al. Clarify the CO2-Temperature Lag
It is a sensible idea that water vapor increases can cause global warming. Water vapor increases from initial warming cannot possibly trigger runaway warming because water vapor is lighter than air. It rises, easily saturates, and condenses. There is no requirement that CO2 rise, although it rose later as an amplifier. Another thing to remember is that water vapor is very uneven during glacial periods with very dry continental interiors except for mountain ranges and glacier sources. See http://webster.eas.gatech.edu/Papers/Webster1978b.pdf for example. When the water vapor starts to even out due to Milankovitch forcing, then there is net global warming. -
Philippe Chantreau at 09:48 AM on 18 April 2012Return to the Himalayas
Steve Case, your "crude" experiment is too crude to yield any useful result; whatever you observed while doing it can not be applied to this discussion. I don't know that it can be applied to anything. The snow and ice blocks are of different sizes and obviously different densities. What are the beginning and ending water masses for each? What are the surface to volume ratios for each? What results do you get if you start with identical masses (i.e. kg of water in snow form and 1 kg of water in ice form)? The angles of the pictures and the distance to the subjects are different for the before-melt and after-melt, and the blocks also appear to have been moved, as the background is not the same. -
Philippe Chantreau at 09:39 AM on 18 April 2012Shakun et al. Clarify the CO2-Temperature Lag
William, I superficially read your posts so far. Can you clarify for me the following: are you making the argument that water vapor acts as a forcing when it is somehow injected in the atmosphere (whatever the mechanism)? -
Daniel Bailey at 09:16 AM on 18 April 2012Shakun et al. Clarify the CO2-Temperature Lag
William, multiple people have engaged you multiple times in an attempt to correct your errors. You display no indication that you have read and understood their efforts. You are simply, fundamentally, wrong on the ability of water vapor to be a temperature forcing of climate in any capacity. Until you grasp the difference between the forcings and the feedbacks, you will not be able to overcome your block in this matter. -
William Haas at 08:59 AM on 18 April 2012Shakun et al. Clarify the CO2-Temperature Lag
82 skywatcher We are talking about the first 2,500 years after the LGM. The article states that during that time 7% of the warm up that ended the ice age occoured but that atmospheric levels of CO2 did not increase. During that time water surfaces dominated the earth much as they do today and as they have for billions of years. During the ice age, ice sheets developed where there are none today but they did not cover the entire earth. Ice is also a water surface. Water molecules can pass directly from an ice surface into the atmosphere through sublimation. So plenty of water was available 19,000 years ago to pass into the atmosphere just as there is plenty of water available today. We are talking about climate. So the day to day levels do not matter, it is the average amount of water vapor in the atmosphere that matters. As average temperatures increase so will the average amount of water vapor. Water vapor is a green house gas and in fact it is the domanant green house gas. Just how dominiate water vapor is, is a matter debate, but from my reading, all who believe in the green house gas theory agree that water vapor is the green house gas that accounts for the most warming. The primary reason for this is that during at least modern times there is usually 100 times more water vapor in the atmosphere than there is CO2. The average amount of water vapor depends on temperature. If the average temperature increases so does the average amount of water vapor in the atmosphere. This idea is used in modern models of how CO2 contributes to global warming. Increased levels of CO2 traps more heat which raises temperatures. The rises in temperatures causes more water vapor to enter the atmosphere because higher temperatures increase the atmosphere's ability to hold more water vapor. The additional water vapor causes the atmosphere to trap even more heat. Because of this, water vapor is considered to be a positive feedback to the effect of adding more CO2 to the atmosphere. As such H2O amplifies the effect of increased levels of CO2 on global warming. I would think that most people on this site would understand that and for that matter even defend it. During the first 2,500 years since the LGM, CO2 levels did not rise but temperatures did rise. This is all according to the article. I am not desputing it nor am I making this up. The feeling is that Milankovitch forcing was the cause. To raise CO2 levels it takes more than just surface heating of the oceans to have any significant effect. Apparently it took 2,500 years for the Milankovitch forcing to heat a large enough volume of ocean water to effect global CO2 levels. But to increase average H2O levels in the atmosphere all that is needed is for the temperature of the atmosphere to increase. The article says that temperatures did increase during this period of time so that H2O levels must have increased and the increased levels of H2O must have added to the warming. If this is not the case then current models that predict that increased CO2 levels are warming the globe and that incorporate H2O related feedback and or amplification, must be all wrong. Water vapor amounts in the atmosphere vary from day to day and water leaves the atmosphere through condensation but it is quickly replaced through vaporization or sublimation. Water takes up additional heat when it melts, vaporizes, or sublimes, but then it releases that heat when it condenses or freezes. During the time I am talking about there was CO2 in the atmosphere but because it did not increase, its increase could not have contributed to global warming. -
shoyemore at 07:53 AM on 18 April 2012Global Warming in a Nutshell
davpat, KR answered your questions in #27, and Tom Curtis answered them again in #36. Tom also has a great post at this site on the greenhouse effect. I think you should take the discussion further at that post, if you are still confused. I found this review article an excellent introduction to the greenhouse effect. http://geosci.uchicago.edu/~rtp1/papers/PhysTodayRT2011.pdf -
Kevin C at 07:50 AM on 18 April 2012First Look at HadCRUT4
OK, I think I've got it. Here are the stations in that cell: 526520 389-1005 1483 ZHANG YE 19511988 101951 526570 382-1003 2789 QILIAN CHINA 19562007 301956 526810 387-1030 1367 MINQIN CHINA 19392010 101939 527540 373-1001 3302 GANGCA CHINA 19572007 301957 527650 374-1016 2682 HAO-MEN CHINA 19562007 301956 528560 363-1006 2743 GONGHE CHINA 19532007 301953 528660 366-1018 2262 XINING CHINA 19362011 301936 528680 360-1014 2072 HEY-IN CHINA 19562007 301956 528760 363-1029 1905 MINHE CHINA 19562007 301956 528890 361-1039 1517 LANZHOU CHINA 19322007 101932 529570 353-1007 3290 TONGDE CHINA 19542007 301954 But: Only one has data for the 2006-2010 period: XINING Only one has data for the 1996-2000 period: LANZHOU So we've got a break in continuity for cell reporting. The homogenisation algorithm would normally take care of this, but it is failing in this case. Why? Because XINING has data before 1996 and after 2000, with a big gap in the middle. I suspect that there are two different stations here which require different homogenisation offsets, but which are reporting as a single station. This is the sort of situation (fortunately rare) that the BEST scalpel algorithm is designed to address. -
kampmannpeine at 07:31 AM on 18 April 2012New research from last week 15/2012
thanks for this beautiful anthology ! -
Kevin C at 07:15 AM on 18 April 2012First Look at HadCRUT4
Peter H: Yes, interesting isn't it. I'm guessing those cells have only a single station in, and it is producing unrepresentative readings due to either local influences or a fault. I'll try and track down the China cell. CRUTEM3/4 reject stations which are more than 5 sigma from the cell mean, but that only works if there are at least 3 stations in the box. You can get an even clearer picture of the frequency or otherwise of unrepresentative stations with this applet from Nick Stokes, which shows a globe of anomalies for every weather station for November of last year. You can see a few which are obvious outliers - there's an obvious one in Romania (just West of the Black Sea). -
littlerobbergirl at 06:32 AM on 18 April 2012First Look at HadCRUT4
Fig 3 says it all thanks dana i can stop trying to wonder about the wwii anomaly at least. Well done on the guardian comments on the 'joking' piece btw - up there with monbiot for the denyer response and post numbers :D -
actually thoughtful at 04:54 AM on 18 April 20122012 SkS Weekly Digest #15
The issue of this thread is subtle, in my opinion. For the last year or so, it seems SkS has taken direct aim at deniers, both scientists and non-scientists. There has been some good to come from that - the Pielke Sr. conversation was illuminating. I can quickly get Monckton rebuttals (although he rarely shows up in US discussions of climate change). But I think something has been lost as well - the positive focus on science has been reduced to accommodate the direct interaction with the deniers. We become, in the eyes of the world at large, just another WUWT - only with a different point of view. We are unwitting/unwilling partners in the deniers war on science - just by refuting them (at least directly). Perhaps adding a series just reviewing the science would help? Ari Jokimaki provides great summaries - perhaps one or more of those could be expanded into a full SkS post? Also, posts that tie current events into the discussion (like pointing out that a warm March in the US does not mean the entire globe is setting records (the "G" in AGW)) would be very helpful. Sadly, at this moment I can't volunteer to write the those articles, and I hasten to add this is the best site on the subject - by far - without any changes. -
Andy Skuce at 03:42 AM on 18 April 2012Return to the Himalayas
Snow is more susceptible to sublimation than thick glacier ice, so, other things being equal, a given mass of snow will contribute less to the runoff than the same mass of glacier ice. It's a question of how much surface area of the frozen water cystals is exposed to the air and direct sunlight. Anyone who has experienced a Chinook wind has seen snow disappear into thin air quite quickly, while any ice on the ground lingers longer. Some of the water vapor produced by sublimating snow will, of course, re-precipitate locally as rain or snow. -
Peter H at 03:01 AM on 18 April 2012First Look at HadCRUT4
Re the animated gif, isn't that bright blue square in China odd as indeed are the red one in central Africa and a red square on the American west coast? -
Rob Honeycutt at 02:41 AM on 18 April 2012Return to the Himalayas
It seems to me that California, where I live, can be a good case in point with regards to this subject. The SF Bay area's water supply, as well as farming in the central valley, are reliant upon the snow pack from the previous winter. That snow pack can be very different season to season. A year or two in succession with low snow pack can quickly deplete the bay area's reservoir systems and then we are subject to water rationing. If it were not for the reservoir system which buffers these swings we would have dramatic swings in water supply. Glaciers operate similarly to buffer the water supply to vast down stream populations (much greater than SF, by far). Currently the glaciers of the Himalayas act as reservoirs for those populations. There can be normal swings in the snow pack from season to season but overall they are going to have a constant supply of water because of the buffering effect of the glaciers. What we are doing with climate change is, we're effectively dismantling that glacial reservoir system, AND we are increasing the variability of season to season precipitation. The situation is clearly a looming crisis. I have no doubt that we have already committed to melting the Himalayan glaciers completely over the next 2-300 years. The only possible response will be to build a series of massive dams in those same basins to mimic what the glaciers naturally do. -
Daniel Bailey at 02:00 AM on 18 April 2012Return to the Himalayas
This whole thread is getting quite off-topic and derailed. Steve's most recent comment being "case" in point. And subject to deletion as not being compliant with the posting policy of this site. Mauri sent me some info for a post on the Himalayan glaciers. I will try to put that into shape over the next few days to try to put to bed some of this nonsense. -
Return to the Himalayas
Steve Case - Your point? My telepathy is in the shop, and your post is a bit content-light. Observations indicate less total snow volume, the temperature records clearly show warmer/earlier springs, and both are affecting spring/summer snowpacks feeding agriculture downhill. -
John Russell at 01:04 AM on 18 April 20122012 SkS Weekly Digest #15
Re: Issue of the Week To me, accepting the realities of AGW comes about because I've taken the time to build up in my head a simple working model of how the Earth's climate works and how global temperatures are maintained. Having done that, everything new I read fits into place and makes sense. The problem of dealing with the 'don't knows' is that they don't carry this model around in their heads and so when they hear ridiculous denial claims -- which are often simple and (superficially) seem logical, they cannot apply them to any in-built model and thus see the flaws. A very basic example of this is the idea that global warming can actually produce a cold winter and/or a wet summer; which seems completely counter-intuitive unless you have the model in your head -- at which point it becomes logical. Another example is the one that leads people to say, "how can a trace non-toxic, seemingly inert, gas be harmful?" So to answer the question: the key requirement is to help people construct the model in their heads of how climate works and then how human actions are impacting on it. Of course, even more important, is how we generate the interest in people in order that they're driven to start creating this personal model. Without their personal model in place, you're just appealing for people to trust your expertise or judgement: which can work up to a point. But it can also break down once someone more charismatic comes along. -
Return to the Himalayas
Steve Case - Sudden floods after rainfall are not helpful for agriculture, as most of the runoff is simply lost downstream. Steady water supply throughout the summers requires significant snowpack or glacier melt throughout the year. Declines in that late season water will affect huge agricultural areas. [Source]
-
Tom Curtis at 00:54 AM on 18 April 2012Return to the Himalayas
Steve Case @34, you are quite correct that the flow of the river is a function of precipitation. Essentially, if all the precipitation is rainfall, it is a function of the average precipitation over the preceding week or so, with run off being delayed by vegetation. With very heavy precipitation, you get a greater proportion of run off, and hence a more immediate response to precipitation but the idea is valid. With snow pack, run off in the spring is a function of precipitation during the preceding winter, plus the precipitation during spring. In most river systems, by summer most of the snow will have melted, so river flow will be a function of summer rainfall. With glaciers, runoff is a function of precipitation averaged over several preceding years or even decades. Consequently, where you have heavy winter precipitation and light summer and spring precipitation, if precipitation is as rain, you will have flooding in winter, while in spring and summer the river will run low. With snow pack fed rivers, you will instead have flooding in spring, with winter and summer river levels being low. While with glacier fed rivers you will have near constant river flows throughout the year, with a peak in summer due to the faster rate of melting with summer temperatures. Specific situations will of course vary based on specific details of geography and meteorology in the area; but the basic pattern will hold. Packed snow is known to be permeable to air, both from the well known survival trick of burying yourself in snow to stay warm. If the snow was not permeable, that would not be a survival trick, but an invitation to death by suffocation. Further, studies related to measuring the trapped atmosphere in ice cores have measured the permeability of the firn to air, and found it is still permeable for up to 100 years (in the case of the South Pole). How quickly it becomes impermeable will depend on the rate of deposition of new snow, and hence the rate of compression of the firn, but periods in excess of 30 years are still common even in areas of very heavy deposition. Consequently the assumption that seasonal snow pack is still permeable to air is very safe. Finally, you say repeatedly that it will come down to the rate at which snow and ice melt. That formulation is, however, nonsensical. Snow is just a particular form of ice. What is relevant are the particular details of heat transfer, and how it effects the rate of ice melt given the different structure of snow and ice. Air is an excellent insulator. Consequently in cold weather, the many air spaces in snow will help insulate the inner layers from warming due to conduction or radiation on the outer layers. Without the air spaces, ice blocks have no such insulation. Consequently, in cold air conditions ice blocks heated by conduction or radiation will melt relatively faster. Against this, the snow has a larger surface area for a given mass which would encourage more rapid melting. Apparently in late winter and early spring with snow still on the ground, the balance of extra surface area vs better insulation is unfavourable for loosely packed snow, but favourable for densely packed snow. In April and May, however, the warmer air will penetrate the snow through those air gaps, hastening melt rather than retarding it. Consequently, if you carried out the same experiment in each month of the year, you would get different results in each month. And your experiment ignores the obvious facts that glaciers have a very large mass (and hence heat capacity) per unit surface area, while snow which is scattered thinly over the side of the mountain has a very large surface area per unit mass. If you are serious about your experimentation, you need to first control air temperature and mass and change surface area to see what effect that has. You then need to control for surface area and mass, and change air temperature and see what effect that has. Until you do so, your experiment is irrelevant, and certainly does not provide evidence that you can set against the observations of hydrologists on the actual impact of glaciers and snow packs of flow rates in rivers. -
Michael Whittemore at 00:34 AM on 18 April 2012New research from last week 15/2012
I always dislike when people say that Al Gore was not telling the truth in his movie regarding high sea rise. He clearly explains that West Antarctica could rapidly melt and that Greenland could slip into the ocean. All I see in the peer review, is paper after paper of Greenland lakes disappearing and West Antarctica breaking up..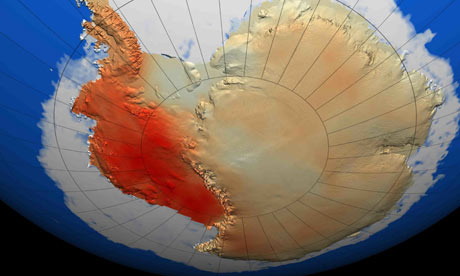
-
Steve Case at 00:18 AM on 18 April 2012Return to the Himalayas
Tom, Over time, measured in years, the flow in the river of any watershed is a function of the precipitation that falls in that watershed. The presence of a glacier ultimately has nothing to do with it. If the glacier is advancing year to year, the flow will be less than precipitation. If it's receding, the flow will be more. If the glacier is static or there is no glacier then flow will the same as precipitation. Those four cases are all minus evaporation. Packed snow permeable to air? Well, that's an assertion. As I've said a few times now, this whole thing will revolve around the difference in melt rate between ice and snow. -
Tom Curtis at 00:04 AM on 18 April 2012Return to the Himalayas
Steve Case @33, you are ignoring the fact that snow pack comes in drifts of a few feet thick while glaciers are tens of meters thick. The result is that relative to snow pack, the glaciers have a much larger volume relative to surface area which accounts for their slow melt rate. I should also note that snow pack, even thickly packed snow is permeable to the air. That is of little consequence when air temperatures are below freezing, but for temperatures significantly above freezing, I strongly suspect it will result in the packed snow melting faster than the ice of the same mass. -
Steve Case at 23:47 PM on 17 April 2012Return to the Himalayas
skywatcher #30You wrote:
- ...The ice cube is a reservoir that lasts through the dry season, holding back the precipitation that fell earlier in the year and gradually releasing it through the dry season. Snowpack is a much weaker and less stable form of this, often diappearing quite quickly in the melting season ...
I said in my first post that this discussion would boil down to the difference in melt rate between ice and snow. I've been making this argument on different boards for some time now and I always wind up dealing with assertions like yours above. Last year I even did some crude experimentation:


I got an "It depends answer" Packed snow outlasted the ice and fluffy snow does not. -
Kevin C at 23:46 PM on 17 April 20122012 SkS Weekly Digest #15
LarryM: There's a trivial proof that climate is not chaotic, and indeed is predictable. Isaac Held's presentation is elegant. -
Riccardo at 23:24 PM on 17 April 2012Global Warming in a Nutshell
davpaf "doesn’t any material with a temperature above absolute zero, radiate heat?" A black body radiates following the Stefan-Bolzmann law. You need to multiply it by ε, the emissivity, for any real substance. If ε is zero, or in the frequency range where it is zero, so will be the radiation flux. Then the answer to your question is "more or less", depending on ε. -
tmac57 at 23:06 PM on 17 April 2012Newcomers, Start Here
Tom-Yes,thanks,I had already read Tamino's post.I thought that it could have been a bit more comprehensive,but maybe it doesn't really deserve that much attention.It does appear that the denial machine is making quite a bit of noise about it,so I thought more push back from the science side might be warranted. -
Tom Curtis at 22:31 PM on 17 April 20122012 SkS Weekly Digest #15
Alexandre @24, that a cooler object can contribute to the more rapid, or greater heating of a warmer object is one of the easiest home experiments you can conduct. It is in fact, as easy as putting on a lid: For an alternative take, we can check out Matt. To fully satisfy the "skeptics" we would need two thermometers, one in the water and one on the lid to show that the lid is cooler (the use of hands to determine temperature not being recommended). I discuss the relevance, and other examples here. This experiment has additional benefits. It teaches you how to save water, money and CO2 emissions. -
Alexandre at 21:52 PM on 17 April 20122012 SkS Weekly Digest #15
Tom Curtis at 09:43 AM on 17 April, 2012 Indeed, an experiment has to be sufficiently controlled to produce any meaningful result. But I still think the education provided by SkS could greatly benefit from experiments, even simple ones. Questions like "can a cooler object affect the temperature of a warmer object?" could be greatly assisted, or even resolved, with an experiment, saving patience and time from all parties involved. I confess I don't have the time or knowledge to provide concrete examples, though. It's just a thought. -
Steve Case at 21:52 PM on 17 April 2012Cliff Ollier: Swimming In A Sea of Misinformation
Rob Painting, Yes, I noticed that CU's Sea Level Research Unit put out a new release yesterday, and that graph I posted above would now look like: http://i40.tinypic.com/a1ppy.jpgModerator Response: [DB] This thread is abour Cliff Ollier: Swimming In A Sea of Misinformation; if you wish to pursue your long-standing skepticism of SLR, please take it to one of the SLR-specific threads. Those who wish to engage Steve further on this, please do likewise. -
bath_ed at 20:23 PM on 17 April 2012Return to the Himalayas
Steve Case#16: "the IPCC tells us that in a warmer world there will be more precipitation." Rather than arguing from first principles, it would be better to see if you can find any peer-reviewed studies that support your opinions. The predicted effects of climate change are well studied and the conclusions don't generally match yours. Your starting point is correct, that a warmer world also tends to be a wetter world *in general* and the Earth has *in general* dried as it has cooled in the Cenozoic (with the emphasis on “in general”). However, things are not quite so simple as to be able to conclude from that the effects will be beneficial to humanity. There are a number of other, complicating, factors that make the picture less rosy. First of all, where will the extra precipitation fall? Not everywhere will receive more rain – some will receive less. If, as is predicted, already wet regions receive more rain and snow while dry ones, especially in the subtropics, receive less, that would be extremely damaging for agriculture. It is predicted that precipitation will increase in the equatorial and sub-polar regions which are generally regions of excess moisture but decrease in the subtropics, where most of the world’s arid and semi-arid regions are found. Secondly, as temperature rises so does water loss and so more rainfall is needed. Would any increase in precipitation be sufficient to compensate for increased water loss? Think of say England, generally a ‘green and pleasant land’ where crops grow without irrigation, naturally covered in woodland (now mainly cleared). London has an average annual rainfall of 602mm, but is in world terms not exactly a hot city. By comparison, in tropical regions, around 1800mm of rainfall is needed per year to support woodland growth where the trees do not need to drop their leaves for part of the year for lack of water. At equatorial temperatures 602mm of rainfall wouldn’t go far and there would be many brown, parched months. Thirdly, one needs to think of when in the year the precipitation comes. Part of the reason for England’s greenness is that the rainfall is distributed fairly evenly through the year. If it mainly fell in the winter half of the year with little in the summer, the picture would be very different. Models of climate change predict greater seasonality of rainfall. Indeed, studies of the Palaeocene-Eocene Thermal Maximum (PETM), a period of extreme global warming thought to have been brought about by massive greenhouse gas release, show evidence of greatly increased seasonality with long dry periods followed by violent downpours. At the height of the PETM in the Bighorn Basin of Wyoming moist woodland was replaced with seasonally dry, open forest, similar perhaps to that found today in parts of Central America. Fourthly, if some regions become more suitable for agriculture and others less there are many associated problems even if there is little or no net change (or even a net positive change). Imagine if agriculture were to fail in say Kenya but open up new possibilities in Russia. Would it be possible for Kenyan farmers to simply up sticks and move to Russia? Would the Russians welcome them? Would they adapt? Or would we just decide that the Kenyans’ loss was balanced by the Russians’ gain and therefore famine in Kenya didn't matter because there were bumper harvests in Russia? I think you can see that the problem wouldn’t be trivial. -
davpaf at 19:53 PM on 17 April 2012Global Warming in a Nutshell
Ok, so by equating TS and TE, one assumes TS is based on an existing atmosphere (affecting the amount of incoming solar radiation, as stated by clouds, dust, ozone) and TE is based only on the earth surface radiating into space, not the atmosphere. Shouldn’t strictly speaking all GHG effects be also removed from the TS part, I mean in this way it seems a bit inconsistent? One more question, doesn’t any material with a temperature above absolute zero, radiate heat? So if say one puts a parcel of air into space, it will eventually cool down. I understand that GHG, have specific bands of emission/absorption characteristics for specific radiation wavelengths, which oxygen/nitrogen don’t have. But both must be radiating if they have a temperature, right? Thanks. -
funglestrumpet at 19:34 PM on 17 April 20122012 SkS Weekly Digest #15
Issue of the week My biggest problem with the whole issue of AGW is the 'A' bit. The opinion seems to be that if the current warming we are experiencing were not anthropogenic in origin, all would well. I find that utter nonsense, and consider that we on this side of the fence do great harm by concentrating on that aspect of the problem. Perhaps I have it wrong, but from my perspective if the current warming were due to the Sun, say, then the need to reduce CO2 emissions would be all the more urgent, seeing as such an increase in solar output would be unexpected and not in line with how we expect the Sun to behave. Such unexpected behaviour would mean that we would be unsure whether the warming was going to continue indefinitely, stabilize at some point, or was just the ‘up’ part of a new and previously unknown cycle that was soon going to reverse itself and thus become a cooling phase. Until we were able to determine which of the options was correct (and quantify, if possible, the extent of the warming we were going to experience), it seems to me utter folly not to act, and act urgently, to do whatever we could to combat the warming induced by the increased solar radiation. Obviously, increasing albedo by painting all roofs white and growing flora that had lighter coloured, or shiny, foliage would help. So too would reducing CO2 emissions. In fact, so long-lived is atmospheric CO2 it would surely have top priority. I would find refusing to support action to combat the warming an act of treason against the human species, as indeed do I see the behaviour of all current members of the denialati, some more than others, in fighting CO2 induced warming. It is no defence that a very small number of scientists do not think that the level of warming will be as high as others. Until they can prove their case conclusively, we are obliged to go with the majority of scientists (as Galileo did with his fellow scientists, with emphasis on the word ‘scientists’). As for action by sks, or lack of it, I think that this site pays far too little attention to tipping points. In fact it almost seems to be a side issue, yet crossing a tipping point – always silently – might commit our offspring to dire conditions. Again, perhaps I am wrong, but I don’t think that the public is as aware as they should be of the danger that crossing a tipping point brings. There is a YouTube video of a car on a road covered in black ice. The driver crawls very cautiously at less than walking pace over the brow of a gentle hill on a housing estate somewhere or other. The driver obviously becomes aware, too late, that they have crossed a tipping point past which they cannot slow down. The car proceeds down the hill, wheels locked, until it hits a parked car. Am I wrong in thinking that we, as a species, are in a ‘car’ called planet earth that is creeping towards the brow of an icy galactic hill and the time is nigh, if not already in the past, where we will not be able to slow down, or stop progress to circumstances where planet earth will not support our descendants in anything like the projected population numbers soon to be upon us, not to mention what will happen to those that survive. The public are just not aware of that there is even a hill, let alone the danger of crossing its brow. The question in my mind is not ‘if’ the population will wake up to the danger of climate change, but ‘when’ it will, and whether the time that it does will be too late to act in any meaningful way. I will only get a small amount of pleasure from the fact that the prominent members of the denialati will be in grave danger if the public rise up in the way they have in the past, such as how they did in forming lynch mobs against paedophiles in the U.K. That will be their problem; my problem will be concern that perhaps I could have done more. -
CBDunkerson at 19:29 PM on 17 April 2012Global Warming in a Nutshell
davpaf wrote: "Wouldn't this be effectively the representation of a planet system without an atmosphere?" If the atmosphere were composed entirely of gases which are 'transparent' to outgoing radiation (i.e. if all 'greenhouse' gases were removed) then it wouldn't matter... an atmosphere 100% transparent to all outgoing radiation is the same as no atmosphere at all for this purpose. That said, there are a lot of things in the atmosphere (e.g. dust, ozone) which block incoming radiation. Thus, if Earth had no atmosphere at all the incoming radiation and TS would be higher... at that, if we removed all GHG that'd mean no clouds, a correspondingly lower albedo, and thus higher TS (with or without an atmosphere). Anyway, the takeaway message is that GHG are the only reason TE does not equal TS - irrespective of any changes in the value of TS due to linked factors. -
davpaf at 18:37 PM on 17 April 2012Global Warming in a Nutshell
Morning, OK, I think I also got a bit mixed up with CO2 and all the other GHG's in this thought experiment and after reading the quotes from the papers again and your comments, I am a bit clearer I think So would it be correct to say then, that in a situation without any GHG's, TS = TE, which would actually mean, the complete atmosphere is not active in radiating to space, only the surface. Wouldn't this be effectively the representation of a planet system without an atmosphere?
Prev 1195 1196 1197 1198 1199 1200 1201 1202 1203 1204 1205 1206 1207 1208 1209 1210 Next


