


 Arguments


Recent Comments
Prev 1197 1198 1199 1200 1201 1202 1203 1204 1205 1206 1207 1208 1209 1210 1211 1212 Next
Comments 60201 to 60250:
-
matzdj at 23:33 PM on 17 May 2012Global warming stopped in
1998,1995,2002,2007,2010, ????
In these posts, am I hearing Dikran say that there does appear to be a step change in the observed data, but it has not extended for long enough for us to statistically verify that it is not within the existing model? I'l buy that. But doesn't that suggest that maybe we should wait a bit longer to see what is going to happen before suggesting that the sky is falling and planning to spend Trillions of dollars on things aimed only at reducing CO2 emissions, just in case? {snip} DaveModerator Response: TC: Of topic ramblings snipped. Dave, you are welcome to comment here, but you are not welcome to ignore the comments policy. Read it carefully and comply. Failure to do so will result in moderation, and if you consistently fail to comply, moderators will take the easiest method of moderating your posts (deleting). In this particular case, just because one part of a post in on topic does not mean all are. Future of topic ramblings (Gish gallops) will result in the simple deletion of the offending post. -
Eric (skeptic) at 23:09 PM on 17 May 2012Climate Change Consequences - Often Unexpected
Here's a well written brochure with some cost data on page 16: http://v3.mmsd.com/AssetsClient/Documents/sustainability/SustainBookletweb1209.pdf Deep tunnel cost is $2.42 per gallon. Green roofs are double that cost but have other benefits. Rain gardens cost more too, but with benefits. However lots of other solutions are much cheaper. -
Eric (skeptic) at 22:46 PM on 17 May 2012Climate Change Consequences - Often Unexpected
It is much simpler for bureaucrats to design a giant expensive system and not coincidentally the Cloaca Maxima was built by the last King of Rome and most projects like the State Tunnel Project in RI are mostly federally funded. They are not cost effective. The RI project contains 1.5 inches of storm water at a cost of $359 million. If the same amount of water were impounded in 1/100 of the land area it would be 150 inches deep. But in reality the depth and surface area would be much less with straightforward and practical measures described here http://www.csdu.it/il_sito/Pubblicazioni/altre_pubbl/S'A_RelazioniGenerali/F-Relazione_Mem_Marsalek.pdf In a suburb, every impervious area should have an associated holding area with 1.5 inch capacity without runoff. That's obviously more difficult in the city, but hardly stretches the imagination in Providence which has more than enough elevation to build runoff channels for excess storm water. These solutions are an example of the failure of centralized authority (EPA mandates) and local government run amok. -
chrisd3 at 22:23 PM on 17 May 2012An exponential increase in CO2 will result in a linear increase in temperature
There's another factor at work here: As temperature rises, CO2 sinks become less and less effective, so the relationship between total CO2 emissions and CO2 concentration is exponential over a scale of decades to centuries. This exponential relationship between emissions and concentration essentially cancels the logarithmic relationship between concentration and warming, so that the relationship between total emissions and warming is more or less linear. See Matthews et al 2009: http://www.nature.com/nature/journal/v459/n7248/abs/nature08047.html and more discussion at ClimateSight: http://climatesight.org/2012/05/16/cumulative-emissions-and-climate-models/ -
bath_ed at 21:49 PM on 17 May 2012Climate Change Consequences - Often Unexpected
I think the value of this post is in pointing out the unexpected, undramatic impacts of warming the Earth, which will end up being costly to solve. I don't believe predictions that half the population of Los Angeles is going to die from lack of water within the space of two weeks in the next few decades - that is really alarmist and I don't think it helps the task of convincing people that climate change is a serious issue. As for peak oil, it may well have already happened, and we'll only know for certain once it's behind us. The fact that oil producers haven't been able to increase their production in response to dramatic price increases, even in a world economic crisis which one expects to dampen demand, points to an inability to pump more oil. I've read several conflicting studies on the issue. Some suggest that the increasing cost of fossil fuels will prompt a switch to renewable and low-carbon energy sources whatever our climate policy. Others have a gloomy scenario in which we switch to non-conventional oil sources such as the Athabasca tar sands in Canada, Venezuela's Orinoco Belt tar sands, coal-to-liquids technology as used by SASOL in South Africa to produce synthetic diesel etc, which would combine catastrophic warming with economic depression brought on by trying to continue an economic model based on cheap oil in an era of expensive synthetic oil. -
les at 20:29 PM on 17 May 2012Dear Heartland, Stop using Arthur Robinson's Trick to Hide the Incline
A fabulous look at the AstroTurf manufacturing process. -
dorlomin at 19:52 PM on 17 May 2012Dear Heartland, Stop using Arthur Robinson's Trick to Hide the Incline
Would it be churlish of me to point out there is a self anointed pseudo auditor who has taken it upon themself to examine all the paleo misrepresentations, yet seems to have missed this one? -
Dikran Marsupial at 19:38 PM on 17 May 2012Global warming stopped in
1998,1995,2002,2007,2010, ????
Helena, the point is that saying that the climate exhibits hysteresis is no more informative than saying that it exhibits step changes, it is a statement about the observations, it isn't an explanation for thos observations. However, as I said, there is little evidence that there has actually been a step change that needs explaining! -
Helena at 19:12 PM on 17 May 2012Global warming stopped in
1998,1995,2002,2007,2010, ????
DM : I do not have any idea on what exactly would cause the climate system to exhibit this exact hysteresis properties. I am merely responding to "muon" statement by saying that hysteresis property (and therefore step changes)and metastable states are not uncommon in complex systems ; in the climate system, there are many places where you can store heat or cold. -
Dikran Marsupial at 17:35 PM on 17 May 20122011 Sea Ice Minimum
I've updated my model with data up to Sept 2011 and the revised prediction for Sept 2012 is 4.584938 +/- 1.031588 M km^2. As before, this is not a serious attempt to predict this years September average sea ice extent, just experimenting with the GPML toolkit, as Roy Spencer would say "for entertainment purposes". Having said which I'd be surprised if the actual extent lay outside the 95% credible interval, very happy if it were above, (much) less so if below. -
Dikran Marsupial at 17:14 PM on 17 May 2012CO2 has a short residence time
Martin A I wrote a peer-reviewed response to the paper by Robert Essenhigh on the residence time argument, you can find the abstract etc. here. I use a one-box model (similar to that used by Essenhigh) and get a short residence time of about 4 years and an adjustment time of about 74 years. However, you can't get a good quantative estimate of the true life time of an excess of CO2 in the atmosphere from simple one- or two-box models. The reason for this is that such models only model the fast takeup of CO2 into the thermocline. The full response of the ocean needs to include the slower transport of CO2 into the deep ocean, for which you need a model that includes a layered ocean (and other additions), such as the Bern model. If you get an adjustment time of 50-200 years, then you are in the right ball park for the uptake into the thermocline and are unlikely to do any better with such a simple model. HTH -
Dikran Marsupial at 17:04 PM on 17 May 2012Global warming stopped in
1998,1995,2002,2007,2010, ????
matzdj wrote "The most important data is the data that doesn't fit your models. If you can't explain it, you need to change your model to incorporate it." I think the problem here is that you clearly don't know what the models actually say. I think it is incumbent upon you at this point to do some research before making such bold statements. -
Dikran Marsupial at 17:01 PM on 17 May 2012Global warming stopped in
1998,1995,2002,2007,2010, ????
helena@65 "Hysteresis" is not an explanation, as Tom rightly points out. Now if you could give a physical explanation why the climate should exhibit hysteresis, then that might be an explanation. However, before trying to explain the reason for there being a step change, you first need to show that there is evidence that a step change has actually ocurred, rather than a long term trend with noise. The analysis has been done more than once, and the statistical evidence for a step change is very small. -
Dikran Marsupial at 16:56 PM on 17 May 2012Global warming stopped in
1998,1995,2002,2007,2010, ????
matzdj wrote "I try not to use short term trends, but I also try to not to ignore the short term trend that doesn't fit the model, unless I can find a cause that was not in the model." I can't let this pass. It has already been explained to you that short term trends are essentially meaningless as the magnitude of the long term trend is small compared to the noise (i.e. internal climate variability). Thus you are in no position to say that the short term trend doesn't fit the model. If you look at the error bars on the model, then the current observations fit within them as well as might reasonably be expected. Essentially you need to learn what the model actually says. Here is an example of model output from RealClimate, the black line is the most likely outcome, but anything in the 95% range is in line with expectations. Note that even with the recent "levelling off" the observations are well within the error bars (in fact they are only just over one standard deviation from the mean).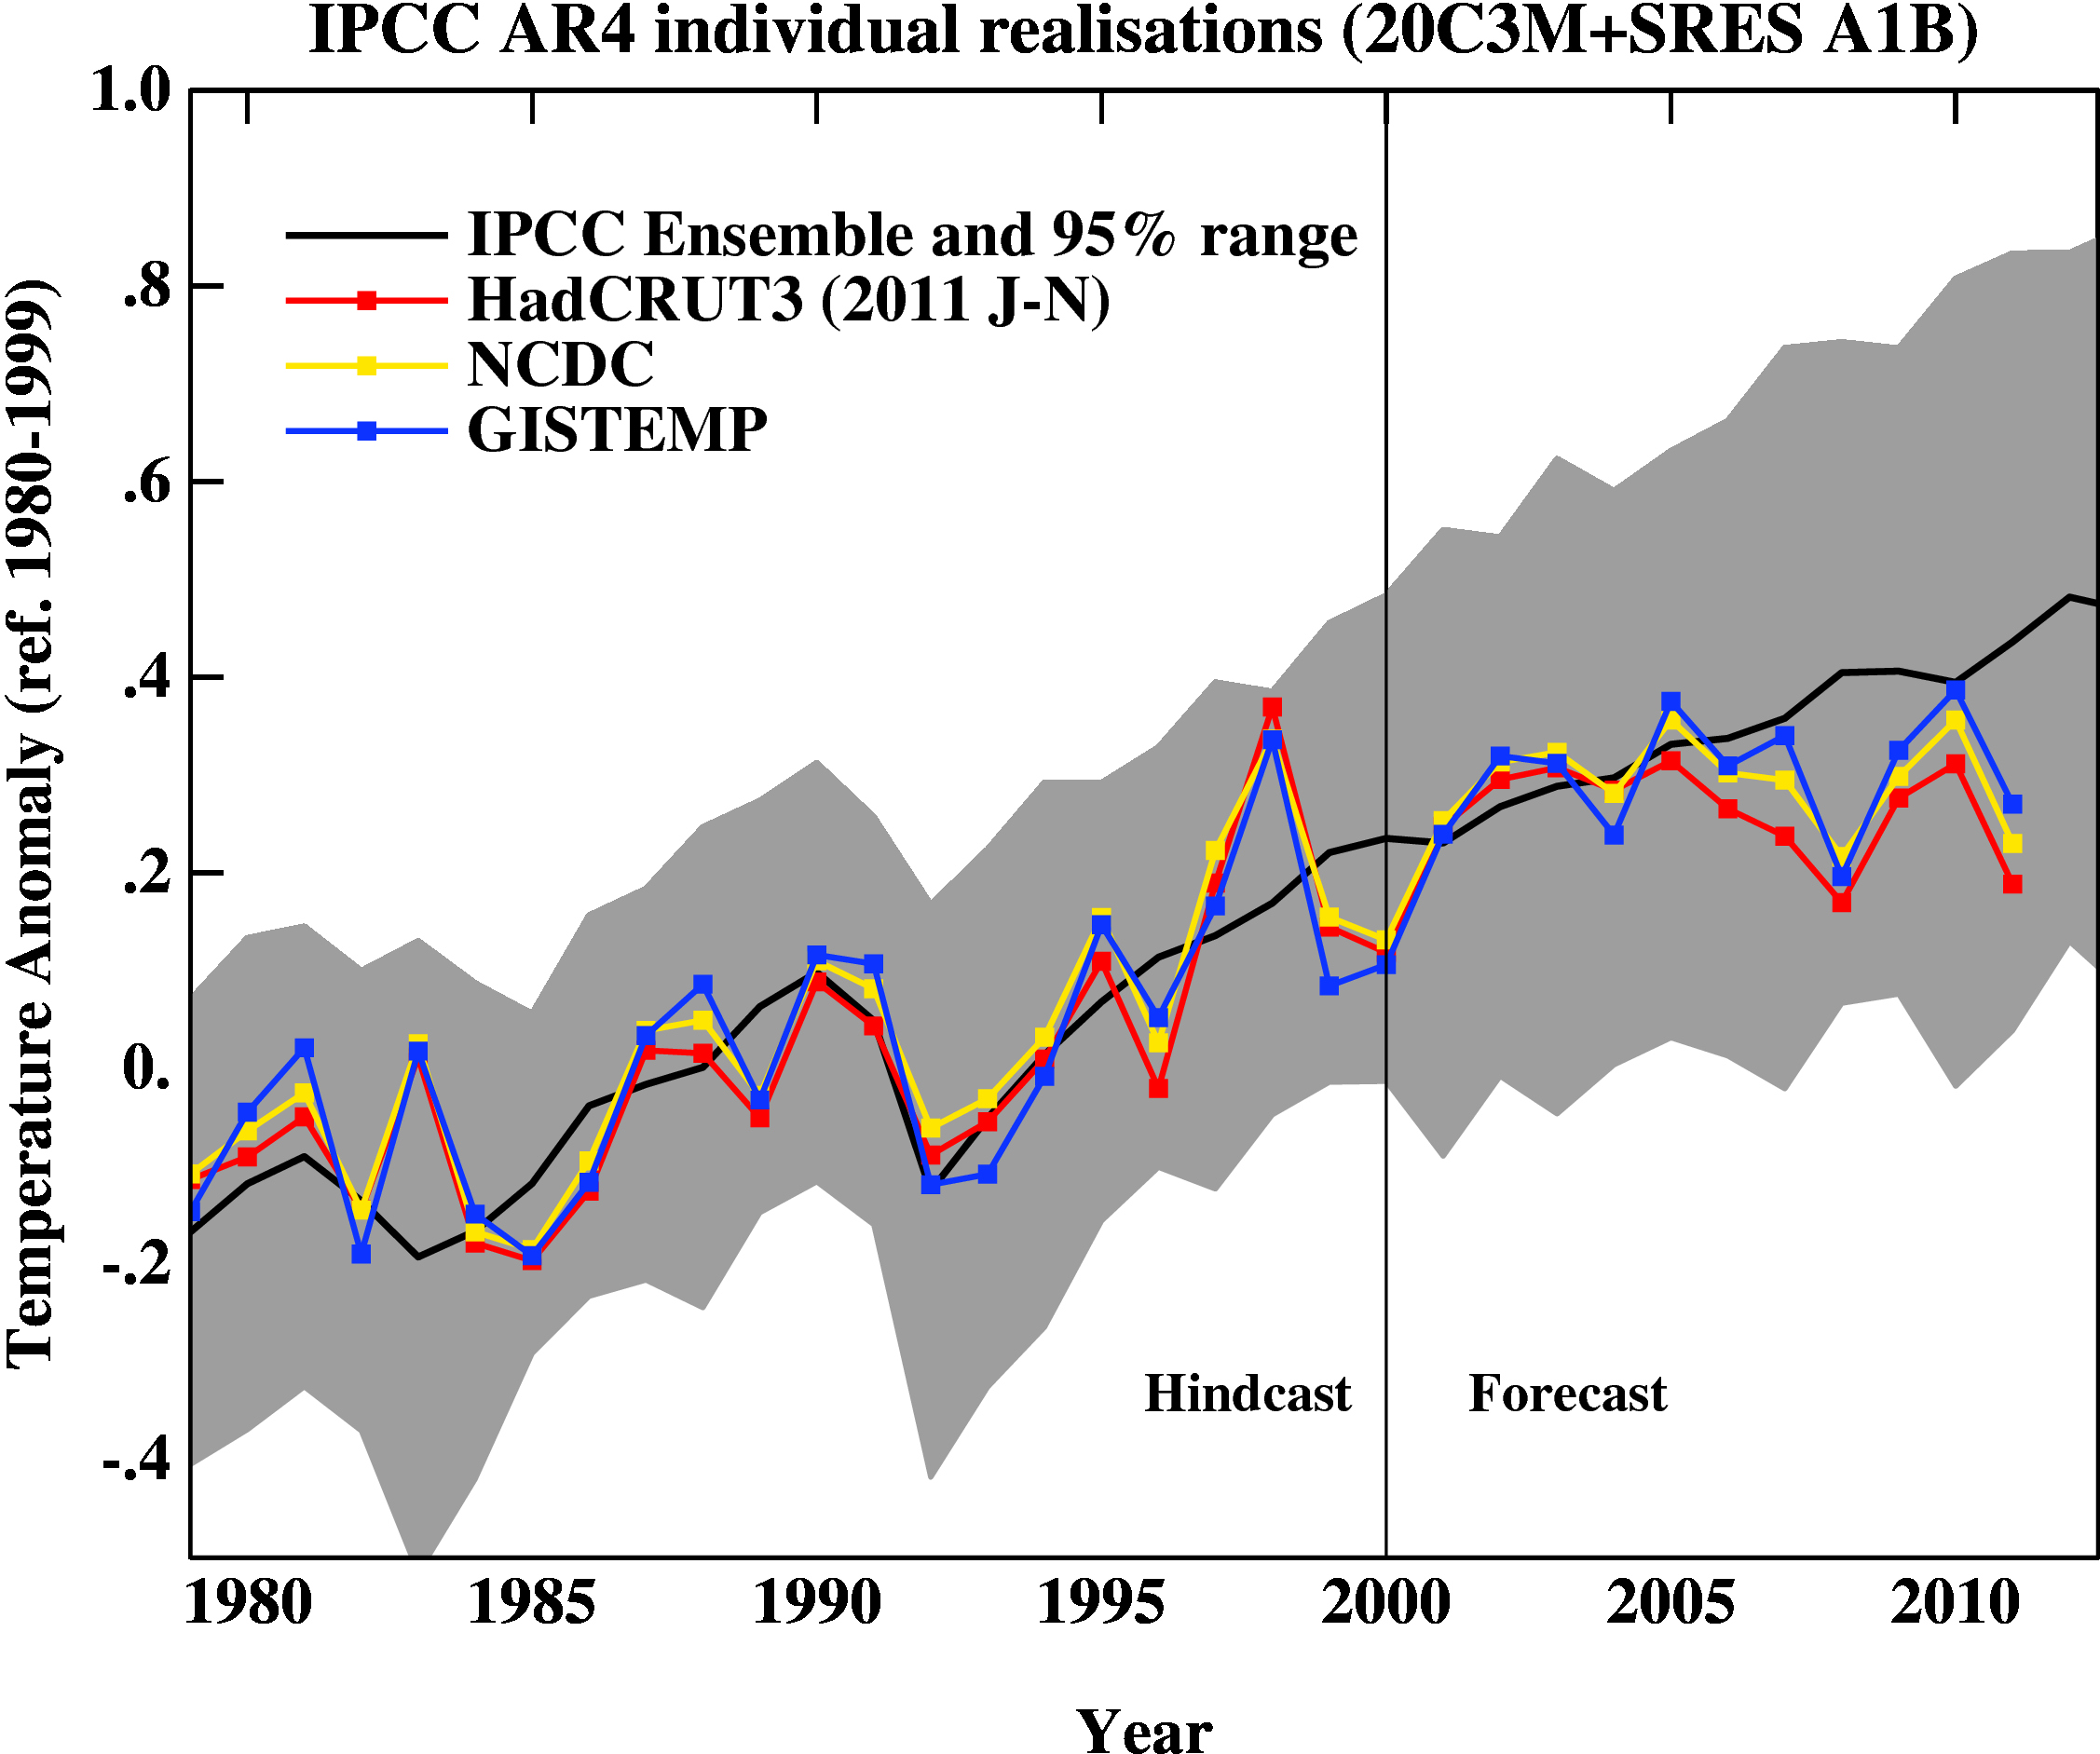 "By any chance has anyone done a Student-t analysis of the data from 1979-1996 versus the population from 2002-2012 to see whether they appear to be data from the same population?"
Yes, and I said so in my previous post (although the proper test isn't as simple as a t-test because the populations would be different whether there was a step change or a linear trend). I even set a break-point analysis of this data as an assignment for my MSc class in Bayesian statistics. The 2002-2012 period is just too short to determine reliably whether there is a trend or not.
The image is an animated GIF, I didn't create it, but there are software packages that can create them in the public domain.
If you are worried about manipulating the data, then the key is not to have a pre-concieved view on what the outcome should be (bear in mind the famous quote "he uses statistics in the same way that a drunk uses a lamp-post - more for support than illumination" ;o). The next most important thing is to perform a statistical hypothesis test to see if the statistics back up your subjective interpretation.
"By any chance has anyone done a Student-t analysis of the data from 1979-1996 versus the population from 2002-2012 to see whether they appear to be data from the same population?"
Yes, and I said so in my previous post (although the proper test isn't as simple as a t-test because the populations would be different whether there was a step change or a linear trend). I even set a break-point analysis of this data as an assignment for my MSc class in Bayesian statistics. The 2002-2012 period is just too short to determine reliably whether there is a trend or not.
The image is an animated GIF, I didn't create it, but there are software packages that can create them in the public domain.
If you are worried about manipulating the data, then the key is not to have a pre-concieved view on what the outcome should be (bear in mind the famous quote "he uses statistics in the same way that a drunk uses a lamp-post - more for support than illumination" ;o). The next most important thing is to perform a statistical hypothesis test to see if the statistics back up your subjective interpretation.
-
70rn at 16:28 PM on 17 May 2012Dear Heartland, Stop using Arthur Robinson's Trick to Hide the Incline
It isn't the first this specific form of distortion has been documented here. I recall essentially identical treatment of greenland temperature (last year?), right down to the 1-2 punch combo of 'make-local-global'/'make-past-present', in an attempt to floor that most pernicious of opponents, accuracy. I'm very grateful to the continued dissection of these types of presentations. Particuarly in regards to the methodology of such paleotemperature studies. It's pretty incredible that modern thermometer data is sieved so finely, month by month, when 50 year average data slabs containing noise from Churchill's childhood is accepted verbatim... -
Helena at 15:45 PM on 17 May 2012Global warming stopped in
1998,1995,2002,2007,2010, ????
Tom, do we agree that hysteresis is a possible class of explanation for step changes, especially in a complex system ? I'm not saying that's what's happening (i actually do not think that is is what we are seeing), but such phenomena do exist. -
Tom Curtis at 15:42 PM on 17 May 2012Global warming stopped in
1998,1995,2002,2007,2010, ????
Helena @63, "hysteresis" is not an explanation. It is merely the name for a class of explanations. Saying "What about hysteresis" contributes no more to explaining the event than a scholastic saying that opium induces sleep because of its " dormitive virtue". It is sloganeering, not discussion. -
Helena at 15:24 PM on 17 May 2012Global warming stopped in
1998,1995,2002,2007,2010, ????
muoncounter55 : "Your proposed 'step change' has been discussed here before. The problem is that there is no physical mechanism that can make that happen." What about hysteresis ? -
skywatcher at 15:17 PM on 17 May 2012Polar bear numbers are increasing
Dave, did you read the 'comment' links next to each statement? There is a justification for each of their evaluations, and it's certainly based on a lot more than a photo of a polar bear cub. Do you really believe the world is "focusing on Polar Bear longevity when 250,000 children die every year from lack of a clean water supply"? Do you not think the world is trying to solve both problems? -
matzdj at 14:45 PM on 17 May 2012Polar bear numbers are increasing
Below is the Polar Bear Population, by colony, from the Polar Bear Study Group site http://pbsg.npolar.no/en/status/status-table.html. Third column from the right is the Status.
5 groups are Reduced, 4 are Not Reduced, and 10 are Data Deficient.
But based on that and on assumptions about what will happen if there is major glacier melt, They identify
8 will be trending down, 3 will be stable, and one will increase.
But the estimate of risk says
6 are at very high risk, 1 is High Risk, 1 is a Moderate Risk, and 2 are at low Risk.
Note that in the Chukchi Sea, they claim to not know how many bears there are, but they report them as trending down.
In the Norwegian Bay, the Status is Data Deficient but they are listed as being at high risk of future decline.
I read their last full report and found that link between the data in this chart and the projections of extinction seem to be smoke and mirrors.
In the 1950's the population was about 5000. Today the population is 20,000-25,000. How can we be focusing on Polar Bear longevity when 250,000 children die every year from lack of a clean water supply.
Our concern about polar bear extinction, now that hunting is under control, seems to be totally misplaced because of a photo of a polar bear cub sitting on a tiny piece of sea ice.
Dave
Third column from the right is the Status.
5 groups are Reduced, 4 are Not Reduced, and 10 are Data Deficient.
But based on that and on assumptions about what will happen if there is major glacier melt, They identify
8 will be trending down, 3 will be stable, and one will increase.
But the estimate of risk says
6 are at very high risk, 1 is High Risk, 1 is a Moderate Risk, and 2 are at low Risk.
Note that in the Chukchi Sea, they claim to not know how many bears there are, but they report them as trending down.
In the Norwegian Bay, the Status is Data Deficient but they are listed as being at high risk of future decline.
I read their last full report and found that link between the data in this chart and the projections of extinction seem to be smoke and mirrors.
In the 1950's the population was about 5000. Today the population is 20,000-25,000. How can we be focusing on Polar Bear longevity when 250,000 children die every year from lack of a clean water supply.
Our concern about polar bear extinction, now that hunting is under control, seems to be totally misplaced because of a photo of a polar bear cub sitting on a tiny piece of sea ice.
Dave
-
skywatcher at 14:20 PM on 17 May 2012Global warming stopped in
1998,1995,2002,2007,2010, ????
Dave #61: Heat content is a property, like many in the climate system, that has a variation (noise) about a trend of some magnitude. Some may be actual variation, some may be measurement errors, of a value not shown on the plot. These contribute to the fact that the heat content graph you show is not rising monotonically (though you might see that the 0-2000m heat content at NOAA does appear to be rising pretty smoothly). Consequently, it is not straightforward to determine whether the rising trend from about 1983 on your chart has actually abated in any way. You certainly cannot do it by eye, as your eye will be all-too-easily drawn to illusory patterns. Plot your NOAA data from 1983-2006, add a trend, determine if it is significant, examine the residuals, then add in the last five years of data. Are they close to the rising trend? Is there any evidence in that plot that what you are seeing is anything but noise about the rising trend? Have we departed from the trend? You can do the same with temperature data, as in Tamino's excellent Riddle Me This post. Plateaux are very frequently illusions - as Richard Alley and SkS' own Escalator show, you're always on a plateau if you allow yourself to be fooled into thinking that noise is signal. So far, from the evidence of that plot alone, I don't see anything that is unexplainable. -
matzdj at 13:35 PM on 17 May 2012Global warming stopped in
1998,1995,2002,2007,2010, ????
DB, My apologies for that last long post. i won't do that again. It was all in response to comments made about my earlier post. All one subject - trying to understand the link between CO2 and Global Temperature that transcends observed correlation. I've seen some of the posts on the global heat content. The bar chart I showed: is from NOAA. Do you dispute their report? In the last 10 years, how is global heat content change consistent with any steadily increasing parameter - like atmospheric CO2. Yes it has increased. Yes it is higher now than it has been for the recent 30+ years. Doesn't it look like there is a flattening? Why is anything that doesn't meet the belief, always blown off as short term or anomalous or bad data or funded by big oil. If the experiment was good and the data reduction unbiased, it is unscientific to not consider it.
Dave
How long would this data have to not increase before there would be an acceptance that it is not increasing?
The most important data is the data that doesn't fit your models. If you can't explain it, you need to change your model to incorporate it.
Dave
Moderator Response:
is from NOAA. Do you dispute their report? In the last 10 years, how is global heat content change consistent with any steadily increasing parameter - like atmospheric CO2. Yes it has increased. Yes it is higher now than it has been for the recent 30+ years. Doesn't it look like there is a flattening? Why is anything that doesn't meet the belief, always blown off as short term or anomalous or bad data or funded by big oil. If the experiment was good and the data reduction unbiased, it is unscientific to not consider it.
Dave
How long would this data have to not increase before there would be an acceptance that it is not increasing?
The most important data is the data that doesn't fit your models. If you can't explain it, you need to change your model to incorporate it.
Dave
Moderator Response:[DB] "Doesn't it look like there is a flattening?"
You rely on the fallible eyecrometer when in-depth analysis sheds a more accurate, and different, light on the matter. This has been studied thoroughly and is fully documented on this site.
For starters, a select few may be found here, here, here, here and here.
It is not a question of belief; the data is what it is and show the warming to be irrefutable. To maintain otherwise displays innocent ignorance or denial.
-
Helena at 13:11 PM on 17 May 2012IPCC graph showing accelerating trends is misleading
(-Snip-)Moderator Response:[DB] Moderation complaints snipped. Please construct comments to adhere to this site's Comments Policy.
Please note that simply disagreeing without then providing a foundation based in the science/literature is construed as sloganeering. As you have consistently been doing this it also constitutes excessive repetition.
If you have something of substance to support your position then your are welcome to provide it. However, as it stands your position has been completely refuted on this thread.
-
matzdj at 12:34 PM on 17 May 2012Global warming stopped in
1998,1995,2002,2007,2010, ????
Repost 1 Gee Whiz! I'm glad that I got so many comment on my post. I haven't had time to go through them all yet yet, but I promise I will. Here are some of my comments so far: Sphaerica, I didn't said that there is no "global warming'. What I'm trying to understand is how you build a causal relationship between a steadily increasing parameter like atmospheric CO2 concentration over this last 40 years and what appears to be a step change in average temperature level. I've read the first two articles you suggested but the key thing that I gained from them was a set of temperature rise data that was quite different than my starting point, which as you know came from Roy Spencer. I recognize that there are lots of questions about some of this proposals and theories and analyses, but is there any argument about the data reduction he shows from the NOAA GISS data? (I'm just talking about the data points and not the curve fits of the 13 month averages). The original post in this thread started with that curve, using it without question. Is there an argument that the blue dots on this curve are not valid? http://home.comcast.net/~matzdj/SkepticalScienceNote051412/UAHRaw.jpg If it's considered good data and a proper reduction of that data to average monthly global temperature, my argument still stands. Global temperature is higher now than it was in 1979. We all know that there is more C02 in the atmosphere now than in 1979. But, if you think about it, there are also many more microchips in use today than in 1979. Which causal relationship would you like to draw? [You mentioned inappropriate data presentation. I've read the book 'Cheating with Graphs". I try to look past the curve fit and don't see any axis stretching on this chart. ] I am convinced that you you have to look at the data, not just statistically analyze it. Even something as simple as averages can be very deceiving. I went hunting last week. I fired at a duck and mssed by 6 in front. Then I took a second shot and missed by 6 inches behind. On the average, the duck is dead. You comment that a 10 year analysis is too short for climate. I agree. But the lack of temperature increase over the period 2002-2012 when there was accelerating CO2 emissions certainly doesn't do anything to confirm the CO2 vs T relationship. Is there any expermental result that would convince you that the theory of CO2 relationship with global warming was incorrect? Has anyone identified an experiment that could possibly show that? Is there anyone running experiments that could say the theory is wrong? It seems to me that the anthropogenic believers don't waste their time looking. It's not science any longer. It's now a belief and almost a theology. The post about Foster and Rahmstorf 2011 looks interesting, but I need to get the original article and try to understand it a lot better. From the "moving" curve posted by Dikran Marsupial. it appears their starting data was very similar to the UAH curve I started with, but they extracted out all the other effects. I hadn't seen this article and it looks interesting. As a general comment, it is very interesting that when Temperature was rising, it was used as the evidence of global warming, but now that it looks like that trend has flattened, all of a sudden, we need to find a new way to prove that our original theory still holds. You're not supposed to start with the answer and then search for some data that matches the answer. As I said in my post, I was intrigued by the thought that heat content is probably a better way to look at global warming. However the NOAA chart I showed in my post seems to say that it's recent trend has also flattened . You commented a) Don't use short trends. b) Don't assume that because the simple observations are noisy that you can't extract a clearer signal from the data. c) When you do look at the signal, and you also consider the complexity and other factors in the system, everything makes sense. d) Read and learn more before you adopt a position. I try not to use short term trends, but I also try to not to ignore the short term trend that doesn't fit the model, unless I can find a cause that was not in the model. Then I try to fix the model to include that effect. Why is there no global temperature or global heat content response to increasing CO2 over the last 10 years. Who in the IPCC is trying to answer that question? I can accept noisy data. What I can't accept is a 15 year set of data that is cyclical, but around a relatively stable mid-point demonstrating the low end and another similar set at a high mid-point being considered the high end and then having straight line being drawn between them. That is not good data interpretation. The correlation coefficient of a linear fit from 1979 to 2012 can't be very good - even if you ignore the El Nino and Mt Pinatubo anomalies. I can accept that the complexity of the system makes it hard to interpret. I will seriously try to understand Foster and Rahmstorf , but I would much prefer to add all those exogenous effects into the model rather than trying to extract out the trend I was looking for to find an underlying trend. Data manipulation can lead the most sincere analyzer to put his biases into the manipulation. Finally (to Sphaerica) I am trying to learn as much as I can before adopting a position. My present position is that I don't have one because when I look I can't find "settled science". i'm not saying that there is no relationship. I'm saying that I can't see it in the data that I can find. To michael sweet, I agree with you that an eyeball fit is certainly not as precise as a good statistical fit. I got lazy. I can't disagree with you that the data might have a slight upward drift. But all the statistics in this world would not show the data from 1979 thru 1996 having a trend that would lead to a midpoint that is 0.3°C higher by the 2002 until 2012 period. If I have the time, I'll try to extract the data and verify how good my eyeball is, but I can't believe that it will lead to a different conclusion. You can only get a different conclusion by including the latter data and trying to fit these two totally separate data sets with a single line. Has anyone tried checking to statistically see whether these two sets of data (1979-1996 and 2002-2012) are likely to be from two totally separate data sets? To muoncounter and DSL Just because you don't know the physical mechanism, doesn't mean there wasn't one. If Einstein had looked at his data that way, he would never have come up with Relativity. Keplar 's would have been happy with the "known' model and never come up with ellipses for the planetary orbits. Since we know it's hotter and we know that CO2 is increasing and we know that CO2 is a global warming gas, we seem to have a definitive causal relationship. It seems to me that the AGW folks are using the the classical, " If the only tool you have is a hammer, everything looks like a nail." I refused to go to the graduate school that had the Philosophy that no experimental result was confirmed until you have a theory. That's nonsense. If the experiment is unbiased and data reduction is done without bias, then you cannot honestly discard the conclusions it leads to just because you don't understand the physics of might have happened. I agree that CO2 is a global warming gas, as are water vapor and methane and others. And clouds act as global coolers. The physics response of doubling CO2 calculated to about 1°C global temperature rise. It is only because of the projection models, with their assumed feedbacks, that leads to gloom and doom of 6° increases. How is the data we are discussing here consistent with that? Do any of these model predict what we have seen from 2002-2012? To Dana I need to spend a lot more time with the post that you described, but a quick glance seemed to once again be rationalizing how this result could occur, even if the answer that was posed was still correct. I can't buy continual rationalization. There was also a comment that the poster didnt' t like a lot of the data sets used that discussed the potential of a step change in Temperature. Well....what is the data set that everyone is willing to accept? Is there one? I've been following the UAH data for the last 10 years. When I started, I didn't notice the flat period from 1979-1996 and only saw the higher levels in the post-1998 period. Since then, temperature has been higher, at an apparently fixed level (with cyclical variations around it). What I want to know is, " how is that consistent with steadily increasing levels of CO2 causing increases in global temperature?" To Dikran Marsupial, Your curve without the El Nino anomoly makes an interesting point. I blocked out that region when I did my visual analysis in an attempt to not bias my eye. By any chance has anyone done a Student-t analysis of the data from 1979-1996 versus the population from 2002-2012 to see whether they appear to be data from the same population? Finally, Dikran, how did you have the two sets of curves flip up and back on your post. That's a great tool. Is this from the analysis of Foster and Rahmstorf ? I'm concerned about manipulating the heck out of data before trying to interpret it, but it is a worthwhile venture to try to find an underlying trend. I would be very interested in trying to understand what the causes of cooling were that masked the steady increase in temperature caused by CO2. Thank you all for you inputs, I will stay on my search DaveModerator Response:[DB] "Why is there no global temperature or global heat content response to increasing CO2 over the last 10 years."
Incorrect. Numerous posts exist on this website debunking this meme (this site's search function will reveal many). Multiple datasets covering your timespan all show no statistically significant deviation from the well-established long-term warming trend.
Participants, Dave has posted a very long comment with multiple areas of focus that are better covered on other threads. Please take those individual discussions to those more appropriate threads lest we deal with a dogpiling response to a gish gallop. Thank you in advance.
-
Composer99 at 12:12 PM on 17 May 2012Richard Alley's Escalator
As usual, Dr Alley does a great job. -
skywatcher at 10:50 AM on 17 May 2012Medieval project gone wrong
#56, afraid I'm choosing to remain anonymous for the time being, for my own reasons, but my example is hardly unique amongst the papers on CO2science. -
PT_Goodman at 10:24 AM on 17 May 2012Medieval project gone wrong
50, skywatcher I'm interested in which paper of yours is described, with results misrepresented, at CO2 Science. TIA -
Bob Lacatena at 09:09 AM on 17 May 2012Medieval project gone wrong
54, koyaanisqatsi, That's why they are not, in any reasonable sense of the term, "skeptics." -
Tom Curtis at 08:49 AM on 17 May 2012CO2 has a short residence time
Martin A @114, does your two-box model include a term for ongoing volcanic emissions of CO2, or does it tacitly assume that all volcanic activity ended with the onset of the industrial revolution? -
Tom Curtis at 08:41 AM on 17 May 2012IPCC graph showing accelerating trends is misleading
Helena @119, as the graph was not present in the first and second drafts, it was obviously added in response to comments on the second draft (see section 4.2.5 of the IPCC procedures). As such revisions are explicitly described in the procedures, such revisions are part of the the full IPCC review process. Following that revision, the final draft is voted on and adopted by the panel (section 4.4). For the graph to not be a product of the full review process, it would need to have been added after adoption by the panel, a claim you have no evidence for. As it stands, a brief skim of early pages of the second round of review shows at least two reviewer comments that may have suggested to the lead authors the need for the revision. In particular, the reviewer for the US Gov suggested "more discussion of better characterized shorter period trends" (3.34), and the reviewer for the Australian government suggests that using simple linear trends obscures important details. (3-11) While neither reviewer requests the specific modification made, the addition of the shorter trend lines to the graph would certainly help satisfy each reviewers stated concern. Regardless, the issue here is whether or not an unjustified inference is made from the chart, and as clearly and repeatedly demonstrated above, it has not been. In contrast, Monckton not only makes unjustified inferences from his alternative chart, but grossly distorts the data in the chart to begin with. -
skywatcher at 08:18 AM on 17 May 2012IPCC graph showing accelerating trends is misleading
Helena is that the best you can do? Nothing quantitative, no analysis, and a request that others should go away and do work for you? I think, from this, we can safely say that Helena has nothing to add to this discussion. -
Piet R. Zijlstra at 08:00 AM on 17 May 2012Richard Alley's Escalator
How can we count the number of people who change their mind after seeing this video? I will help!! Pieter -
KR at 07:37 AM on 17 May 2012CO2 has a short residence time
Martin A - You might want to look at some of the earlier discussions of this topic, such as Bolin and Eriksson 1958, where this theory is discussed/developed. You might also be interested in looking up the Bern model, also here, which was supplied to IPCC researchers for (relatively simple) mid-term carbon cycle modeling. Generally speaking, a two-box model will not be sufficient to examine ocean sequestration. The Bern model (not the most complex out there) uses one atmospheric box, four ocean boxes, plus an additional four for the biosphere. -
funglestrumpet at 07:14 AM on 17 May 2012Climate Change Consequences - Often Unexpected
Doug H @ 6 From what I can see we are already at Peak Oil, or rather the plateau at the top before the decline. The important point is that supply is only just keeping up with demand while the developing economies are building and buying more and more cars and other products which use oil, which can only exacerbate the situation. (China now buys more cars each year than America does.) An IMF research team is now warning of $220 oil per barrel by 2020, so I guess we will soon find out what happens when people cannot afford the stuff. As for unintended consequences, catastrophic collapse of food production might be another. It is obvious that growing regions will move polewards or upwards as the climate warms, indeed it is already happening. We can analyse the matter scientifically. If we plot food production on the ‘y’ axis of a graph, and put time on the ‘x’ axis, we can put rate of change on the ‘z’ axis. If this graph follows Catastrophe Theory, then we can expect a sudden and dramatic collapse in food supply to occur as part of the process. Perhaps not all crops, and not those that do collapse all at the same time, but catastrophic nonetheless. We might adapt to a gentle change, but hardly the almost complete loss of a staple food. Perhaps this has already been studied and all is well. But if it hasn’t, one wonders if those that are so opposed to taking action to combat Climate Change realise the magnitude of the risk they want us to take. -
Martin A at 06:31 AM on 17 May 2012CO2 has a short residence time
"Individual carbon dioxide molecules have a short life time of around 5 years in the atmosphere. However, when they leave the atmosphere, they're simply swapping places with carbon dioxide in the ocean. The final amount of extra CO2 that remains in the atmosphere stays there on a time scale of centuries." Can you let me have a reference where I can look this up please? When I write down the differential equations for a simple two-box model, with an injected mass of CO2, in addition to an ongoing equilibrium exchange between atmosphere and sink, the result I get does not agree with your explanation. I want to resolve the difference. -
PT_Goodman at 06:20 AM on 17 May 2012Medieval project gone wrong
Thanks for the responses. The AGW skeptic in question claims to have read all--give or take--research papers. But when I pin him down on what any particular research paper actually concludes, he always provides links to CO2 Science and/or WUWT rather than to the supporting paper itself. I end up locating the article in question and provide him with a link, but he will not read it. he has no technical background, so it is no doubt difficult for him to comprehend most papers. That may make it necessary for him to depend on AGW entertainers (Limbaugh claims it be "just an entertainer" as will) such as Anthony Watts. There is a dishonesty to his debating. You can't debate someone who is not interested in the truth, someone who believes what they believe because they believe it. I think I'm probably done with him. -
Helena at 03:49 AM on 17 May 2012IPCC graph showing accelerating trends is misleading
Tom : "The more interesting point is, was the graph a product of the full review process, and quite plainly it was." I cannot find any review comment asking for any kind of change to the original graph. I obviously cannot prove that i cannot find any, as it is impossible to prove a negative. Can you therefore provide me with any review comment(s) that would suggest that the final graph is "the final product of the full review process" ? Thanks. -
chriskoz at 00:19 AM on 17 May 2012Climate Change Consequences - Often Unexpected
Good point raised in this article. Thanks dana and Molly. I think more alike points will be raised in future. I begin to realise that our adaptivity to changing climate as the society is far smaller than our adaptivity as individuals. Deniers don't understand that: they will keep saying "1 or 2 degrees, no big deal, I can deal with that...". However, a society is as fragile as the echosystem within which it lives... I am waiting for more evidence of that type of vulnerability, which would eventually convince the contrarians that climate change is real and will affectr them, just like smokers are convinced that lung cancer is real and affects them (as the overal group, even though some narcistic individuals think they can escape it). -
heijdensejan at 23:12 PM on 16 May 2012Medieval project gone wrong
CBDunkerson: Even with their deliberately biased results they still have a problem as some regions are warm around the year 1000 and others around the year 1300, from some they only use one proxy and other proxies in the same report show something completely different etc. etc. Also they do have a spacial issue as some regions are under represented. I'm sure they have tried one time or another in the past and the result might not have been "satisfactory" I'm also amazed that people "believe" them immediately and without any scepticism. -
Bob Lacatena at 22:59 PM on 16 May 2012IPCC graph showing accelerating trends is misleading
This alone should be clear evidence of Monckton's ability to accurately present data. Compare his hand-drawn graph in Tom's comment to these... using the exact same time frames, with both the HADCRUT and BEST data. It should be noted that the GISTEMP data cannot be used, because they don't go back prior to 1880, deeming the data before 1880 to be to unreliable to use.
 Here is the same graph with one more trend added, for 1979 to the present...
 [Click on each to go to the original woodfortrees.org plot]
Honestly, how can anyone trust his interpretation of the data when it is as sloppy as this?
[Click on each to go to the original woodfortrees.org plot]
Honestly, how can anyone trust his interpretation of the data when it is as sloppy as this?
-
muoncounter at 22:57 PM on 16 May 2012It's cosmic rays
Move over, galactic cosmic rays! Bring on the 'blazars:' ... black holes can emit high-energy gamma rays and are then called blazars. ... This particular radiation interacts with the optical light that is emitted by galaxies, transforming it into the elementary particles electrons and positrons. Initially, these elementary particles move almost at the speed of light. But as they are slowed down by the ambient diffuse gas, their energy is converted into heat, just like in other braking processes. The process of converting electron/positron kinetic energy into heat by 'braking' seems a bit mysterious. But have no doubt, the 'ABC' crowd will spin this into their next version of 'the answer.' -
CBDunkerson at 21:26 PM on 16 May 2012Medieval project gone wrong
heijdensejan, obviously the problem is that no reputable scientific journal would publish the 'CO2Science temperature record' because, even ignoring the fact that the papers are misrepresented, they have specifically picked out only papers which show 'temperature increases' (though some are things like rainfall changes which they falsely claim to be temperature increases) around the time of the MWP. In short, they are deliberately biasing their results. Frankly, it always amazes me how many people can look at their collection of '100% warming data' and not immediately realize what a sham the site is. -
heijdensejan at 18:49 PM on 16 May 2012Medieval project gone wrong
If the MWP was indeed warmer then today and the "evidence" shown by CO2Science would actually support this, then McIntyre should make a multi proxy analyses from the data and publicise this in a scientific journal (not E&E). The Idso's are already funded by Heartland, the data is already selected and gathered so the job to compile a global multi proxy analyses should not be to big / expensive. As they have not done so, it is clear that either they are not interested, or the outcome would undermine their conclusion. Of course then they would also have to face the fact that a warm MWP would also mean a high climate sensetivity -
missk at 17:32 PM on 16 May 2012World Energy Outlook 2011: “The door to 2°C is closing”
Hi, I'm in a college Environmental studies class and for the term paper I wanted to write about Geothermal Energy and why my city should make the switch. Is there anyway to calculate seattle wa's current use of energy (which is hydropower) and see what the prediction of environmental damage avoided and money saved if we made the switch to relying on Geothermal 20 years from now? I'd appreciate any resonses, Thanks K -
Arnost at 15:18 PM on 16 May 2012Tiljander was flipped upside down
No it wasn't. McIntyre is incorrect. -
skywatcher at 14:30 PM on 16 May 2012Medieval project gone wrong
koyaanisqatsi, you are quite correct that CO2science misrepresents the results of papers in their database. Apart from the OP, I can say this from personal experience, as there's a paper of mine in their database, conclusions suitably misrepresented. The paper documented an observed warming of climate, CO2science suggest that this immediately means the climate is 'returning to normal' so there's nothing to worry about!! The paper actually made no discussion of the forcings involved (climate needs a forcing to change), and climate's not a pendulum, desperate to stay in one place, that will swing the other way when nudged one way. I asked them to remove the paper from their database, you can guess the result of that... -
KR at 13:46 PM on 16 May 2012Climate Change Consequences - Often Unexpected
I seem to remember the same issues in Pittsburgh, PA, in the 1980's-1990's - older sewage systems that shared overflow with storm drains, resulting in river pollution when overstressed. Just a fact of life for older drain systems - but unfortunately affected by changes in precipitation. Change always affects more than you expect, plus and minus - because nobody has a good grasp on all the side effects. -
scaddenp at 13:27 PM on 16 May 2012Medieval project gone wrong
As far as I can see CO2 science depends on people believing their representation of the science papers, secure in the knowledge that their audience will not actually read the papers. Get him to actually read the papers instead. However, as to changing the mind of someone desperately looking only for confirmation of a bias, then good luck. We are all guilty and the only good trick we have against the bias is science. You could ask what data would change his mind. If he can imagine no data that would do that, then dont waste your time. -
Composer99 at 13:06 PM on 16 May 2012Climate Change Consequences - Often Unexpected
Pertinent to the points raised by Steve Case & dana1981, Skeptical Science has one or more posts discussing the ecological impacts of global warming in which a graphic is shown with relative current and projected future weight of global warming and other concurrent impacts. All of these impacts, of course, are in action at the same time, meaning that each is a 'force multiplier' of the others. The impression I get from such articles, which is an impression that crosses into the impact of global warming on weather and economic affairs, is that much of the damage from global warming is not really a result of its direct effects, but rather from its action as a force multiplier of other, concurrent events. The Moscow heat wave in particular springs to mind as an example. -
DSL at 12:58 PM on 16 May 2012Climate Change Consequences - Often Unexpected
colinc, whatever other reasons there may be, the use of all-caps is also an accessibility issue.
Prev 1197 1198 1199 1200 1201 1202 1203 1204 1205 1206 1207 1208 1209 1210 1211 1212 Next


