


 Arguments


Recent Comments
Prev 1199 1200 1201 1202 1203 1204 1205 1206 1207 1208 1209 1210 1211 1212 1213 1214 Next
Comments 60301 to 60350:
-
lurgee at 06:24 AM on 15 April 2012Shakun et al. Clarify the CO2-Temperature Lag
"The geological/climatological community has known from the very inception of polar research that the data collected there would not be fully representative of the global system - there is no one place on earth that is fully representative of the climate system." That was rather my point, as I recall. Someone had made a comment about the vexacious lag issue, based on the Vostok (?) ice core. I pointed out to him that this was a single proxy, and you couldn't read too much into what it showed, unless it was confirmed by other sources. I suggested what an individual core showed might be global trends, local trends, or just 'noise.' This seemed to provoke an unwonted amount of ire, and it was assumed I was trying to dimish the utility of ice cores themselves. Not so. Now it turns out that 93% of the interglacial temperature increase followed the CO2 increase - something that had previosuly been obscured by focusing (understandably) on Antarctic ice cores, which were among the 7% where the temperature increase preceded the CO2 increase. CO2 as a potent GHG confirmed! Forgive me for feeling slightly vindicated. I'm only (semi) human. I might occasionally use language loosely - I accept, with hindsight, 'unreliable' has very different connotations to 'not necessarily an accurate global estimate' though my intented meaning was similar - but my contention seems to be borne out. But then, I did point out that I'm not a scientist.Moderator Response: TC: The "Lurgee was right/wrong" debate is off topic on this thread. If you want to continue it, you can argue the science where the original comments where made. Future comments on Lurgee being right or wrong will be deleted. You are of course free to raise science issues discussed by Lurgee and Antagonists here provided they are relevant to the OP, and your discussion makes it clear how they are relevant. -
Alex C at 06:14 AM on 15 April 2012Why David Archibald is wrong about solar cycles driving sea levels (Part 1B)
@D_C_S #18: Got to love it when errors are pointed out after publication, rather than before :-) You are correct, the slope is found by dividing by the variance in the independent variable, hence ∑(x_i - x_bar)^2, not y. Horribly sloppy on my part, having a hard time believing that I did an entire post based around the same concept and mistake. I will make the change. In case anyone would like a good source I found informative and fairly easy to read, this helps explain the concepts I've covered, and gives the equations: http://www.edwardtufte.com/tufte/dapp/DAPP3a.pdf -
D_C_S at 05:32 AM on 15 April 2012Why David Archibald is wrong about solar cycles driving sea levels (Part 1B)
The points (x,y) = (1,2) & (3,6) are on the line y = 2 x. I put these points into the formula that you gave for m, which resulted in a value for m of 1/2 instead of 2. You must have your X's & Y's switched in the formula if you are looking for an equation of the form y = m x + b. -
John Hartz at 05:18 AM on 15 April 2012NASA Climate 'Skeptics' Respond with Science! Just Kidding.
Per usual, Andrew Revkin tries to occupy the “middle ground” with this post: “On Astronauts, NASA, and Climate Concerns” by Andrew Revkin, DOT Earth/New York Times, Apr 12. 2012 According the grapevine, Revkin is taking a considerable amount of flack from the residents of Deniersville over this one. -
John Hartz at 02:47 AM on 15 April 2012NASA Climate 'Skeptics' Respond with Science! Just Kidding.
Lots of the “right stuff” in this article as well. “From a Boy Who Loved NASA: How 49 Heroes Lost the Right Stuff and Sullied Their Names” by Shawn Lawrence Otto, Huffington Post, Apr 13, 2012 -
Michael Whittemore at 02:18 AM on 15 April 2012Shakun et al. Clarify the CO2-Temperature Lag
I know its not a big deal but I feel sort of short changed with these proxy's, due to the area-weighting. I do find it amusing that Willis Eschenbach at WUWT when talking about the Shakun paper never averaged the proxy data because he knew unless he area-weighed them he would not get the same data as in the paper. -
dana1981 at 02:10 AM on 15 April 2012Shakun et al. Clarify the CO2-Temperature Lag
lurgee @89 - we never said that ice cores are unreliable. Quite the contrary. They are, however, only representative of a single location. -
kingofaces at 01:55 AM on 15 April 2012Why David Archibald is wrong about solar cycles driving sea levels (Part 1B)
Timely article considering I've been dealing with using regression for model evaluation of observed and predicted variables in a paper I'm working on publishing. Albeit regression doesn't provide a singular statistic to indicate performance while validating a model (check out concordance correlation coefficient instead) it's funny just how often people mix up the axes, but actually end up being correct in their "mistake". It all depends on what you're working with though. It's a topic most people just skim over. Anyone with journal access might want to give this paper a read if this topic is interesting them: Piñeiro et al. 2008. How to evaluate models: Observed vs. predicted or predicted vs. observed? Ecological Modelling: Volume 216, Issues 3–4, 10 September 2008, Pages 316–322. The issue of "predicted vs. observed" doesn't pertain to what Archibald was doing from what I can see, but the article demonstrates how a lot of the topics work that are being hit on here. -
John Hartz at 01:36 AM on 15 April 2012NASA Climate 'Skeptics' Respond with Science! Just Kidding.
Suggested reading: “49 Cliff Clavins Walk into a Bar and Talk Climate Change” by John Abraham, DeSmoig Blog, Apr 13, 2012 -
danielc at 01:08 AM on 15 April 2012Shakun et al. Clarify the CO2-Temperature Lag
@lurgee: "Unreliable" is a very different animal from "not necessarily an accurate global estimate"... Climatologists, glaciologists, chemists, geologists and really any plain old geologist trying to understand large scale phenomena by piecing together evidence from individual locations knows that 1 site is not representative of a global system. The geological/climatological community has known from the very inception of polar research that the data collected there would not be fully representative of the global system - there is no one place on earth that is fully representative of the climate system. The polar data is extremely reliable: it is repeatable, you can find the same signals, trends, and local maxima/minima from core to core and from site to site across large distances, both arctic and antarctic. It is also extremely reliable in that there is strong, repeatable, and independently testable correlation and internal consistency between individual measurement systems: dust vs bubbles vs layer thicknesses vs isotopic records vs nearby seafloor sedimentary records. These have been put together and independently replicated numerous times. The ice core data is not unreliable... it is also not fully representative... that's why the Shakun paper is so good - because it incorporates records of similar extent and resolution from regions that encompass disparate subsystems in the global climate over relatively long periods of time. Shakun et al extend, rather than disprove or degrade or displace the existing polar records. -
Michael Whittemore at 23:52 PM on 14 April 2012Shakun et al. Clarify the CO2-Temperature Lag
@ Daniel Bailey 90 I think this Comment sums up lurgee's view on proxy data: "So feel free to provide evidence that the experts regard the ice core record as 'clean' and relaibale, rather than a confused, torturous mess which, unfortunately, happens to the best we've got, and ever will get." -
NileQueen at 23:46 PM on 14 April 2012Catching up with the Younger Dryas: do mass-extinctions always need impacts?
When you've had megafauna come through many other glacial/interglacial transitions but they don't make it through this one, something is different. I'll be watching for more developments on that Gulf of St. Lawrence crater. That is in the vicinity of where the ice sheet would have been 12,900 years ago. If other impactors hit the ice sheet, the ice would absorb a lot of energy and you might not retain evidence of an impact. -
Daniel Bailey at 23:17 PM on 14 April 2012Shakun et al. Clarify the CO2-Temperature Lag
"I said about the unreliability of ice cores a while back and got ripped to pieces for it" Actually, from your very first comment in this forum you made unsupported assertions that displayed an uneven level of understanding about a number of topics. You then attracted more attention to yourself by employing rhetoric to deride the comments of others in response to you, rather than responding with sourced supportive links (you attacked the commentators rather than the arguments). WRT the issues raised in the OP, you are repeating the same inadequate understandings of issues now as you did then. The ice core records were the best overall record we had. Shakun provides a new reconstruction that is even more global than the ice core records. This does not invalidate the ice core records in any fashion whatsoever. It improves our understanding of things, not detracts from the validity of the cores. That is how science works, as opposed to rhetoric. So the world of science will not be coming around to your way of thinking. -
shoyemore at 17:37 PM on 14 April 2012Why David Archibald is wrong about solar cycles driving sea levels (Part 1B)
Alex C & Stephen Baines Thanks for the clarifications. No issue here. -
lurgee at 16:49 PM on 14 April 2012Shakun et al. Clarify the CO2-Temperature Lag
"The key to this myth is that it's based on Antarctic ice core records, which are not necessarily an accurate representation of global temperatures." I said about the unreliability of ice cores a while back and got ripped to pieces for it ... Glad to see the world is - slowly - coming round to my way of thinking. -
Stephen Baines at 16:43 PM on 14 April 2012Why David Archibald is wrong about solar cycles driving sea levels (Part 1B)
Alex C, I wouldn't overthink this. OLS will provide the best linear model if the aim is to simply predict Y from X, even in the presence of error in X. Where error in X rears its ugly head is when you want to compare the slopes in the OLS model to some theoretical expectation. Such theoretical expectations assume that you know the x variable precisely. The OLS slope will therefore be biased low compared to that theoretical slope. If we know the error variance in X (the variance associated with measuerement error), the bias in the slope can be calculated from the ratio between the error variance in X and total variance in X. -
Michael Whittemore at 15:50 PM on 14 April 2012Shakun et al. Clarify the CO2-Temperature Lag
William Haas @86 I am going to put it in a more simply way and see what you have to say. The orbital warming only happened in the far north at first, shown in figure 5. The initial warming is caused by the sun and all the feedback's that occur when there is an added forcing. With the onset of the seesaw, both 30-60N and 60-90N start to cool while all of the other latitudes start to warm. With H2O only being a short time GHG that does not mix as well as CO2, H2O can not explained the increased warming seen in the far north. Due to the north's temperature increase lagging CO2 and the fact that the (AMOC)was not causing any warming up there, H2O can only really be seen as a regional short term positive feedback that could not have caused a global warming as is seen. I personal think that if CO2 was not the powerful greenhouse gas the science community has shown it to be, then the (AMOC) would simply had come back on when the northern regions cooled enough. But due to them following CO2 increase (as expected) the (AMOC) could not be brought back on. -
Tom Curtis at 15:20 PM on 14 April 2012Shakun et al. Clarify the CO2-Temperature Lag
William Haas @86, I need to correct a major error in my post at 73. I initially, and correctly stated that the the total GHE at the LGM drops from 152.6 W/m^2 to approximately 120 W/m^2. I then had a "brain fart" and treated the 120 W/m^2 as the drop in the GHE, whereas the proper value is approximately 30-40 W/m^2. Fortunately the error effects nothing in the analysis. On the contrary, the figures make much more sense once the error is corrected. Regardless, I do apologize for the error. I will take advantage of my moderator status to correct the error so that readers of this thread are not confused by it. Turning to your major point (2nd paragraph) first, any increase in temperature will result in an increase in H2O concentration and hence a water vapour feedback. So you are absolutely correct that H2O contributed to the initial warming, and indeed to the total warming from glacial to interglacial. It contributed along with other feedbacks by strengthening a relatively weak forcing (GHG plus Ice albedo) that would have only caused a change in global temperature of about 2 degrees C so that the change was at double to three times that. The key point that other people are disputing is that it only contributed as a feedback. Absent the change in CO2 levels and ice sheet albedo, the water vapour feedback could not have prevented tempertures relapsing back to the LGM average once the Milankovitch forcing passed. So what you are looking at is the Minkovitch forcing causing the minor melting of NH ice sheets and a small rise in temperature, which leads to an increase in the water vapour (and other short term feedbacks) which leads to a stronger response in long term feedbacks such as GHG levels and Ice Sheet Melt which switches the Earth to a new stable climate state. Without the short term feedbacks, the long term feedbacks would not have been strong enough to make the switch. But without the long term feedbacks, the short term feedbacks would not have been stable enough to sustain the switch. Consequently climate scientists concentrate on the effects of the long term feedbacks, which can be treated as forcings for determining climate sensitivity when comparing the LGM to the Holocene. Note that it certainly is not the case that the initial water vapour response can feed back itself to bring about the glacial to inter-glacial transition. I, probably mistakenly, have understood you to be suggesting that it can. The suggestion that it can leads, however, to absurd conclusions. Specifically, it means the water vapour feedback is already strong enough to trigger a runaway global warming, which we know is not true. On minor points, the greenhouse effect is not constant at all latitudes, and in fact decreases in strength towards the poles. This is partly because the strength of the GHE is a function of the difference in temperature between the emitting GHG and the surface, and the fact that at the effective altitude of radiation for CO2, there is a much smaller temperature difference between equator and pole than there is at the surface; and partly because of the reduced H2O concentrations as you approach the pole. What does increase as you approach the poles is the ratio of greenhouse warming to insolation, which is why increasing GHG result in a reduced temperature differential between equator and pole. Note that the strength of the greenhouse effect does not depend directly on the total insolation, but only on the temperature difference between different levels of the atmosphere, and the GHG concentration at those altitudes. As to the approx 4 W/m^2 difference in CO2 forcing between LGM and late 20th century, it is small, but so is the percentage change in global temperature (1%). However,though a small change of temperature on the absolute scale, it was a massive change of temperature for human and ecological consequences. -
Alex C at 14:26 PM on 14 April 2012Why David Archibald is wrong about solar cycles driving sea levels (Part 1B)
@Tom Curtis #13: Deming regression from what I can tell can be performed using knowledge of the ratio of variances between the datasets, which I don't know and which I am unfamiliar with how to coax out of cyclical - yet uneven - data as sunspots. There is also an issue with the sea level trend data and how it was processed, the 10-year moving derivative amplifies a frequency range in which the solar cycle frequency (~0.9) lies, so I don't know if I could apply the same sort of methodology to sea level as I could to solar. Whatever that methodology is anyway. As to how it would change it, if we do assume for a minute equal variance (due to how we don't know the variances), then the residuals should be minimized perpendicular to the line, in which case the result is hardly different at all from the conventional method. I think my analysis above holds, but I'd be happy to hear from someone with more experience on this. -
William Haas at 13:58 PM on 14 April 2012Shakun et al. Clarify the CO2-Temperature Lag
Wow, so much response. Sorry for the delay in responding but I have been off doing other things. I really appreciate the effort that everyone has been putting in. Let me comment a little bit at a time here. 73. Tom Curtis. So you are telling me that in the year 2000 the CO2 contribution was 31 watts per square meter and at the last glacial minimum it was 27 watts per square meter. That does not seem to be much of a change. according to your chart at 22 below zero degrees f there will be essentially no water vapor in the atmosphere. Temperatures at places on the glacial surfaces may have averaged 22 below zero or less at the last glacial minimum. Of course that was not the value over the entire globe. So over the ice sheets at LGM, H2O in the atmosphere may have been almost zero yet there was always a non zero amount of CO2 providing a green house effect of 27 watts per square meter. I understant that if the input from the sun was less then than it is today then the 27 watts would be less From the discussion of the paper, the effect of the Milankovich cycle started 19,000 years ago but CO2 was not recorded to have started to rise until 2,500 years later after 7% of the temperature rise had taken place. Yes I think I understand the orbital effects. Because of all these orbital and geometry effects solar irradiance on parts of the earth gradually get more or less and the effects occour over centuries and mallena and not over just a few years. This is assuming that there are not any really long term changes in the sun's output that we do not know about. Apparently during this first 2,500 years some ice statred melting so I assume that there were ice sheet surface temperatures above -22 degrees f. Of course H2O will enter the atmosphere through sublimation so H2O can enter the atmsphere at temperatures even below freezing. At the last LGM a large portion of the earth was covered by either water or ice and that either are a source of atmospheric H2O. Weather effects are another factor effecting average levels of H2O It is hence plausable that during the first 2,500 years since the LGM as the ice sheets started to melt and as the atmosphere started to warm that average H2O in the atmosphere increased. Since H2O is a green house gas, more of it in the atmosphere would have added to warming. Of course at the LGM only part of the earth was covered with ice so the global level of H2O in the atmosphere was never zero but over the coldest parts of the ice sheets it was really probably quite low. CO2, on the ohterhand was most likely evenly distributed. So during the first 2,500 years after the LGM if not just the GHE but a change in the GHE contributed to global warming it would have been due to H2O because H2O levels most likely changed but according to the data CO2 did not. Where am I going with all of this? No, nothing sinister. So far we are talking about just the first 2,500 years since LGM I will comment further. -
Tom Curtis at 12:56 PM on 14 April 2012Why David Archibald is wrong about solar cycles driving sea levels (Part 1B)
Alex C @12, yes, the compensation (10 times multiplier on groups) and K are the fifth and sixth potential sources of error. I finally manage to find an error stated on the sunspot number, +/-5% (see page 2 of the bulletin) I assume that if the error on the independent variable is small compared to that on the dependent variable, OLS will still provide a good estimate. On the assumption that that is not true, does Total Least Squares Regression assume approximately equal percentage error for both variables, or is it independent of the error? Further, how would using TLSR effect your analysis above? And finally, what form of regression did Archibald actually use? -
Tom Curtis at 12:33 PM on 14 April 2012NASA Climate 'Skeptics' Respond with Science! Just Kidding.
jmsully @47,“An expert is someone who knows some of the worst mistakes that can be made in his subject, and how to avoid them”
vs"An expert is a person who has made all the mistakes that can be made in a very narrow field."
These sorts of quotes drift around and get massaged by different people (as can be seen by comparing our respective Bohr quotes, and the some/all switch in the Heisenberg quote), and often wrongly attributed. Without actually seeing the quote in one of their writings, which I have not done, it is near impossible to know the original version or the original source of the quote. Regardless of its accuracy as a quotation, however, I believe the version I originally quoted is the most accurate definition of an expert. The version I first encountered was the one attributed to Heisenberg. Assuming the attributions are accurate, I assume Heisenberg knew Bohr's saying, and modified it to be more accurate. Regardless of its provenance, however, it is the more accurate definition in that experts are at least able to learn from the mistakes of others. If they were not, each physicist would have start again the bumbling course of physics from the Greek atomists through Aristotle, Newton and on, and we would have no advance in science. In science you really do get to stand on the shoulders of giants. As an aside, I do not believe that Feynman would disagree with either Newton or Heisenberg. Experts make mistakes, without any doubt. It is just that they usually make interesting mistakes - mistakes that you cannot show to be a mistake without advancing scientific knowledge. If you assume that experts are making a mistake that can be realized with but a moments thought, you are only making a fool of yourself, and in the case of the climate change deniers, unfortunately, a very large proportion of the developed world's population. -
Alex C at 12:19 PM on 14 April 2012Why David Archibald is wrong about solar cycles driving sea levels (Part 1B)
@Tom Curtis #11: (I assume the compensation with the Wolf Number, and K, are the fifth and sixth potential sources of error?) Very informative, I was acting off a much more simplified understanding of sunspot collection and thus stand corrected. OLS assumes zero uncertainty in the independent variable, so perhaps a more appropriate form of regression would be a total least squares regression? From what little I understand of the issue, performing a Deming regression would be fairly simple. If I am not mistaken (and I might be), the result would be some middle ground between the Y|X and X|Y regressions, depending on the ratio of the variances in the variables. -
jmsully at 11:54 AM on 14 April 2012NASA Climate 'Skeptics' Respond with Science! Just Kidding.
Tom Curtis, Just for giggles I fed that quote into google both with and w/o surrounding quote marks. The closest hit I came up with is from Niels Bohr, as quoted (twice) by Teller: "An expert is a person who has found out by his own painful experience all the mistakes that one can make in a very narrow field" This is a great counter to the Feynman quote which the WUWT crowd is so fond of parading about: "Science is the belief in the ignorance of experts" -
william5331 at 11:35 AM on 14 April 2012Linking Weird Weather to Rapid Warming of the Arctic
This could be only a taste of what is to come. http://mtkass.blogspot.com/2008/07/arctic-melting-no-problem.html -
Tom Curtis at 11:16 AM on 14 April 2012Why David Archibald is wrong about solar cycles driving sea levels (Part 1B)
Alex C, the assumption that sunspot numbers do not have any error is incorrect. There are at least six difficulties with observing sunspots that can lead to error. The first, and most obvious is that sunspots on the far side of the Sun cannot be observed. The period of solar rotation is 23 days in mid latitude regions, while sunspots can las from "just a few hours" to months, with the longest lasting "about six months". Therefore some sunspots can appear and then cease to exist entirely on the opposite side of the Sun from the Earth, and hence be unobserved. The second is that sunspots are very varied in size, and in the brightness of their background making counting of a sunspot a matter of judgement, which of course may vary among observers. To illustrate this point, consider the sunspot group below: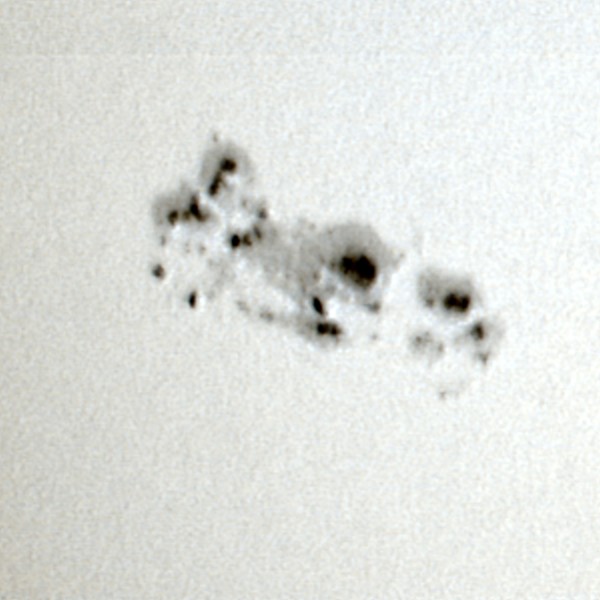 (Image from wikipedia)
Do you count only the very dark areas as sunspot, or the dark grey regions? If only the very dark areas (which is my supposition), or the larger dark grey areas? If the darker grey area, there will be significant issues of observability based on telescope quality. If the the very dark areas, do you count the the large extended region on the upper right of the group as one spot, because it is continuous , or as two because of the obvious necking between the left and right regions of the group? On a similar basis, do you count the long thin vertical dark region on the upper left as 1, 2 or 3 sunspots on a similar basis? Further, what of the very small dark spots on the within the darker background? Are they distinct sunspots, or just part of the general variation of darkness within that background?
Third, obviously the observational questions above are made more difficult for sunspot groups observed near the limb of the Sun, and also when observational conditions are poor due to weather (as sunspot observations are made by ground based telescopes).
Fourth, historically sunspot observations have not been complete. In particular, prior to 1849 up to twenty days may be missing from any given months observations.
To compensate for these issues, sunspots are measured by using the Wolf Number, which is K(10g+s), where g is the number of groups, and s is the number of sunspots observed.
g is multiplied by 10 because that is the average number of spots per group, but that is an obvious additional source of potential error when we take the Wolf number as a direct index of solar activity.
K is the "personal reduction coefficient":
(Image from wikipedia)
Do you count only the very dark areas as sunspot, or the dark grey regions? If only the very dark areas (which is my supposition), or the larger dark grey areas? If the darker grey area, there will be significant issues of observability based on telescope quality. If the the very dark areas, do you count the the large extended region on the upper right of the group as one spot, because it is continuous , or as two because of the obvious necking between the left and right regions of the group? On a similar basis, do you count the long thin vertical dark region on the upper left as 1, 2 or 3 sunspots on a similar basis? Further, what of the very small dark spots on the within the darker background? Are they distinct sunspots, or just part of the general variation of darkness within that background?
Third, obviously the observational questions above are made more difficult for sunspot groups observed near the limb of the Sun, and also when observational conditions are poor due to weather (as sunspot observations are made by ground based telescopes).
Fourth, historically sunspot observations have not been complete. In particular, prior to 1849 up to twenty days may be missing from any given months observations.
To compensate for these issues, sunspots are measured by using the Wolf Number, which is K(10g+s), where g is the number of groups, and s is the number of sunspots observed.
g is multiplied by 10 because that is the average number of spots per group, but that is an obvious additional source of potential error when we take the Wolf number as a direct index of solar activity.
K is the "personal reduction coefficient":
"A personal reduction coefficient K is calculated for each station. It has values typically in the range 0.4 and 1.7 and leads to a normalized sunspot number K(10G+S). In other words, the K factor rescales the raw sunspot counts of each observer to the ones of Rudolph Wolf, the astronomer who introduced the above Wolf formula, thus simulating the same eyes, same telescope and same conditions."
(Source) Although scaling by K is necessary for a consistent index, again it is a potential source of error. Despite the scaling for groups and the use of a personal reduction coefficient introduces potential errors, by compensating for the other factors above, I assume they result in a smaller overall error in the index. -
Daniel Bailey at 10:11 AM on 14 April 2012Linking Weird Weather to Rapid Warming of the Arctic
Another way to gauge Arctic Sea Ice is by looking at other assessments and metrics that are tracked by research organizations. For example, from Mercator Ocean we have: Arctic Sea Ice Thickness Bulletin Arctic Sea Ice Concentration Bulletin
 Arctic Sea Ice Drift Bulletin
 [Source]
By combining the first two we can see that the Bering Sea, Sea of Okhotsk, Chukchi Sea, Hudson Bay, Baffin Bay, Barents Sea and Kara Sea will all readily melt out by summer insolation max in late June or early July.
The East Greenland Sea will also largely melt out by then, except for ice being advected out the Fram (which quickly meets its doom in the relatively hot waters of the North Atlantic).
[Source]
By combining the first two we can see that the Bering Sea, Sea of Okhotsk, Chukchi Sea, Hudson Bay, Baffin Bay, Barents Sea and Kara Sea will all readily melt out by summer insolation max in late June or early July.
The East Greenland Sea will also largely melt out by then, except for ice being advected out the Fram (which quickly meets its doom in the relatively hot waters of the North Atlantic).
-
Stephen Baines at 08:42 AM on 14 April 2012Why David Archibald is wrong about solar cycles driving sea levels (Part 1B)
Alex C...A is the Y on X slope, so it should be lower that 1/(X on Y slope), no? No matter...I think we're just getting our A's and B's and our Y's and X's mixed up. In any case, the two are related via R2. And the mistake is clearly Archibald's...sorry about the confusion. And the typos! -
Stephen Baines at 08:20 AM on 14 April 2012Why David Archibald is wrong about solar cycles driving sea levels (Part 1B)
@_rand_ It's true that the difference between the (slope of Y on X)and (1/(slope of X on Y)) is correlated to the error in the slope. Just to be clear, though, that does not mean that either formulation is equally correct given. Archibald just gets it wrong. He first regresses Y on X and then uses that equation to predict Y from X. As long as there is significant error in the relationship OLS will never give you the right answer if you do that. shoyemore It would make sense to calculate the bivariate normal slope (its really only one slope that can be inverted depending on which variable is on the X and Y axis) if 1)you really though of this relationship as a correlation, where one variable really does not control the other and 2) you wanted to characterize an underlying central tendency between two related but otherwise independent variables. However, you would not then use that slope to predict Y from X. That is the specific purpose OLS was designed for - making the most precise predictions of Y given a value for X. It does so by finding a line that minimizes residuals for Y. As long as you don't predict outside the range of the original data, OLS will do fine. The bivariate normal slope, on the other hand, does not minimize the residuals for Y, and so is not the best predictor line. That's not really it's purpose though. In any case, what Archibald did was even worse. He ran the OLS regression of X on Y and then use to predict Y as if he has run it Y on X. That will always fail to produce an accurate prediction. You are predicting Y from a relationship that minimize errors in predicting X. It makes no sense. -
Alex C at 07:17 AM on 14 April 2012Why David Archibald is wrong about solar cycles driving sea levels (Part 1B)
Sorry, have been away from my computer for a while: @Stephen Baines #5: Perhaps you mean A/R^2 = 1/B (AB = R^2)? It is that equation that seems to work, when I multiply the CoD by A I don't get 1/B (e.g. 0.12501*10.575 ≠ 1/.0118). As to it being an error, were you referring to an error I made, or Archibald's error? Thanks for the FYI either way though, I assumed they were relatable but didn't know the simplified form to do so. @shoyemore: It's not clear that there's any uncertainty in sunspot counts, certainly not normally distributed uncertainty. As I said in the post, we can see sunspots and count them in realtime. -
shoyemore at 06:00 AM on 14 April 2012Why David Archibald is wrong about solar cycles driving sea levels (Part 1B)
FWIW, another way to treat this, since there is uncertainty in both X and Y, is to consider (X, Y) to be a Bivariate Normal Distribution, from which the slopes and conditional distributions (of Y|X and X|Y) would pop out naturally without explicitly using regression. The estimated slope of Y|X in the Bivariate Normal is Rsy/sx, the slope of X|Y is Rsx/sy (same as Stephen #5), where s* are the estimates of the univariate standard deviations of X and Y, R the estimated correlation (coefficient of determination). Wikipedia has a good page on the Bivariate Normal. -
_rand15_ at 04:29 AM on 14 April 2012Why David Archibald is wrong about solar cycles driving sea levels (Part 1B)
Another way to think about it is that the difference of the slopes is a good indication of the statistical error in the slope's value. If regressing one way gives a different result than regressing the other, there is some uncertainty in the slope value. This is essentially the same as @5, but seems more concrete to me. -
John Russell at 04:29 AM on 14 April 2012NASA Climate 'Skeptics' Respond with Science! Just Kidding.
Great blog post on this approach to denial: introducing 'TILT' (The Impressive Letter Technique). Love it! Includes a superb video of the world's ocean currents. -
Stephen Baines at 02:47 AM on 14 April 2012Why David Archibald is wrong about solar cycles driving sea levels (Part 1B)
Alex C, FYI. It's rather easy to show that the OLS Y on X slope (A) and the OLS X on Y slope (B) are mathematically related via the coefficient of determination (R2) according to A*R2 = 1/B. As the R2 approaches 1, the slopes become more and more alike. This is kind of an elementary statistics 101 error. I guess it is one that's easy to make if you are trying a bunch of different things. Still, it's something one should catch. -
Alex C at 01:55 AM on 14 April 2012Why David Archibald is wrong about solar cycles driving sea levels (Part 1B)
Gosh, a couple edits. Unfortunately my changes made to the post early on weren't reflected in later self-references in the post, so hopefully they're fixed now. Pardon the sloppiness in wording. -
Alex C at 01:44 AM on 14 April 2012Why David Archibald is wrong about solar cycles driving sea levels (Part 1B)
Frankly this was an issue that I didn't fully recognize at first. I had mistakingly regressed the conventional way when I had tried to recreate his own regression, and thought "interesting, why would one be better than the other?" but somewhat dismissed it because I wanted to go on to other topics. It wasn't until I started getting further into my research for these posts that it started to dawn on me that this was a pretty important concept, and that my initial question did have an answer. I think though that if one isn't being too careful, it's a mistake that is rather easy to make. -
Alex C at 01:39 AM on 14 April 2012Why David Archibald is wrong about solar cycles driving sea levels (Part 1B)
I updated the post to make a part early on (about minimizing vertical residuals, or dependent residuals) clearer; it was a change I had made to the structure of the post a few days ago, taking out some sentences, but apparently didn't fully mesh the two parts left over. @kiethpickering #1: I don't think so myself, at the very least for that reason but I don't think so nonetheless. His post tried to demonstrate that sea levels would fall, and whether that happened by -1.whatever mm/year or whether that happened by less (er, more? less in magnitude), it's still a fall. -
keithpickering at 01:19 AM on 14 April 2012Why David Archibald is wrong about solar cycles driving sea levels (Part 1B)
My guess: Archibald did it both ways, and chose the method that showed the larger "relationship" between sunspots and sea level. Then he got cagey about his language in the hope that nobody would notice. Nice job noticing. -
John Hartz at 01:17 AM on 14 April 2012NASA Climate 'Skeptics' Respond with Science! Just Kidding.
For another take on this matter, check out: “Letter to NASA is Common Ploy in Climate Change Denial” by Nancy Atkinson, Universe Today, April 12, 2012 Michael Mann, Gavin Schmidt, and Waleed Abdalati are quoted. -
Daniel Bailey at 00:20 AM on 14 April 2012Linking Weird Weather to Rapid Warming of the Arctic
Keep in mind, mercpl, that the ice you reference is seasonal, new ice (with some nilas ice mixed in) and historically will melt in its entirety (and rapidly, when it goes). Like the ice in Hudson Bay does. Bering Strait ice history Sea of Okhotsk ice history Hudson Bay ice history -
CBDunkerson at 00:00 AM on 14 April 2012Linking Weird Weather to Rapid Warming of the Arctic
mercpl, keep in mind that extent only requires 15% ice area... and says nothing about volume. If you look at the thickness and concentration of the ice it becomes apparent that the high 'extent' near the Bering straight currently is mostly just thin ice spread out by currents. Extent can fluctuate sharply based on (literally) a change in wind direction. -
mercpl at 22:22 PM on 13 April 2012Linking Weird Weather to Rapid Warming of the Arctic
Agnostic, Are you suggesting that warming due to methane emissions is localised? Spitsbergen and East Central Siberia clathrates melt and emit methane therefore Spitsbergen and East Central Siberia warm more. I would be surprised if the effect would be so localised. BTW, what's going on with sea-ice extent this year. Seems like a hell of a lot of ice hanging around south of the Bering Straight in the northern Pacific.

-
MarkR at 19:25 PM on 13 April 2012Data Contradicts Connection Between Earth's Tilt and the Seasons
They might have to snip out most of the content? It appears to support the idea of a round ball-like planet going around the Sun. Might hurt sales in some regions. :p -
MarkR at 19:19 PM on 13 April 2012Linking Weird Weather to Rapid Warming of the Arctic
#13 continuing RE: Antarctica... Sea ice in Antarctica is much less common in summer too. ~3 million sq km versus the ~8 million sq km that the Arctic started off with (although recently been dipping below 5 million) I think the Antarctic Circumpolar Current has also been implicated in 'insulating' parts of Antarctica (well, not like normal insulation, but as in moving heat away from certain areas), but my Antarctic knowledge is pretty weak. -
Dan Olner at 19:18 PM on 13 April 2012Linking Weird Weather to Rapid Warming of the Arctic
Daniel Bailey, comment 13: that's a fantastically intuitive description of the difference, thanks. -
Paul D at 16:58 PM on 13 April 2012Data Contradicts Connection Between Earth's Tilt and the Seasons
Yes, just had a quick search for the BBC Orbit series and it looks like it is only currently available in the UK (officially). There appears to be an episode on Youtube, but it isn't on the BBCs Youtube account so may not be there for long. It isn't clear if the BBC are trying to sell it globally. -
caerbannog at 15:20 PM on 13 April 2012NASA Climate 'Skeptics' Respond with Science! Just Kidding.
...by my count they include 23 administrators,...
OK skeptics, let's clear this up: This person is a climate-scientist:This person is *not* a climate-scientist:
Any questions?
-
Tom Curtis at 12:11 PM on 13 April 2012Eocene Park: our experiment to recreate the atmosphere of an ancient hothouse climate
If I can buy into the debate, Bernard J is seriously overestimating the pace of evolution. Human ancestors have been upright walkers for five million years but we still experience back problems. We have had children born with large crania for two million years, but mothers still die in child birth. Taking an extreme case, our ancestors have been fully sighted for 400 million years but we still have inverted retina. On a smaller scale, we still have lactose and gluten intolerance in populations that have relied on cows milk and wheat as major sources of nutrition for thousands of years. Evolution is typically a very slow process for any major adaption, or adaption that requires modification of multiple proteins. Adaption rates allowing full adaption with 500 generations require both a simple adaption and very high mortality or infertility rates for those who lack the adaption. When it comes to cold/heat adaption, humans - specifically Homo sapiens where largely confined to tropical Africa where we evolved up to 200 thousand years ago until about 55 thousand years ago. Consequently some human populations have only had about 50 thousand years to evolve cold adaptions. The majority of human populations, however, have always remained in the tropics and have retained the adaption for high heat required. Of those that have evolved for greater cold adaption, even Eskimos have not yet achieved the body proportions that the genuinely cold adapted Neanderthal's had. That shows that human cold adaption is still incomplete and that, for example, physiologically Eskimos are almost as well adapted for the tropics as they are for their current environment. Consequently, given time to acclimatize and general good health, no modern human population would have its survival significantly threatened by merely tropical heat. Against that, if we continue on BAU, even European latitudes will be facing significantly more than tropical heat, taking todays tropical temperatures as a benchmark. However, until temperatures routinely exceeded 40 degrees C with very high humidity, human survival and prospering will not be threatened by mere physiology. In sharp contrast human agricultural productivity will be threatened by even small rises in global temperature. This is due to a number of factors, or which the most important is likely to be a lack of year to year predictability of climate conditions in any location. Coupled to that will be large changes in climate conditions, and slow soil development rates. If, as is likely, southern European and US latitudes become arid, while the Sahara becomes wetter, we will not be able to switch agricultural production from one to the other because it will take generations for suitable soils to develop in the Sahara, or indeed in current tundra. On top of that will be issues of increase virulence of diseases (both human and crop), pest species such as cockroaches, locusts and rats, and the need to find a substitute for fossil fuels to provide the large fertilizer needs of modern agriculture. The biggest threat to human civilization in the coming century will not be from the physiological effects of heat, or even disease, but from a limited ability to feed ourselves. -
Doug Hutcheson at 12:08 PM on 13 April 2012Data Contradicts Connection Between Earth's Tilt and the Seasons
Moderator Response: [mc] Apparently only available as video if you're in the UK!
Darn! -
Tom Curtis at 11:33 AM on 13 April 2012NASA Climate 'Skeptics' Respond with Science! Just Kidding.
HuangFeng, I agree with you that press releases and the more advanced instructional material should contain links to relevant papers. I also think basic instructional material should contain links to more advanced material which should link to papers, so that diligent students can find their way to the relevant papers if they want to. Having said that, I find that NASA GISS is far better in this regard than every other educational or research institution I have visited on the web. Anybody interested enough can simply go to the publications tab on the side bar of their site and find a full list of publications listed under an author index, by date, and by citation. Given that the former NASA employees are complaining about a lack of substantiating science rather than just a lack of links, this means they have ignored the most publicly accessible data base of climate science papers in the world, provided by NASA. It shows that not only are they not expert in climate science, they are not even expert in basic internet aided study techniques, or at least that they have turned of those skills when it comes to climate science.
Prev 1199 1200 1201 1202 1203 1204 1205 1206 1207 1208 1209 1210 1211 1212 1213 1214 Next


