


 Arguments


Recent Comments
Prev 1199 1200 1201 1202 1203 1204 1205 1206 1207 1208 1209 1210 1211 1212 1213 1214 Next
Comments 60301 to 60350:
-
Climate Scientists take on Richard Lindzen
Chris G - Lindzens apology was a positive indication. Unfortunately, he's been pushing much the same set of incorrect models since his (quite interesting, but quickly disproven) 2001 "Iris" paper. Which with fairly minor changes has been published yet again (3rd time?) as Lindzen and Choi 2011, in a rather off-topic journal, after being rejected from more on-topic publications. I'm not seeing any signs of recognizing and learning from past errors... -
adelady at 07:11 AM on 12 April 2012Eocene Park: our experiment to recreate the atmosphere of an ancient hothouse climate
dr2chase. Thanks for that. I have little to no experience with humidity. During extended hot periods here it's quite common to find several dead bees in the garden (when you find the courage and stamina to go outside again). -
dr2chase at 07:04 AM on 12 April 2012Eocene Park: our experiment to recreate the atmosphere of an ancient hothouse climate
Regarding bees/bats etc. Bees, I know from personal experience, are gloriously happy in a Florida climate. Africanized bees, which migrated north from Brazil, we can presume are pretty healthy in current-tropical climates. Bats do well in Florida, and do well in current-tropical climates. As a general rule, Florida was (and is) a much buggier place than Massachusetts or northern California. There's no doubt a maximum temperature for pollinators, but we're far from it right now in the US. People lived in the South (including Florida) back before air conditioning, though it wasn't a popular choice. If things go as predicted, I expect millions of people will leave Florida, much as millions of people moved to Florida in the previous century. Don't get me wrong, we are definitely rolling the dice on our present course, and they're loaded against us, but there's a difference between godawful costly and end of civilization, never mind end of a species. It's likely that there will be excess deaths, but elsewhere, and our civilization has developed and bumbled along in the face of excess deaths elsewhere for centuries, never mind the awfulness of calling that "civilization". What we call civilization, survived. -
Bob Lacatena at 06:11 AM on 12 April 2012Shakun et al. Clarify the CO2-Temperature Lag
JosHag, Thanks!!!!! -
Kevin C at 06:02 AM on 12 April 2012Data Contradicts Connection Between Earth's Tilt and the Seasons
While I wouldn't normally post an xkcd cartoon on SkepticalScience, there is a time and place for everything: (It took me a while to get the final panel, but I'm a little slow.)
[Mouseover text: Correlation doesn't imply causation, but it does waggle its eyebrows suggestively and gesture furtively while mouthing 'look over there'.]
Moderator Response: [Sph] Added mouse-over text to cartoon image.
(It took me a while to get the final panel, but I'm a little slow.)
[Mouseover text: Correlation doesn't imply causation, but it does waggle its eyebrows suggestively and gesture furtively while mouthing 'look over there'.]
Moderator Response: [Sph] Added mouse-over text to cartoon image. -
JosHagelaars at 05:55 AM on 12 April 2012Shakun et al. Clarify the CO2-Temperature Lag
Great post. It is maybe interesting to combine it with Schmitt et al 2012, which shows a drop in δ13Catm after 17.5 kyr BP explained as a result of upwelling old carbon-enriched waters in the southern ocean. They also report a small rise in δ13Catm before 17.5 kyr and, like Shakun, link it to rising temperatures: "After a very small increase in δ13Catm at the very end of the glacial, a sharp drop in δ13Catm starting at 17.5 kyr parallels the onset of increasing atmospheric CO2. Taken at face value, this would point to an early SST rise that preceded the onset of the CO2 increase." ... "Note, however, that this 0.06‰ excursion is within the uncertainties of our data and that other effects could also lead to this small enrichment in δ13Catm." @Sphaerica #69, the Shakun paper can be found here. -
Dibble at 05:03 AM on 12 April 2012Data Contradicts Connection Between Earth's Tilt and the Seasons
For a moment I thought you may be Bob Tisdale. A genuine Tisdale would have used at least 30 graphs to illustrate the same point. -
Chris G at 04:35 AM on 12 April 2012Climate Scientists take on Richard Lindzen
Bob, Also, the fact that he sent an apology when he made a misrepresentation indicates to me that he has integrity. (Anyone ever seen an apology from Watts or Monkton?) And, he doesn't deny basic things, like that the greenhouse gas effect exists. I think mostly he has cornered himself into an incorrect model, and is unwilling or unable to walk over the wet paint. -
Bob Lacatena at 04:28 AM on 12 April 2012Shakun et al. Clarify the CO2-Temperature Lag
68, Lazarus, If I'm reading the above analysis properly (I don't have access to the paper):- Orbital changes cause a retreat in ice sheets
- Retreat causes warming and disruption of the the Atlantic meridional overturning circulation (AMOC)
- The disruption of the AMOC plus the warming causes a faster increase in temperatures in the Southern Hemisphere
- The increase in temperatures in the led to a rise in CO2
- The rise in CO2 caused further increases global temperatures, accelerating both the SH (Antarctic) and NH temperature increases, which releases more CO2.
- Initial trigger was orbital changes causing ice melt (albedo changes)
- Ice melt added an unexpected factor in affecting the AMOC and a differential in warming in the two hemispheres
- Warming in the Antarctic proceeded more quickly, starting before CO2 release -- CO2 was a feedback in response to the warming -- so CO2 lagged Antarctic temperatures by 800 years
- Warming in the Northern Hemisphere proceeded more slowly, primarily driven by CO2, so CO2 (still, as a slow feedback) drove global temperatures higher and led temperature increases.
-
CBDunkerson at 04:23 AM on 12 April 2012NASA Climate 'Skeptics' Respond with Science! Just Kidding.
Response from NASA If I may paraphrase slightly, 'Hey, you guys are full of it... and feel free to publish some actual scientific research on the subject if you want anyone to take you seriously.' -
Chris G at 04:17 AM on 12 April 2012Climate Scientists take on Richard Lindzen
Bob, I make no claim as to the correctness of his numbers, but he is competent with math. I was just looking for his idea of a mechanism where orbital forcings could have an effect that was more than GHG forcings. That paper was what I found. And then I found where he argued against a high CO2 sensitivity and, I believe, coming to the wrong conclusion based an a faulty model. The model, and hence the conclusion derived from it, is wrong whether or not the math is correct. I doubt that his explanation is correct because I gather that he is invoking albedo effects that result from the orbital mechanics, and there can be a two-way interaction between albedo and CO2 content. The same conditions which lower the albedo can cause melting of permafrost leading to release of CO2 and methane. Increasing GHGs without changing the orbit or tilt can also lower the albedo by reducing the extent and duration of snow and ice cover. Since they interact, it would be tricky to attribute x warming from one and y warming the other. By the time the feedbacks play out, it might not matter. (Kind of like vector math; it all adds up the same.) I'm thinking that if the interaction between the feedbacks and forcings were low, then he might not be entirely unjustified in claiming different sensitivities. However, it can be measured that the earth is not currently in equilibrium; more energy is coming in than is leaving. That by itself kills the idea that we have already seen the effects that the current level of CO2 will produce. So, there is a lag, and the existence of a lag mandates the existence of the third possibility that Lindzen tries to avoid. -
shoyemore at 03:10 AM on 12 April 2012NASA Climate 'Skeptics' Respond with Science! Just Kidding.
Pity all of us who read and contribute to blogs have to spend time reading and/ or discussing material about this latest red herring. If anything, the watching public must have it dawning on them that science denial has no shot in its locker except for a series of publicity stunts. The fact that the spokesman Harrison Schmitt is a board member of the Heartland Institute should almost be enough to discredit the whole letter. -
Lazarus at 02:45 AM on 12 April 2012Shakun et al. Clarify the CO2-Temperature Lag
Perhaps I need something spelling out to me - but does this paper show why there is an 800 year lag just in the Antarctic proxies? -
Bob Lacatena at 02:18 AM on 12 April 2012Data Contradicts Connection Between Earth's Tilt and the Seasons
WUWT Headline:Skeptical Science Admits that Earth's Tilt More Important in Climate then CO2
-
MarkR at 02:08 AM on 12 April 2012Data Contradicts Connection Between Earth's Tilt and the Seasons
Shouldn't this have been submitted to WUWT as new analysis? -
Bob Lacatena at 01:24 AM on 12 April 2012Shakun et al. Clarify the CO2-Temperature Lag
65, William, To clarify Dana's point a little further... H2O responds very, very quickly to changes in temperature, as you yourself noted. As such, it is a fast feedback... raise air temperatures a little, water evaporates, and raises them even more. Cool the air a little, water condenses, and lowers them even more. But H2O never magically injects itself into the air on its own. Some temperature change is required to cause the H2O changes. Changes in solar insolation due to albedo changes (ice sheet growth or retreat), due to dimming aerosols (volcanic eruptions) or due to solar output changes (due to changes in solar activity or orbital configurations) represent one category of forcings. Changes in greenhouse gas concentrations (CH4, CO2, NO2) represent another forcing AND slow feedback -- i.e. something that need not be directly caused by temperature changes but can be, although in longer timeframes than the more rapidly changing H2O concentrations. -
Jim Eager at 01:10 AM on 12 April 2012Human CO2 is a tiny % of CO2 emissions
Wsugaimd's claim to be coming from a biology background and his apparent lack of understanding of the recycling of carbon through respiration and its role in the fast carbon cycle seem to be fundamentally irreconcilable. -
dana1981 at 00:59 AM on 12 April 2012Shakun et al. Clarify the CO2-Temperature Lag
William @65 - remember that water vapor is only a feedback, its atmospheric concentration dictated by the temperature of the atmosphere. The atmosphere has to warm first - that warming generally being caused by CO2 and other GHGs. -
caerbannog at 23:16 PM on 11 April 20122012 SkS Weekly Digest #14
caerbannog, while your 'Sparse Stations Index' presents a solid case I doubt it will sway most skeptics. The relative who seemed impressed presumably trusts you to be honestly representing the data...
My goal isn't so much to convince die-hard skeptics as it is to undermine them. What I'm trying to do is put together easy-to-understand, easy-to-visualize arguments that show "reachable" people how completely unreasonable and untrustworthy AGW-skeptic claims are. So to that end, I've been trying to "pass out the ammo". Don't know how effective this approach really is, but I figure that it can't hurt. -
Charlie A at 22:56 PM on 11 April 2012Hurricanes aren't linked to global warming
#46 Manny asks for updates on hurricanes vs climate change .... The latest IPCC assessment on extreme weather, including hurricanes, is the SREX report released last month. Chapter 3, Changes in Climate Extremes and their Impacts on the Natural Physical Environment (20MB pdf) The section on tropical cyclones runs from page 158 to 163. Regarding observations, SREX differs significantly from IPCC AR4, and says (page 160): Based on research subsequent to the AR4 and Kunkel et al. (2008), which further elucidated the scope of uncertainties in the historical tropical cyclone data, the most recent assessment by the World Meteorological Organization (WMO) Expert Team on Climate Change Impacts on Tropical Cyclones (Knutson et al., 2010) concluded that it remains uncertain whether past changes in any tropical cyclone activity (frequency, intensity, rainfall)exceed the variability expected through natural causes, after accounting for changes over time in observing capabilities. The present assessment regarding observed trends in tropical cyclone activity is essentially identical to the WMO assessment (Knutson et al., 2010): there is low confidence that any observed long-term (i.e., 40 years or more) increases in tropical cyclone activity are robust, after accounting for past changes in observing capabilities. Regarding possible changes in hurricane intensity, SREX notes that there is a correlation between SST and intensity which at first glance would imply that global warming would increase hurricane intensity. But SREX then goes on to note However, there is a growing body of research suggesting that local potential intensity is controlled by the difference between local SST and spatially averaged SST in the tropics (Vecchi and Soden, 2007a; Xie et al., 2010; Ramsay and Sobel, 2011). Since increases in SST due to global warming are not expected to lead to continuously increasing SST gradients, this recent research suggests that increasing SST due to global warming, by itself, does not yet have a fully understood physical link to increasingly strong tropical cyclones. (crude translation .... both warm water and a temperature differential is needed to form and intensify hurricanes, and global warming does not necessarily increase differentials) -
chriskoz at 21:39 PM on 11 April 2012Climate Scientists take on Richard Lindzen
We have a proof from icecores in last 800ky, that Lindzen talk about equilibrium sensitivity of 1K max is nonsense. The CO2 levels have been varying 180-280ppm while temps at the poles have been varying by as much as 10K. Taking into account the polar amplification, the average temps still varied by some 5K. 5K with no more than 60% of CO2 change, in those last 4 inter/glacials. These are reconstructed facts rather than climate models, and suggest the equilibrium sensitivity even higher than that of IPCC models. How come is is now "1K for doubling CO2"? I wander what Lindzen and his supporter can say about that. -
William Haas at 21:27 PM on 11 April 2012Shakun et al. Clarify the CO2-Temperature Lag
Really nice article. To enhance or continue global warming is atmospheric CO2 really necessary to explain it? What about H20? Particularily over ice fields, as ice melts the level of water vapor in the atmosphere increases dramatically and causes the atmosphere to warm because of green house heat trapping effects. The warmer the air the more water vapor it can hold. To cause significant increases in atmospheric water vapor only surface water needs to be warmed. A much larger volume of water needs to be warmed to cause significant increases in atmospheric CO2. I would think that starting with an ice aged earth, H2O would dominate any green house gas triggering effects. -
CBDunkerson at 21:02 PM on 11 April 20122012 SkS Weekly Digest #14
caerbannog, while your 'Sparse Stations Index' presents a solid case I doubt it will sway most skeptics. The relative who seemed impressed presumably trusts you to be honestly representing the data... the majority of 'skeptics' don't have that personal connection and have long since adopted a stance of holding that all data disproving their views must be 'faked'. Further, I suspect that a similar, though actually biased, approach could be taken by 'skeptics' to show a very different result. Your 'longest record' methodology would effectively result in the trend for each station being randomly selected. What would happen if someone instead took the station with the lowest trend in each of the four regions and averaged those together? It would probably show slight cooling over the period, and certainly wouldn't line up with the GISS results at all. That said, there should be some fraction of the total data set where even taking only the stations with the lowest trends would match GISS fairly well... as the few outliers would be averaged out by the vast majority of stations roughly in line with the global trend. Your approach is a solid refutation that any reasonable person would accept... but if 'skeptics' were reasonable they'd have accepted the countless previous analyses showing irrefutable warming. -
MA Rodger at 19:09 PM on 11 April 2012New research from last week 14/2012
Henriksson et al 2012 (Analysis of quasiperiodic 50-80 year oscillation in global temperature record) will give them there numerologists a lot of ammo with their quest for evidence of natural causes for rising temperatures. Then the paper itself appears not far from being simple curve fitting. The paper begins its introduction (but strangely not its abstract) "Periodic or quasi-periodic natural climate variability could provide part of the explanation as to why global mean temperature has been nearly constant for a decade despite risng greenhouse gas concentrations (Semenov et al 2010)." which isn't an encouraging start-point and politely mention only "near-constant" or "declining" global mean temperatures in the abstract but the flip side is there ready & waiting for WUWT to jump on. Their wobble searching (eg in the CET) shows a sign of some respectability and there is one point of interest in the identification of this wobble in the output from a model. Now that should then lead to an analysis of why the model turns wobbly & so whether the wobble is an actual phenomenon or an aberent artifact. Well, it would if you weren't distracted trying to prove reasons for wobbles in recent global temperature records. -
Eric (skeptic) at 19:03 PM on 11 April 2012Shakun et al. Clarify the CO2-Temperature Lag
Missing from the see saw discussion and from figure 5 is ice age dust. As warming commenced in the SH, dust values did not change immediately but dust sources started to become vegetated. As that became more prominent, the NH warmed. For dust by latitude see fig 1 here: http://www.rem.sfu.ca/COPElab/Claquinetal2003_CD_glacialdustRF.pdf -
Michael Whittemore at 16:36 PM on 11 April 2012Shakun et al. Clarify the CO2-Temperature Lag
By the look of figure 4 above, it would seem that CO2 might have lagged behind the temperature change in the regions 0-30N to 60-90S. Due to the extra cooling that is seen in the 30-90N zone, when averaged altogether with 0-90N proxy's, makes it look like the whole Northern Hemisphere lagged CO2. When this might not be the case. -
caerbannog at 16:32 PM on 11 April 20122012 SkS Weekly Digest #14
Just for fun, I thought that I'd "take it to the next level" with respect to computing global-average temps from the minimum number of rural temperature stations. Set up a couple of processing runs with just 8 and then just 4 rural stations -- corresponding to 90deg(lat)x90deg(long) and 90deg(lat)x180deg(long) global grid sizes, respectively. As you can see, the global-warming signal begins to emerge from the noise with data from as few as 4 to 8 stations. In statistical detection theory, the proper technical term for this level of signal detection performance is "Slam-Dunk". And yes, skeptics, before you ask -- I used raw data.
-
Michael Whittemore at 14:33 PM on 11 April 2012Shakun et al. Clarify the CO2-Temperature Lag
So it would be fair to say that when the (AMOC) stopped, the northern hemisphere cooling would have over powered the Milankovitch forcing and allowed the (AMOC) to start again? -
danielc at 14:27 PM on 11 April 2012Shakun et al. Clarify the CO2-Temperature Lag
@Dana Critical point being that it is a control knob that will not move unless nudged... the nudging is key, and that is the Milankovitch forcing... Why is it so hard for deniers to grasp this very basic concept? (I know, I know, it's NOT hard, but it interferes with their ideologically (inflammatory snipped) driven requirements.Moderator Response: TC: In compliance with the comments policy, please try to avoid suggestions of impropriety. Thankyou -
dana1981 at 14:21 PM on 11 April 2012Shakun et al. Clarify the CO2-Temperature Lag
Michael @59 - I'd agree with that statement. The orbital forcing is too small to cause a lot of surface changes on its own. The CO2 feedback/forcing is critical in that respect, which is why it's the main control knob. -
Bob Lacatena at 14:08 PM on 11 April 2012Human CO2 is a tiny % of CO2 emissions
wsugaimd,I believe the C02 exhaled by...
I see this a lot from skeptics.... sentences that start with "I believe." The thing is, of all things, the accounting of CO2 is done and solid. There is no wiggle room there. We know how, we know how much, we have multiple lines of evidence to prove that it cannot have come from any place else. I personally think the most complete link is this one but there are many others. Click the "View All Arguments" link below the thermometer at left, search the the page for CO2, and you'll find that every thing you have brought up has been thought of by others, and holds no weight whatsoever. Please take the time to study the information that is already available. You can "believe" what you choose, or you can educate yourself. The choice is yours, but falling back on your "belief" hardly entitles you to lay claim to the mantle of "skeptic." -
Manny at 13:57 PM on 11 April 2012Hurricanes aren't linked to global warming
No updates on hurricanes vs climate change over the past 18 months: has the issue been settled, and what is the conclusion? -
Michael Whittemore at 13:56 PM on 11 April 2012Shakun et al. Clarify the CO2-Temperature Lag
It would still seem to me that without the release of CO2 you would not of had much of the ice sheet and vegetation forcing (Figure 5 in the post) occurring. -
dana1981 at 13:36 PM on 11 April 2012Shakun et al. Clarify the CO2-Temperature Lag
Shakun et al. do not comment on the relative importance of different factors. As noted in the Climate Sensitivity section in the above post, they do not comment on the size of radiative forcings other than greenhouse gases. I suspect they would not differ significantly from the estimates in Hansen and Sato (2011) - Figure 5 above. -
Michael Whittemore at 13:35 PM on 11 April 2012Shakun et al. Clarify the CO2-Temperature Lag
Tom Curtis @54 Just to add, thanks for your posts, it explained what happened much more clearly, I will also read the Clark et al. paper. -
danielc at 13:34 PM on 11 April 2012Shakun et al. Clarify the CO2-Temperature Lag
@Michael: Careful - copyright violation does get snooped... don't be blatant. @Tom, I will check it out, but the air is getting pretty thin for me - I am much more a geologist and jack-of-all-trades than a bona fide climate scientist/modeler. I specialize in tectonics and structural geology, with a strong interest in linked fields (of which this is one, to be sure)... but getting into the bones and guts of these models is very hard for me to do with confidence... -
Michael Whittemore at 13:26 PM on 11 April 2012Shakun et al. Clarify the CO2-Temperature Lag
One of the perks of being enrolled in uni, I seem to be able to look at most papers for free :) You want me to email you the paper in pdf? -
Tom Curtis at 13:07 PM on 11 April 2012Shakun et al. Clarify the CO2-Temperature Lag
Michael Whittemore @53, the paper is behind a paywall for me, so I cannot asses Shakun et al's claims on the subject. However, that seems unlikely to me. It is likely that there were changes in albedo concurrent with, and possibly preceding, the initial increase in CO2 levels. Based on the data from Clark et al quoted above, GHG "forcing" represented approx 40% of the total "forcings", and hence temperatures would have increased by about 2.4 C without the CO2 and methane feedback (based on Shakun et al's estimate of the temperature difference between LGM and the present). That estimate ignores the relative significance of different factors in triggering the transition which I am not able to assess. Perhaps Dana or somebody else who has read the paper can fill in with more details of Shakun et al's estimate of the relative importance of different factors in triggering the transition. -
Michael Whittemore at 12:42 PM on 11 April 2012Shakun et al. Clarify the CO2-Temperature Lag
Tom Curtis @52 Thanks for the explanation. As the paper says that 93% of the warming happened after the CO2 rise, is it fair to say that without the rise in CO2, there would had only been about 7% of the warming taking place? -
Phil L at 12:35 PM on 11 April 20122012 SkS Weekly Digest #14
KR and Sphaerica - Carbon sequestration in wood products obviously isn't the final solution, but it can be a significant factor in mitigation efforts. Arguing that sequestration for the lifetime of wood frame houses is useless because it is shorter than thousands of years seems akin to saying that Canada may as well not make any effort because of China's emissions. An important point is the avoidance of fossil fuels in production of steel or concrete buildings, as pointed out by the IPCC. -
Tom Curtis at 12:30 PM on 11 April 2012Shakun et al. Clarify the CO2-Temperature Lag
Michael Whittemore @51, from the article above I do not see where Shakun et al claim 93% of warming was caused by CO2. The article does say that " According to the Shakun et al. data, ... 93% of the global warming followed the CO2 increase." However, just because something follows something else does not mean it was caused by that thing. I suspect that Shakun et al believe the warming was caused by a combination of CO2, albedo changes due to the loss of continental ice sheets, methane, albedo changes due to change in vegetation, and changes in dust levels in the atmosphere among other factors. Of these, albedo changes are the largest factor, followed by CO2 and methane in that order. With respect to g, the formula is f = 1/(1-g), where f is the feedback response and g is the "gain", so named by analogy with electronic circuits. Again, the gain is not just the CO2 response, but the partial response to any warming. Any such response results in further feedbacks and hence further warming. So long as the partial response is less than 1, the total response approaches a limit equal to f (which is what we are interested in and can measure). For any study, g = 1 - 1/f, and f is approximately equal to the climate sensitivity for a doubling of CO2. Hence, base on the article above, f is probably about 2.5 and g is 0.6 for fast feedbacks; and f is probably about 6, and g 0.833 with slow feedbacks included (using Hansen's method of determination). The important thing here is not the numbers, because we cannot measure g directly. It is the understanding that the response to an initial warming does not happen all at once, but incrementally with initial responses causing further responses, and so on; and the understanding that this process is self damping provided that each incremental response is less than the temperature increase that caused that response. -
Michael Whittemore at 11:27 AM on 11 April 2012Shakun et al. Clarify the CO2-Temperature Lag
Has a study been done on the amount of CO2 that was initially released and the amount of feedback temperature increase should have happened. Shakun et al. 2012 says 93% of the warming was caused by the CO2, could that value be confirmed with are |g^x| < |g^y| understanding of feedback's? -
Tom Curtis at 11:27 AM on 11 April 2012Human CO2 is a tiny % of CO2 emissions
wsugaimd, The Earth has five short term reservoirs of CO2, and two long term reservoirs. The short term reservoirs are, in order of size: 1) The deep ocean; 2) The soil; 3) The surface ocean; 4) The atmosphere; and 5) The biosphere. Flows between these reservoirs is very large, and very rapid. The result is that soil, surface ocean, atmosphere and biosphere maintain equilibrium on a time scale of around a year, while the deep ocean maintains equilibrium on time scales of a century or so. These reservoirs are shown in this diagram from wikipedia (note, black ink indicates storage, blue ink indicates fluxes):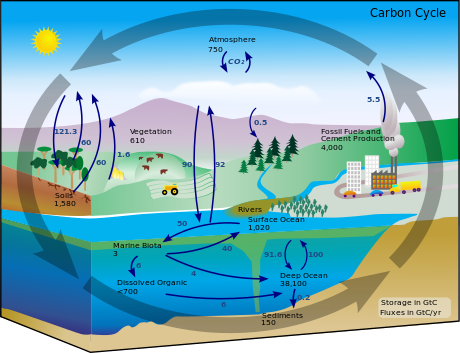 Because fluxes between these reservoirs are rapid, equilibrium is maintained between them. Consequently the normal fluxes between these reservoirs cannot increase the total CO2 (or chemical derivatives such as cellulose) in the aggregate of the reservoirs. What is more, because equilibrium is maintained, except for circumstances which shift the equilibrium they will not result in changes in any particular reservoir.
For example, increased aridity will result in less carbon being stored in soils and the biosphere. As a result, more carbon will be stored in the atmosphere and ocean. If it is a short term change in aridity, it will not effect the deep ocean, but if it is a change that lasts for a century or so, the excess CO2 (and derivatives) in the atmosphere and surface ocean will be depleted partially to re-establish equilbrium with the deep ocean.
Similarly an increase in sea surface temperatures will result in diminished CO2 storage in the surface ocean, resulting in more CO2 being stored in the atmosphere, soils and biosphere (from the CO2 fertilization effect among other effects). Such changes in SST are responsible for much of the small changes in CO2 concentration prior to 1750 and visible in the graph @224 above. They are also responsible for the strong correlation between ENSO and the short term fluctuations in CO2 concentration as observed by modern instruments.
In addition to the short term reservoirs, there are two long term reservoirs. They are sedimentary rocks, particularly lime stones but including coals and other fossil fuels, and the Earth's mantle. Transfer between these reservoirs and the short term reservoirs is normally very slow. This occurs by the formation of sedimentary rocks, which are then subducted to the mantle, which returns the CO2 to the surface through volcanos. Currently the rate at which volcanos return CO2 to the surface is about 1/100th of the rate at which humans emit CO2.
In effect, humans have increased the transfer from the long term reservoirs to the short term reservoirs by a hundred fold. Because the short term reservoirs are in equilibrium, it is far more logical to consider that transfer as the cause of increase in CO2 storage which has been measured in all five of the surface reservoirs than to assume that the cause is a transfer from one surface reservoir to another (as you are doing).
Indeed, it is only possible to consider the high relative flux from the biosphere to the atmosphere through respiration as the cause of the increase in atmospheric CO2 if you firmly ignore two points:
a) The equally large flux from the atmosphere to the biosphere by photosynthesis; and
b) The fact that the atmospheric CO2 has been effectively stable for 10 thousand years even in the presence of the large flux from biosphere to atmosphere, which as remained essentially unchanged.
Because fluxes between these reservoirs are rapid, equilibrium is maintained between them. Consequently the normal fluxes between these reservoirs cannot increase the total CO2 (or chemical derivatives such as cellulose) in the aggregate of the reservoirs. What is more, because equilibrium is maintained, except for circumstances which shift the equilibrium they will not result in changes in any particular reservoir.
For example, increased aridity will result in less carbon being stored in soils and the biosphere. As a result, more carbon will be stored in the atmosphere and ocean. If it is a short term change in aridity, it will not effect the deep ocean, but if it is a change that lasts for a century or so, the excess CO2 (and derivatives) in the atmosphere and surface ocean will be depleted partially to re-establish equilbrium with the deep ocean.
Similarly an increase in sea surface temperatures will result in diminished CO2 storage in the surface ocean, resulting in more CO2 being stored in the atmosphere, soils and biosphere (from the CO2 fertilization effect among other effects). Such changes in SST are responsible for much of the small changes in CO2 concentration prior to 1750 and visible in the graph @224 above. They are also responsible for the strong correlation between ENSO and the short term fluctuations in CO2 concentration as observed by modern instruments.
In addition to the short term reservoirs, there are two long term reservoirs. They are sedimentary rocks, particularly lime stones but including coals and other fossil fuels, and the Earth's mantle. Transfer between these reservoirs and the short term reservoirs is normally very slow. This occurs by the formation of sedimentary rocks, which are then subducted to the mantle, which returns the CO2 to the surface through volcanos. Currently the rate at which volcanos return CO2 to the surface is about 1/100th of the rate at which humans emit CO2.
In effect, humans have increased the transfer from the long term reservoirs to the short term reservoirs by a hundred fold. Because the short term reservoirs are in equilibrium, it is far more logical to consider that transfer as the cause of increase in CO2 storage which has been measured in all five of the surface reservoirs than to assume that the cause is a transfer from one surface reservoir to another (as you are doing).
Indeed, it is only possible to consider the high relative flux from the biosphere to the atmosphere through respiration as the cause of the increase in atmospheric CO2 if you firmly ignore two points:
a) The equally large flux from the atmosphere to the biosphere by photosynthesis; and
b) The fact that the atmospheric CO2 has been effectively stable for 10 thousand years even in the presence of the large flux from biosphere to atmosphere, which as remained essentially unchanged.
-
danielc at 11:13 AM on 11 April 2012Shakun et al. Clarify the CO2-Temperature Lag
@Tom, agreed for the most part... Tilt is a major part of the story, but tilt + precession for a given ellipticity will augment and potentially enhance (a lot!) the differences... NH in the last several million years is inherently more sensitive for a number of reasons: 1) land surrounding polar/arctic region, 2) More land (i.e. more material with lower heat capacity), 3) more land - again (more area for plant growth), 4) more limited and confined ocean circulation paths (both surface and deep water). We can see that sensitivity in the present day in many ways: the difference in absolute value for CO2 measurements compared between north and south, the difference in seasonal variability in CO2, temperatures, water vapor, and so forth between north (large variability) and south (small variability)... Now, as to whether spring insolation vs summer insolation makes that huge of a difference (i.e. does it matter if it comes in Sept. - Dec. or Oct. - Jan) in the SH, I honestly do not know... what does seem clear that at least on first look, the response in the NH drives the bus, and the triggering that happens, happens because of what goes on up North, rather than down South. One way that we sort of knew this already is that Antarctica has been ice-locked/ice-covered since 33 m.y.b.p. (or so), and yet recent style glaciations that involve significant coverage of the NH have been ongoing only since the last 10 million years (sort of) and really less than 3.5 mybp ... (I know there are some lines of evidence and working hypotheses that contest this, suggesting Oligocene glaciation in the NH, but that work is still in progress as far as I know). Point being that the paper that sparked this discussion is saying almost the same thing as the much larger scale geological record: the Southern Hemisphere appears to respond quite faithfully to global insolation/milankovitch/weathering carbon cycle systems, but is not a sensitive trigger like the NH appears to be. -
Shakun et al. Clarify the CO2-Temperature Lag
Sphaerica - I've often found that following the Google Scholar "All N versions" link points to at least one PDF copy of the paper, possibly on the authors university site. Not in all cases, but in a great many... -
Tom Curtis at 10:10 AM on 11 April 2012Human CO2 is a tiny % of CO2 emissions
Posted by wsugaimd here, and moved because of topic:"Thanks for the info. Sorry for posting on a wrong? link. First time here so I'll learn...I'm coming from a biology background and I'm not sure of the argument that its the C02 driving the temp. Heres why... Its estimated that there are 560 billion tons of biomass, not including bacteria or oceanic bacteriophage/viruses which far out weigh all prokaryotic and eukaryotic life forms. There are 10 million viruses in a drop of seawater. What I'm trying to say is that as temp rises, life forms increase metabolism, i.e., release more C02. Even plants exhale C02 at night. And I believe the C02 exhaled by all biomass on earth has far more impact than the few "pennies" our cars put out. Is my CO2 different from a frogs? I think not."
-
dana1981 at 10:09 AM on 11 April 2012Shakun et al. Clarify the CO2-Temperature Lag
wsu @46 - please also see the rebuttal to the myth CO2 increase is natural, not human-caused'. You are incorrect on this issue. -
Tom Curtis at 10:03 AM on 11 April 2012Shakun et al. Clarify the CO2-Temperature Lag
danielc @35, actually we are disagreeing. If you look closely at the graph, you will see that at the onset of the last glacial/interglacial transition, there was increased insolation in the NH (top two panels) from March to August. In contrast, in the SH (bottom panel) the increased insolation is from August to December, corresponding to the SH spring. There is reduced SH insolation in January through to March, corresponding to the SH summer and autumn. Clearly my post was inaccurate as well. However, it is a mistake to think that NH and SH insolation effects are equal either by month or by respective season. Changes in the eccentricity of Earth's elliptical orbit will effect both hemispheres in the same way at the same time. Changes in axial tilt (obliquity) will have opposite effects on the different hemispheres, with the synchronization with the elliptical orbit determining whether it moderates of reinforces the NH summer insolation. The combined result is the complex pattern you see in the figure at 34. The reason the NH effects dominate in transitions between glacial and interglacial is because if snowfall extends further north in the SH is simply falls in the ocean and melts, thus preventing the formation of ice sheets. -
wsugaimd at 09:50 AM on 11 April 2012Shakun et al. Clarify the CO2-Temperature Lag
(snip)Moderator Response: TC: Of topic comment moved to the appropriate thread. wsugaimd, you are new here so I am extending you the courtesy of moving your comment rather than simply deleting it. Future of topic comments will simply be deleted. There is an extensive list of "skeptical" objections to the theory of AGW on the side bar. Using it, or the search function will allow you to find discussion of almost any "skeptical" talking point on AGW so that you can post under the correct topic. If you are interested in genuine discussion, I strongly suggest you do the readers the courtesy of posting where they can see the AGW side of the argument immediately without having to do the search themselves. You may also be interested in reading the other side of the argument yourself. If you cannot find the appropriate topic, ask where it is in the digest of the week thread. Regardless of whether you wish to do our readers that courtesy, posting at SkS is conditional on compliance with the comments policy. Anybody who has already responded to this post on this thread may wish to move the comments to the appropriate thread themselves as all responses will be deleted shortly. -
Tom Curtis at 09:47 AM on 11 April 2012CO2 measurements are suspect
wusgaimd, would you care to inform us which volcano is contaminating the CO2 measurements at the South Pole (shown @53 above)? For comparison, here is the full Keeling Curve from Mauna Loa:
Prev 1199 1200 1201 1202 1203 1204 1205 1206 1207 1208 1209 1210 1211 1212 1213 1214 Next


