


 Arguments


Recent Comments
Prev 1202 1203 1204 1205 1206 1207 1208 1209 1210 1211 1212 1213 1214 1215 1216 1217 Next
Comments 60451 to 60500:
-
threadShredder at 01:20 AM on 3 April 20122012 SkS Weekly Digest #13
In the "Issue of the Week" paragraph above, the question is asked: "Do you subscribe to the daily email notice of newly posted articles on SkS? Would you subscribe to a weekly email notice of newly posted articles if the option to do so was provided? Which option do you prefer?" My question is how does the reader make his or her preference known?Moderator Response: [JH] You should post your answers to the questions of this comment thread. Right now, the only option that exists, is to sign-up for the daily email alerts, We are hoping to implement the weekly only alert option in the near future. Unfortunately, the recent hack of this website has caused a delay in implementing planned changes to the website. -
Daniel Bailey at 01:09 AM on 3 April 2012Weather records due to climate change: A game with loaded dice
@ West "I missed the point of the OP on purpose" Ah, you were being purposefully obtuse! Well, that's all right then. Not. Please curtail the ideology and inflammatory rhetoric. This is a science-based forum. You lose credibility thusly. And do please bother to support your unsupported assertions with links (to credible source) as well. As for my source for 2 meters SLR, please note that I did not temporally attach it. Using your very own Stefan Rahmstorf you refer to: Has the IPCC underestimated the risk of sea level rise? In this paper, Dr. Rahmstorf documents the IPCC's underestimations (not over-estimations) of SLR and incorporates some of the latest estimates of SLR (124 centimetres by 2100 and 114 centimetres by 2095) Taking ice sheet dynamics into account, decadal doublings of mass-loss from both the Greenland and West Antarctic Ice Sheets are expected this century...and beyond. The present worst-case scenario in the literature (also the latest) which takes this into account is here (in press). Note the use of supportive links for assertions. And note, again, that I did not tie the 2 meter SLR to a particular date. That would be a false assumption on your part that I did. @ Tom: The Bamber paper has details. Edit: The Bamber paper can be found here (free download after free registration): Reassessment of the Potential Sea-Level Rise from a Collapse of the West Antarctic Ice Sheet -
Tom Curtis at 00:51 AM on 3 April 2012Weather records due to climate change: A game with loaded dice
Daniel Bailey @11, I believe US seaboards are, on average more threatened because of isostatic rebound. Because the great ice sheets are no longer weighing down the north of the continent, the north is rising, but the south is sinking. This is bad news for southern US coastal towns which will probably experience sea level rise greater than 25% above the global average. I suspect, however, that New York would be near the "pivot point", and possibly north of it. In either case it will experience sea level rises closer to the the global average than the rest of the US, and possibly less than the global average. I haven't checked the exact details, however. -
West129 at 00:34 AM on 3 April 2012Weather records due to climate change: A game with loaded dice
Daniel Bailey, I missed the point of the OP on purpose because the Rahmstorf, S. (2012): A Decade of Weather Extremes, Nature Climate Change [DOI: 10.1038/NCLIMATE1452] report was, in my opinion, translated into the “PIK press release” that contradicts facts/reality but is meant to generate publicity and misleading propaganda. It is a summary of plain speculations that lack scientific merit and is are a disgrace to the German scientific community. . As to the increase in the sea level please, refer to the very alarming IPCC predictions (scenarios), “Prognosen des IPCC zum Meeresspiegelanstieg im 21. Jahrhundert [21]” (Increase of sea level for the 21st century): IPCC predicted 367 cm in 1990, 124 cm in 1995, 77 cm in 2001, 51 cm in 2007 and who knows what they will predict next, except that I am certain that it will be even lower. I wonder where the 2 meters you mention are coming from. The 3,67meters [12 ft] predicted by IPCC in 1990 has shrunk to ½ meter (1½ ft) in 2007 because their models have improved? No, because they were adjusted to reflect reality. Models run on computers are still no better than what used to be called crystal balls, not worth getting exited about or to command actions. The climatologists will loose their credibility if they continue to produce documents that contradict reality and seem to have no other purpose than to hype or terrorize the population. -
Daniel Bailey at 00:18 AM on 3 April 2012Weather records due to climate change: A game with loaded dice
"He pointed out that New York is at the same level as the Maldives." Actually, due to the unequal redistribution of the SLR (various gravitic/crustal rebound effects), New York City will face a disproportionate impact of that 2 meter SLR: "U.S. seaboards would rise 25 percent more than the global average and threaten cities like New York, Washington, D.C., and San Francisco" -
adelady at 00:11 AM on 3 April 2012Weather records due to climate change: A game with loaded dice
DB "... it's just the first 2 meters of SLR that matter." Yes. That came home to me quite strongly the other day reading a piece about the president (now former) of the Maldives. If anyone thinks that losing a few remote islands off the coast of India by a couple of metres of SLR is unimportant they should think again He pointed out that New York is at the same level as the Maldives. So if those 'insignificant' islands go under, life will not be too comfortable in the subways and carparks of NYC. -
Bernard J. at 23:31 PM on 2 April 2012Yes Happer and Spencer, Global Warming Continues
Dikran Marsupial. I've posted a number of times, and on several sites, to criticise exactly what you discuss. In fact in the middle of last year I went to the trouble of fitting to each of the major temperature records, polynomial curves of all orders up to 6, and I then extended each terminus beyond the record period for at least a century in each direction, to show how the polynomials behaved. I had written an explanatory dissection of the whole... and about five minutes before I finished editing my hard drive crashed. By the time I replaced my drive I'd lost the inclination to repeat the exercise. Perhaps it might be a useful enterprise for one of the SkS authors, so that any future "entertainment" activity by a data dissembler can be quickly and decisively dismantled. -
Tom Curtis at 23:16 PM on 2 April 2012Scientist Sets Record Straight on Medieval Warming Research
While on the topic of correcting errors, two days ago I posted this on WUWT:"Anthony, granted that the passage you quote is reasonable grounds for the claim that the study provides evidence that the MWP was global, so long as we interpret “provides evidence” in a strict but weak sense which does no over interpret the data. Specifically, it does not establish a prima facie case that the MWP was on average warmer than the first decade of the 21st century, or that all locations of the globe where warmer than the first decade of the 21st century (two possible interpretations of the claim that the MWP was global). It does contribute towards building such a prima facie case, but other evidence contributes to building the contrary case and only by consideration of the balance of all evidence can it be determined which theory is better supported. However, the Daily Mail article clearly misrepresented the contents of Lu et al, 2012. Nor did we need the corrections from Syracuse University and Dr Lu to know that. Specifically, the article claims that ikaite is “a rare mineral that records global temperatures”, which is blatantly false. It also claims that the study “Throws doubt on orthodoxies around ‘global warming’” which is also blatantly false (and tendentious). Given these clear misrepresentations by the article, why did you not provide a caveat with your link warning your readers of the misrepresentation by the Mail Online? This is of particular interest as, by your account, this post is for the benefit of people who have read the Mail Online article and were wondering why you had not posted on the topic. Surely for their benefit it was important to point out not only that you have covered it, but that the Mail Online article contained gross misrepresentations, and to correct those misrepresentations. I await your answer with interest."
So far Watt's has not deigned to respond. Evidently acknowledging and correcting the errors he did make on this paper, ie, his failure to point out the gross misrepresentation by the Mail Online article to which he linked, is not on his agenda. -
Tom Curtis at 22:55 PM on 2 April 2012Scientist Sets Record Straight on Medieval Warming Research
Brandon Shollenberger @46 thank you for the links. However, having been able to peruse their contents, it is quite plain why you did not provide them previously. Let's start with Figure S8: Your original claim was that Mann et al 2009 was "... entirely dependent upon tree ring data and uncalibratable data (which was used upside down)."
By examining the graph above it can be seen the the essential features of the Global Mean Temperature Reconstruction without dendro series, the four Tiljander series, and three other series which may have suspect data. Specifically, that reconstruction shows a LIA colder than the 20th century average, and a MWP warmer than the 20th century average but colder than end 20th century temperatures. The only way in which the reconstruction could be considered "entirely dependent" on the tree ring and tiljander data (combined) is on the issue of statistical validation. But it is no surprise that as you reduce the number of proxies, the period over which the reconstruction passes statistical validation reduces.
Indeed, the reason the reconstructions loose statistical skill with increased duration is that the number of proxies available for the full duration of the reconstruction falls. By excluding dendro plus seven other series, the number of available proxies in the period 1400-1499 after screening drops from 99 to 22. With dendro series still included that number rises to 68. So, it turns out that Brandon's case depends on arguing that the fact that 22 proxies is insufficient to reconstruct global temperatures is some how of great statistical significance.
Of course, he has an authority on his side, Gavin Schmidt. Except it turns out that what Schmidt actually wrote was:
Your original claim was that Mann et al 2009 was "... entirely dependent upon tree ring data and uncalibratable data (which was used upside down)."
By examining the graph above it can be seen the the essential features of the Global Mean Temperature Reconstruction without dendro series, the four Tiljander series, and three other series which may have suspect data. Specifically, that reconstruction shows a LIA colder than the 20th century average, and a MWP warmer than the 20th century average but colder than end 20th century temperatures. The only way in which the reconstruction could be considered "entirely dependent" on the tree ring and tiljander data (combined) is on the issue of statistical validation. But it is no surprise that as you reduce the number of proxies, the period over which the reconstruction passes statistical validation reduces.
Indeed, the reason the reconstructions loose statistical skill with increased duration is that the number of proxies available for the full duration of the reconstruction falls. By excluding dendro plus seven other series, the number of available proxies in the period 1400-1499 after screening drops from 99 to 22. With dendro series still included that number rises to 68. So, it turns out that Brandon's case depends on arguing that the fact that 22 proxies is insufficient to reconstruct global temperatures is some how of great statistical significance.
Of course, he has an authority on his side, Gavin Schmidt. Except it turns out that what Schmidt actually wrote was:
"It's also worth spelling out some of McIntyre's thimble hiding here. First off, after a 7 years you'd think that he would be aware that the reconstructions are done in a step-wise fashion - i.e. you use as much information as is available as far back as you can. Back to 1500 you use everything that goes back that far, back to 1400 a little less etc. So a proper no-dendro/no-Tilj reconstruction will not just be made with what is available in 1000AD. Second, given all of the bluster about validation statistics, he never seems to compute any. Since the no-dendro CPS version only validates until 1500 AD (Mann et al (2008) ), it is hardly likely that the no-dendro/no-Tilj CPS version will validate any further back, so criticising how bad the 1000 AD network is using CPS is hardly germane. Note too that while the EIV no-dendro version does validate to 1000 AD, the no-dendro/no-Tilj only works going back to 1500 AD (Mann et al, 2009, SI). So again, McIntyre is setting up a strawman, not performing any 'due diligence' and simply making stuff up - all in order to demonstrate some statistical prestidigitation to the adoring commenters."
So, instead of affirming that the lack of validation for the no dendro, no tiljander data set prior to 1500 is some show significant, he is excoriating McIntyre's "thimble hiding", thimble hiding of a very similar nature to that by Brandon. If Brandon was serious about his argument, he would perform a Monte Carlo test. He would eliminate 1,039 proxy series and determine the earliest date at which the resulting reconstruction achieves validation using the Mann et al 2008 method. He would then rinse an repeat, doing the same thing several thousand times to find a probability function for the duration of statistical skill for similar trimmings of the proxy set. If, having done that he finds that statistical skill is preserved well earlier than 1500 AD in >95% of cases of similarly extensive censoring of the data, then he has a case. Failing such a test, however, all he as is the trivial fact that significantly reducing available data significantly reduces statistical skill. [sarc] Who would have thought it? [/sarc] Finally, Brandon says:"Incidentally, I don't claim removing 86% of the data is necessary to remove the hockey stick. I only go with that test because Mann himself specifically claimed his reconstruction passed it. And Mann's own work has acknowledged that isn't true. As has Mann's major supporter and friend, Gavin Schmidt."
This is a straightforward falsehood, or actually several of them. 1) Neither Mann nor Schmidt claimed that reducing the data "remove[s] the hockey stick". That is explicitly a claim about the shape of the curve resulting from removing the data, and as can be seen above removing the data does not significantly change the shape of the curve. More importantly, Mann and Schmidt made claims about the effect of censoring data on statistical skill, not on the shape of the curve. 2) In Mann et al, 2008, Mann made claims about statistical skill when removing all dendro series. He did not make any claims about statistical skill when removing all dendro series plus seven other series. Therefore the supplementary information to Mann et al 2009 does not show his claim in 2008 to have been wrong. 3) As Mann et al 2009 does not show Mann et al 2008 to be wrong, Schmidt cannot have acknowledged the non-existent error by citing the non-existent acknowledgement of the error. Given that the quoted claims by Brandon are direct falsehoods, I would hope he has the integrity to acknowledge his error, and correct it. But I fear he will just provide one more example of the truism, being a denier means never having to say your wrong. -
Daniel Bailey at 21:48 PM on 2 April 2012Weather records due to climate change: A game with loaded dice
West129, your comment shows that you have completely misunderstood the OP. Instead of undermining the level of urgency of actions needed to mitigate climate change, it heightens the imperative behind them, for it resolves with increasing clarity the outcomes awaiting us down the road we travel. This report is but one of many recent works, all coming to the same conclusion: AGW is bad, its worse than we thought, it's late in the game and time is running out to implement changes that can make a difference before time runs out on mitigation efforts. And then all we will have left is the "adapt or die" option. For it is not the 6 meters of SLR over 500 years from GIS melt that matters (and if the GIS goes, the WAIS will precede it by orders of magnitude, adding a like amount of SLR), it's just the first 2 meters of SLR that matter. That will force abandonment of the great cities of the coast the world over. You beat the lonely drum of "It's not bad" though the train has left the station, without you. -
Dikran Marsupial at 21:44 PM on 2 April 2012Yes Happer and Spencer, Global Warming Continues
It will be interesting to see whether Dr Spencer keeps the cubic model fit on his updates of lower trophospheric temperatures once it starts to point upwards again.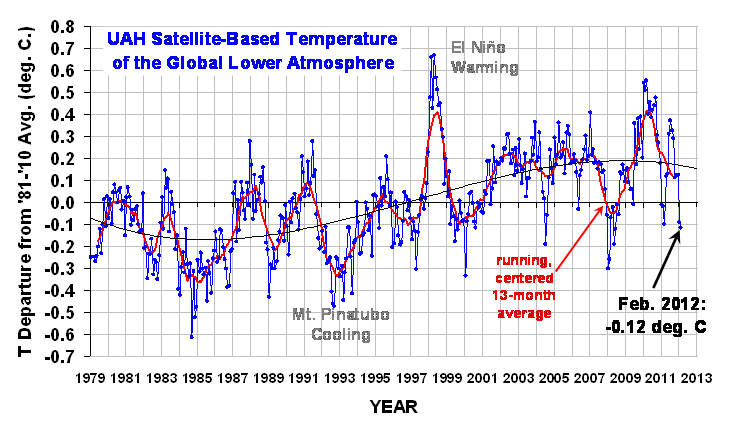 He used to add a caveat that it was just for "entertainment purposes only, and should not be construed as having any predictive value whatsoever.", which he seems to have omitted in his most recent post. Even with the caveat I think this is deeply irresponsible as there are those that will reproduce the figure without the caveat as if it actually meant something (for example, see here and scroll down to the section "Decide for yourself if the trend should be curved ...").
I have to say that fitting models in excel with no attempt to determine their validity or error bars doesn't seem particularly entertaining to me!
He used to add a caveat that it was just for "entertainment purposes only, and should not be construed as having any predictive value whatsoever.", which he seems to have omitted in his most recent post. Even with the caveat I think this is deeply irresponsible as there are those that will reproduce the figure without the caveat as if it actually meant something (for example, see here and scroll down to the section "Decide for yourself if the trend should be curved ...").
I have to say that fitting models in excel with no attempt to determine their validity or error bars doesn't seem particularly entertaining to me!
-
Alexandre at 21:19 PM on 2 April 2012Yes Happer and Spencer, Global Warming Continues
On that series "The Climate Wars", there's a scene where Spencer admits on camera that after they corrected the high profile mistake about those early sattellite measurements, they found a trend going up, "and it has been upwards ever since". I don't know why he brags so much on his blog every year a La Nina comes up. -
Paul D at 21:13 PM on 2 April 2012Yes Happer and Spencer, Global Warming Continues
Further to my comment@3 Also I think leaf pores of plants in some regions tend to shrink with increases in CO2, that results in less water vapour being released and less cooling. http://carnegiescience.edu/news/co2_effects_plants_increase_global_warming_0 -
Paul D at 21:04 PM on 2 April 2012Yes Happer and Spencer, Global Warming Continues
Even if you exclude warming, CO2 is still a pollutant because you are left with ocean acidification. And it seems that Happer has stated that the source is humans burning fossil fuels! Everything can be classed as a pollutant if there is to much of it, to the extent that it changes the environment with a detrimental impact on a species. -
Lanfear at 20:59 PM on 2 April 2012Newcomers, Start Here
@196 I came across the polar shift claim in this documentary at 42:22 forward (3 persons accounts). To me the reference to the mountain peak struck immediately as a question whether it may have been snow-covered (permanently), and if so, has its depth (or height) changed? Sorry, no facts, mere gut feeling, but at least validates that the inuits do seem to have the perception of a change in the earth tilt. -
KevinMacDonald at 18:43 PM on 2 April 2012Yes Happer and Spencer, Global Warming Continues
"some IPCC supporters have been claiming that "extreme weather" has become more common because of more CO2. But there is no hard evidence this is true. After an unusually cold winter in 2011 (December 2010-February 2011) the winter of 2012 was unusually warm in the continental United States. But the winter of 2012 was bitter in Europe, Asia and Alaska." Happer uses examples of five extreme weather events to illustrate his point that there is no "hard evidence" for an increase in extreme weather events. What more proof do we need that his critical faculties desert him when discussing climate? -
barry at 16:53 PM on 2 April 2012Yes Happer and Spencer, Global Warming Continues
First gaph -> for Feb 2002 to Jan 2012 inclusive, are the correct annual values 2002.08 and 2012.08? I'm getting a slightly different result. -
Brandon Shollenberger at 16:37 PM on 2 April 2012Scientist Sets Record Straight on Medieval Warming Research
Tom Curtis, I wasn't aware I would need to provide links for major developments in a paper you promote. (-snip-). However, I'm always happy to provide sources, so here is a link to Gavin's remark. Now then, you claim "to partially test [my] contention" by looking at Mann 2008's SI despite the fact I specifically said the 2009 SI acknowledged my point. (-snip-). In any event, you can find the SI I referenced here. In it, you'll find Figure 8 which shows what I said. The only difference is it removes the four Tiljander series and three other series which aren't relevant to what we're discussing. Finally, you say you think the sensitivity test I mentioned says more about me than the reliability of the work in question, yet that sensitivity test is specifically brought up by Michael Mann. It's even in the abstract of his 2008 paper. The only thing I add to the test he proposes is the removal of uncalibratable (and upside down) data. (-snip-), there is no difference between what I discussed and what Mann himself discussed. It's a strange issue to criticize me over. Incidentally, I don't claim removing 86% of the data is necessary to remove the hockey stick. I only go with that test because Mann himself specifically claimed his reconstruction passed it. And Mann's own work has acknowledged that isn't true. As has Mann's major supporter and friend, Gavin Schmidt. The same thing happens when you remove a much smaller portion of the tree ring data, but I thought it would be best to stick with the points people like Mann and Schmidt acknowledge as true before discussing other issues.Moderator Response: [DB] Please refrain from personal characterizations and stick to the discussion of the science. See the Comments Policy for further guidance. Inflammatory tone snipped. -
Bernard J. at 16:31 PM on 2 April 2012Scientist Sets Record Straight on Medieval Warming Research
To add to the comments about the mediæval warm period, its relative effect, and its extent, it's worth considering the data from Kyoto Cherry Blossom Festival in Japan. The Japanese have kept scrupulous records, extending back for more than a thousand years, that document the commencement of cherry tree flowering. Cherry blossom burst is highly temperature dependent, and Aono et al have carefully collated and analysed the records. The nice thing about the cherry blossom data is that it is a dataset independent of tree rings, and easily understood by the lay person. I commented on the data just over 18 months ago. I'll leave the intersted reader to follow the link for the extended commentary, but the basics are that: 1) cherry blossom data tracks the proxy amalgams of other research groups 2) there is a strong hint that the "mediæval warm period" extended to Kyoto for at least some of the mediæval interval 3) the "mediæval warm period" in Japan was not as warm as are temperatures there now: there is a very distinct "hockey stick" 4) the region around Kyoto appears to be warming relatively more than the global average, as indicated by the comparison of proxies. -
NewYorkJ at 16:11 PM on 2 April 2012Scientist Sets Record Straight on Medieval Warming Research
To me, Brandon's #42 is somewhat of a microcosm of the problems with a certain style of arguments on the topic. The first two paragraphs imply (the logical extension of them) that if we don't know with precision the forcings during every bout of climate change over the life of the planet, we can't have much confidence in our conclusions on the modern rapid warming, particularly if the value of globally-averaged temperature happened to be similar to recent times. This is like saying that if you buy a used automobile with an incomplete service history, you can't have any confidence in being able to diagnose problems. Certainly, it could be useful to have the complete record, with every dotted I and crossed T, but ability to make conclusions based on current and recent observations are hardly diminished, nor is the fact that current and past data (that is available) is entirely consistent with how we know a car engine operates. Sadly, the reliance on relatively simple but compelling non-sequiturs explains why so much effort went into attacking past reconstructions, something that continues today. That reminds me - I need to read Mann's recent book. Probably some better insight there on the matter. But of course, analogies aren't perfect. Neither are proxy reconstructions, or any measurements for that matter. This relates to Brandon's 3rd paragraph. First, as an important background, what does it mean for the MWP to be "warm"? Brandon does not define "truly was warm". Does this mean that there were many regions warmer than their average over the last 1000 years? Not in any real dispute. Does this mean that there were individual proxies or regions equal to or exceeding warmth in the recent period? Not in dispute either - it's even stated in Mann 2009. Does this mean that global mean temperature was warm relative to its average over the 1000 years? Again, not much dispute there that I've seen. Does it mean that global mean temperature was the same or warmer than the recent period? What is the range of the MWP? Some proxies show peak warmth at different times within that period, or sometimes after it. What is the "recent period"? 20th century average? Average of the last 3 decades? Average of the recent decade? Note also that many reconstructions just make conclusions for the northern hemisphere. The arguments put forth bring up a whole host of these questions, not completely covered here, and never sufficiently detailed by those who choose to "over-interpret" proxy data. CO2science.org comes to mind. "Mann tried to erase the MWP" or Watts' definition of Mann's gospel being "there is no MWP" are other phrases that seem to jump out. Erasing what exactly? Some sketchy Lamb proxy from Central England from the 1960's? We end up with a whole series of silly strawman arguments whenever some proxy is found to be, for deliberate carelessness effect, "truly warm". Next, all reconstructions are "wrong" in the sense that they aren't precise or perfect representations, so this isn't a useful term. Past reconstructions have error bars, and they tend to be larger going back further. The early MBH northern hemisphere reconstructions had fairly large error bars from the MWP. Even then, with the most "flat" early reconstructions, the best estimate showed a northern hemisphere temperature relatively higher than, say, 600 years later. The error bars allowed for significant variation. A significantly more pronounced MWP is consistent with these past reconstructions. There are plenty of questions about what exactly qualifies a reconstruction to be a "hockey stick", but that's another matter. Brandon's final paragraph is correct, but not very useful. Valuable in what way? To present a more precise picture of climate events? Or to fool elements of the public (with fallacious reasoning) into believing either global warming isn't a problem, or we just don't have any clue? For scientists, the former. For political hacks, the latter. -
Tom Curtis at 15:51 PM on 2 April 2012Scientist Sets Record Straight on Medieval Warming Research
Brandon Shollenberger @34 objects to using the use of Mann et al 2008 and 2009 because, according to him, the signal disappears if you exclude both all dendroclimactic (tree ring width and tree ring density) proxies and all Tiljander series. Mann et al 2008 used a total of 1,209 proxies, of which 4 where Tiljander series and 1,036 are dendroclimactic series. Removing both leaves just 169 or the original 1,209 proxies series. Brandon thinks it significant that having removed 86% of the data, the signal no longer remains intact. I think that tells us more about Brandon than it does about the reliability of Mann et al 2008 and 2009. However, it is possible to partially test Brandon's contention by consulting the supplementary information of Mann et al 2008, where we find the following chart: You will notice that the reconstruction using just 14% of available data (no dendro) is not significantly different from the full reconstruction, especially using the CPS method. You will also notice that even using the no dendro data set, peak MWP temperatures in the NH are still less then their peak in the 20th century.
On the face of it, therefore, there is no merit in Brandon's claims. As he has provided no supporting evidence, his claims should be dismissed until he supports them with actual data, and actual sited quotes (if he wishes to claim somebodies authority for his position).
You will notice that the reconstruction using just 14% of available data (no dendro) is not significantly different from the full reconstruction, especially using the CPS method. You will also notice that even using the no dendro data set, peak MWP temperatures in the NH are still less then their peak in the 20th century.
On the face of it, therefore, there is no merit in Brandon's claims. As he has provided no supporting evidence, his claims should be dismissed until he supports them with actual data, and actual sited quotes (if he wishes to claim somebodies authority for his position).
-
West129 at 14:58 PM on 2 April 2012Weather records due to climate change: A game with loaded dice
The article “Multi-stability and critical thresholds of the Greenland ice sheet” in Nature Climate Change (2012) doi:10.1038/nclimate1449, appears to be counter productive in that it undermines the level of urgency of actions needed to respond to speculative climate prognosis. Are we indeed trying to mitigate the risk the population could face in 500 years? It looks like we have plenty time to adjust to the situation by then. It suggests that if we are patient and wait long enough the problem might solve itself because with each new report the doomsday is being postponed, and the magnitudes of the changes are shrinking. As to the level of credibility of the report one has to consider the excessive use of what is known as “wavers” in the legal profession: phrases such as “substantial”, “could contribute”, “potentially affect”, “might be” and by stating that the source is “a novel computer simulation of the Greenland ice sheet and the regional climate”. Does that mean if the predictions turn out to be false it is the model’s problem? Who of us would be around by then to say “I told you so”? “..a new study by scientists from the Potsdam Institute for Climate Impact Research (PIK, Potsdam-Instituts für Klimafolgenforschung) and the Universidad Complutense de Madrid. Today, already 0.8 degrees global warming has been observed. Substantial melting of land ice could contribute to long-term sea-level rise of several meters and therefore it potentially affects the lives of many millions of people. …..in the long run humanity might be aiming at 8 degrees Celsius of global warming. This would result in one fifth of the ice sheet melting within 500 years and a complete loss in 2000 years; according to the study .....The scientists achieved their insights by using a novel computer simulation of the Greenland ice sheet and the regional climate. (http://www.pik-potsdam.de/aktuelles/pressemitteilungen/gronlands-eismassen-konnten-komplett-schmelzen-bei-1-6-grad-globaler-erwarmung?set_language=de) -
gepay at 14:36 PM on 2 April 2012Ljungqvist broke the hockey stick
Then I looked at the Ljungquist pdf at http://agbjarn.blog.is/users/fa/agbjarn/files/ljungquist-temp-reconstruction-2000-years.pdf Indeed he does say that when you combine the instrument readings with his proxy reconstruction then the temperatures are higher than in the Medieval warming period. Since there were no instrument readings in the MWP this is comparing apples to oranges n'est pas. Looking at his graph I notice there is a hockey stick around 1700. -
Brandon Shollenberger at 14:20 PM on 2 April 2012Scientist Sets Record Straight on Medieval Warming Research
scaddenp, nobody is suggesting there were no (known) forcings operating during the MWP. Forcings exist at all times. The question is one of magnitude. Consider these two questions: If the MWP could be as warm as current times without anthropogenic influences, how can we explain it? If we don't have an explanation, how do we know the same cause isn't have an influence now? It's also worth pointing out if the MWP truly was warm, it calls into question the manner in which the "consensus" has formed. How could the hockey stick have gotten such prominence if it was wrong (especially if it was critically flawed)? How could so much effort have gone into defending the hockey stick if it is wrong? The point of the MWP isn't that it will overturn AGW. It's that it will provide valuable information. -
dana1981 at 14:18 PM on 2 April 2012500 scientists refute the consensus
gepay, that information would be here. -
gepay at 14:03 PM on 2 April 2012Ljungqvist broke the hockey stick
I looked at the Hadcrut data graph at cru.uea.ac.uk/cru/data/temperature/ and I didn't see a hockey stick. I did see that the temperature is higher for the last 30 years and has leveled off at about 0.35 of a degree higher. -
gepay at 13:56 PM on 2 April 2012500 scientists refute the consensus
where is the confirmation that 97% of climate experts agree the the present warming trend is caused by AGW? where can I find a list of these climate experts? what are the criteria for determining a climate expert? -
scaddenp at 13:44 PM on 2 April 2012Scientist Sets Record Straight on Medieval Warming Research
Whoops! That should read "..no known forcings operating.." -
Brandon Shollenberger at 13:41 PM on 2 April 2012Scientist Sets Record Straight on Medieval Warming Research
scaddenp, if we accept that the idea you mention is "unfounded," and we accept a high MWP, there are only two possible conclusions. One, the current state of knowledge regarding forcings (which ones exist or the ones present in the MWP) is rather lacking. Two, natural fluctuations can be much larger than is currently believed. Whether or not it seems like "clutching at straws" to your mind, those are the only two sensible conclusions. Both cases would have a meaningful impact on our current state of knowledge, and thus it is worth knowing. It's even possible the final result would be climate's sensitivity to certain forcings is larger than expected, and thus global warming is a more serious problem than expected. As for having a "perfectly good explanation with known physics and forcings for today's global warming," that's mostly a non-sequitir. If estimates of climate sensitivity have a range of over two degrees, there is obviously plenty of room for impact. It's important to remember plenty of people don't think a warm MWP would mean AGW was untrue, but would still be important. -
scaddenp at 13:20 PM on 2 April 2012Scientist Sets Record Straight on Medieval Warming Research
Brandon, what I am noting is that the idea that there are known forcings operating in Medieval Period is unfounded. Figure 6.13 in AR4, WG1 notes work on known forcings and also model responses to those forcings at least for the NH. This doesnt resolve questions about SH response nor explain the regional variations in response (though Graham et al would suggest that these are resolvable). The idea that there was some unknown forcing/variability at work at MWP which could also be responsible for modern warming is clutching at straws to my mind. We have perfectly good explanation with known physics and forcings for today's global warming. -
Brandon Shollenberger at 12:59 PM on 2 April 2012Scientist Sets Record Straight on Medieval Warming Research
scaddenp, that's not my contention at all. What I and Gavin Schmidt are discussing is if you remove tree ring data and a few other series (known as the Tiljander series), Mann's conclusions are unfounded. While there are over a thousand proxies used in Mann's paper, it turns out almost all of them are irrelevant to the conclusions regarding the MWP. The only things which matter are the uncalibratable Tiljander series (which were used upside down) and tree ring data. The other series may be fine or not, but they aren't the source of the signal, so to speak. As for natural/unforced variability, I was referring to natural variability as I presume there would have been some sort of forcing involved. However, it would be understandable to think natural fluctuations play a larger role if we don't know of any forcing which could have caused the MWP. As for modeling, that's an important point. The argument would be if the MWP was warm (and not limited to a few regions), and we can't explain it, it should cause some doubt as to the explanations we have. -
John Hartz at 12:47 PM on 2 April 2012Scientist Sets Record Straight on Medieval Warming Research
Here's my very first public prediction. Within a decade, today's hotly debated issues surounding the "Medieval Period" will be nothing more than a footnote in disussions of manmade climate change. -
scaddenp at 12:45 PM on 2 April 2012Scientist Sets Record Straight on Medieval Warming Research
Also, I note support for Mann 2009, in Graham et al 2010 which makes interesting reading. Also, Brandon, by "natural variability" do you mean "unforced variability"? Modelling does not support this idea. -
scaddenp at 12:33 PM on 2 April 2012Scientist Sets Record Straight on Medieval Warming Research
Brandon, interesting. However, I am puzzled by this: "Specifically, it is entirely dependent upon tree ring data and uncalibratable data (which was used upside down)." The list of proxies in the supplementary data includes many different types of proxies. Is it your contention that these other proxies (spelotherms, icecore, coral etc) are "uncalibratable"? -
Brandon Shollenberger at 12:01 PM on 2 April 2012Scientist Sets Record Straight on Medieval Warming Research
Like Tom Curtis, I think criticisms of Anthony Watts in this topic are unfounded, and I think it's incredible nobody has retracted any of them. However, I am dismayed by Curtis's decision to offer Mann 2009 as evidence to contradict a position. Mann 2009 is based on the same analysis as Mann 2008 was, and this means it suffers from the same problems. Specifically, it is entirely dependent upon tree ring data and uncalibratable data (which was used upside down). This point was even acknowledged by Gavin Schmidt: Note too that while the EIV no-dendro version does validate to 1000 AD, the no-dendro/no-Tilj only works going back to 1500 AD (Mann et al, 2009, SI). In fact, the Supplementary Information for Mann 2009 acknowledges its dependency on that data. Given this dependency directly contradicts Mann's 2008 paper, it seems peculiar to offer either paper as evidence of anything to do with the MWP. Incidentally, unlike BaerbelW's representation @18 and Dave123's representation @20, there are many people who believe a high MWP is important not because it disproves AGW, but rather, because it indicates natural variability may play a larger role than is commonly believed. -
Paul Magnus at 09:37 AM on 2 April 2012Weather records due to climate change: A game with loaded dice
Michael.M at 02:23 AM on 1 April, 2012 "loaded Dice" Not only is the dice getting high values but we could also be seeing lower values lobbed off. Thus we may enter a state where we have what we consider extreme weather now as the norm, where chaos rains. I suspect things might get a bit like that as the current injection of GHG is like none before or pretty much so. It is going to be a wild ride. -
Tom Curtis at 09:08 AM on 2 April 2012Scientist Sets Record Straight on Medieval Warming Research
NWJ @30, I agree that citing junk material without debunking it is unjustifiable. I just think it is a shame that was not the focus of the criticism of Watts. On that point he clearly has no leg to stand on, and cannot plead that he or the paper is being misinterpreted. -
Tom Curtis at 09:05 AM on 2 April 2012Scientist Sets Record Straight on Medieval Warming Research
shoyemore @31 makes an interesting point about nomenclature. Things are a little more confused than he suggests however. For a start, historians do refer to Medieval Japan (1185-1600), Early Medieval China (220-589 AD), and Medieval India (1206?-1596 AD). However, Shoyemore is correct that there is no medieval Brazil, or New Zealand. I believe that only societies developing a feudal organization with a late iron age physical culture can be said to be medieval. Clearly these various medieval periods overlap, but are not synchronous, so naming a purportedly global phenomenon after its near synchronous timing with the european high medieval period is, therefore, eurocentric at the least. However, renaming the MWP the Little Climactic Optimum or the North Atlantic Climactic Optimum is of dubious merit. One well established feature of the period 900-1500 AD is a series of very long, strong La Nina like conditions in the Eastern Tropical Pacific. It follows that, at a minimum the ETP was unusually cool over that period (and the WTP unusually warm). These are not North Atlantic conditions, and nor were the La Nina like conditions climactic optimums either in the ETP or in some effected areas. Similarly evidence exists of persistent cold conditions in Russia at this time. This mix of persistent warm and persistent cold conditions in various distinct parts of the globe indicate that the best name is a Climate Anomaly, and absent any convenient global name for the period, the Medieval Climate Anomaly will have to serve (Eurocentric though it is). Unfortunately, while more accurate, that choice of names will involve us in a fruitless rhetorical debate that the fake "skeptics" prefer so much to discussing science. Hence I'll stick with MWP for now. -
Joel_Huberman at 08:19 AM on 2 April 2012Weather records due to climate change: A game with loaded dice
James Hansen has also used the loaded dice metaphor. One can find an article called "Perceptions of Climate Change: The New Climate Dice" here in PDF format. It was posted to his web site on January 5, 2012. -
Eric (skeptic) at 08:13 AM on 2 April 2012Falling Cloud Height In the Last Decade: Is It Just ENSO?
I think this is a good article and underscores the role of the natural variability of the Pacific in particular as its periodic heat flows poleward. The global average of cloud height will likewise be strongly influenced by ENSO, but the secular trend outside of the ENSO variation is unmistakable.
-
shoyemore at 08:07 AM on 2 April 2012Scientist Sets Record Straight on Medieval Warming Research
"Medieval" as an adjective applies only to European Middle Ages, which lasted roughly from the end of the Roman Empire (5th century AD) to the Renaissance (15th Century AD). The Discovery of America by Columbus in 1492 is generally considered the end of the Middle Ages, and the start of the Early Modern Period. But you will not hear any historians talk about "Medieval New Zealand", or "Medieval Brazil". So "The Medieval Warm Period was a Global Phenomenon" makes as much sense as saying "The 14th Century Black Death was a Global Phenomenon". Both statements have some meaning, but is very imprecise, and needs further explanation. There was always evidence for what I have seen called the "Little Climatic Optimum" in the North Atlantic from 950 to 1250AD. I think it was H.H.Lamb of CRU who first used the term Medieval Warm Period in print. Lamb meant Europe only, as he displayed a chart with temperature records from England. There should be some effort to stop using the term Medieval Warm Period. I think North Atlantic Climatic Optimum should be used for the 95-1250AD period with warm temperatures, to emphasise there there is no evidence that it extended worldwide. To confuse matters, deniers grab published temperatures from places like China at a time other than 950-1250AD, and annex them to the "Medieval Warm Period". The same consistency should apply to the Little Ice Age. However, I fear that the term Medieval Warm Period is too embedded in the consciousness to be changed. -
Tom Curtis at 08:04 AM on 2 April 20122nd law of thermodynamics contradicts greenhouse theory
Steve Case @1404, the back radiation comes from a variety of frequencies, mostly associated with H2O emissions. Typically it is close to the surface temperature in brightness temperature. Globally averaged the back radiation has an effective brightness temperatures of 277 degrees K, compared to the globaly averaged effective brightness temperature of 289 degrees K for the upward surface radiation. Seeing we are into nitpicks at the moment, in some circumstances the overlying atmosphere is warmer than the surface so that it does warm the surface even in your use of the term. More importantly, the IR radiation from the atmosphere is absorbed at the surface causing an increase vibrational or translational motion in the absorbing molecule, which vibrational and translational motion is called heat. In the popular vocabulary, that means the atmosphere heats the surface. It is true that the surface radiates energy, and hence cools faster than the atmosphere can heat it, but that is almost irrelevant to the choice of terms. It is only "almost irrelevant" because some physicists have defined "heat" to mean "the net transfer of thermal energy" by which definition "heat" can only mover from the hotter to the colder body, and having moved ceases to exist (although the thermal energy doesn't) because heat only exists when thermal energy is being transferred. In so doing they have defined the term so that it is strictly inconsistent with popular usage of the term (causing endless confussion), and indeed, strictly inconsistent with the usage of the term by the greats of thermodynamics including Lord Kelvine, Rankine, Clausius etc. Any "2+2=5 thinking" as you put it, can be avoided by being aware that in the popular meaning of the term "to heat", the second law of thermodynamics must be stated as, "Net heat flow can only proceed from a warmer to a cooler body". -
Eric (skeptic) at 07:40 AM on 2 April 2012Weather records due to climate change: A game with loaded dice
The clearest global warming contribution IMO is the pervasive although dispersed warmth added to the natural patterns which happened to be warm here this winter. The midwest and NE extreme records would not have happened without the unusually mild winter (even considering the La Nina pattern). The extreme warm event required prolonged mildness, lack of snow, warm ground, and warm lakes. Only then can the 40F or more above normal occur. As for pattern changes, the predictions are not settled. A decade ago or so the thinking used to be strong polar jet and less meridional flow as we saw this past winter. More recent pattern predictions are somewhat different. I would not attribute the winter or March pattern to GW. -
funglestrumpet at 07:33 AM on 2 April 2012Weather records due to climate change: A game with loaded dice
Articles such as this one contribute to a body of evidence that shows beyond doubt that climate change, regardless of its cause, is a bad thing and the sooner we act to reverse it, the better. [snipped] What I suspect will happen is that Rahmstorf and his team, not to mention the IPCC, will continue to publish more and more press releases and papers showing ever more clearly that we really have to fight climate change ever more urgently while the likes of the Daily Mail editor and Rupert Murdoch and the rest of the motley crew [snip] will continue to enjoy their freedom and carry on as they are, while we quietly creep past tipping point after tipping point until it is too late to do anything other than rearrange the deck chairs. Pity they had to build a swimming pool for the Olympics – wait a few years and the whole Olympic arena will be one huge swimming pool. How’s that for a legacy? And, as Ramstorf has shown, we can expect more extreme weather events, so if an extreme low coincides with a perigee spring tide, we might get that legacy sooner than many expect.Moderator Response: TC: From the comments policy: No accusations of deception. Any accusations of deception, fraud, dishonesty or corruption will be deleted. This applies to both sides. Stick to the science. You may criticise a person's methods but not their motives. No profanity or inflammatory tone. Again, constructive discussion is difficult when overheated rhetoric or profanity is flying around. -
Chris G at 06:45 AM on 2 April 2012Weather records due to climate change: A game with loaded dice
I've been watching the heat wave in the American Midwest, and I've seen reports that it is being caused by a blocking high, which is in turn a result of a jet stream loop. I'm thinking that the locations of the jet streams are really governed by where the Hadley, Ferrel, and Polar cells meet, and those locations are broadly governed by energy in the atmosphere that has to be lost through radiative processes. If I'm right so far, then the pattern and location of the heat waves and other weather patterns is very much affected by GHG content. I'm thinking that the loaded dice analogy is good for an introduction to the concept (whether a 1-6 die is loaded, or if the die becomes a 1-7, 2-7, whatever), but the analogy is simplified in the sense that it gives the naive reader the impression that the distribution of extreme events will be uniformly random, and I am thinking that the distribution of anomalous events has a poleward skew. Heat waves common to Mexico start to happen more frequently in Texas. Monsoons that used to hit south/central India start to shift to northern India and Pakistan, where the infrastructure is not built for it, etc. -
william at 06:11 AM on 2 April 2012Weather records due to climate change: A game with loaded dice
Does anyone know what the delay is between the push to the Gulf Stream (ice freezing in the far north Atlantic) and the response (Gulf Stream getting up to speed). As the freezing period gets shorter and the melting period longer, what would happen if we ended up with a 6 month cycle. We would have a strong Gulf stream in the summer giving high temperatures and heavy rainfall and a weak Gulf Stream in the winter causing extreme cold. http://mtkass.blogspot.co.nz/2012/03/pulsating-climate.html -
Rob Painting at 06:07 AM on 2 April 20122nd law of thermodynamics contradicts greenhouse theory
Increased back radiation (from increased levels of greenhouse gases) heats the ocean by altering the thermal gradient in the 'cool skin' layer of the sea surface. See SkS post: How Increasing Carbon Dioxide Heats The Ocean. It's true that back radiation doesn't penetrate into and heat the ocean but, by reducing the loss of heat to the atmosphere through conductivity, the oceans store more energy from the sun and therefore become warmer. That's why the ice core records show a strong relationship (correlation) between CO2 and global temperature:
-
NewYorkJ at 04:07 AM on 2 April 2012Scientist Sets Record Straight on Medieval Warming Research
Watts: the authors at Syracuse themselves are under pressure because the alarmosphere has gone ballistic over the possibility that Mike Mann’s “there is no MWP much less global” gospel might be challenged Watts: What’s your point? That the author is now tap dancing? No doubt he was given a talking to. That's one way to avoid admitting error - imply the author's statements to correct obvious widespread mangling of his work are not sincere - that he is the one spinning his own work because of some shadowy pressure from somewhere. These claims alone are disgraceful. Can someone enlighten me as to what this "there is no MWP" gospel is that Watts speaks of? Published work (ex. Mann 2008, Mann 2009) appears to show otherwise. Does Dr. Mann not follow his own gospel? Tom Curtis: Had Watts himself supported the Mail Online's claims, he would have no refuge to hide in. Citing junk material without critique is simply irresponsible. While issuing an update on the same post 3 days later might seem redemptive, the vast majority of readers won't see it. That's part of their general communication strategy: shoot first ask questions later, and make sure those questions are answered quietly. -
Steve Case at 03:07 AM on 2 April 20122nd law of thermodynamics contradicts greenhouse theory
I wrote on the other thread: 33. Steve Case at 12:03 PM on 1 April, 2012 Tom Curftis #31 Wrote … Science of Doom has an extensive discussion of the difference of the ocean's response to heating by solar radiation and back radiation … I suppose this will be considered nit picking, but back radiation from the cooler atmosphere doesn’t do any heating of the ocean. It does slow the cooling of the ocean by canceling out part of the spectrum, but it’s the sun that does the actual heating and reestablishment of equilibrium. Yes, the effect is the same and it’s perhaps just semantics, but claiming that back radiation heats the ocean leads to erroneous thinking. Moderator Response: [DB] Your statement about back radiation is off-topic on this thread. Any who wish to respond to it please do so on a more appropriate thread. Thank you. So here I am and I find this right away:- 12. Daniel Bailey at 12:01 PM on 20 September, 2010
...The downward radiation adds to the energy received from the sun and heats up the surface of the earth more than if this downward radiation did not occur.
...
It simply means more energy flows from the warmer surface to the colder atmosphere than in the reverse direction.
-
Riccardo at 02:29 AM on 2 April 2012Skeptical Science hacked, private user details publicly posted online
TOP you wrote "[...] and yet it has previously been pointed out that the attack came from Russian hackers [..]". You were wrong then and again know. I'm sure you understand that saying that the file was on a russian server doesn't mean that the uploader is russian too. And andylee made a few more or less realistic suppositions based essentially on nothing but what is generally common over the internet. In any case, as per Moderator's comment, it was a hack and I'm sure you wouldn't say that it's your fault if someone breaks into your house, you'd correctly call it a theft.
Prev 1202 1203 1204 1205 1206 1207 1208 1209 1210 1211 1212 1213 1214 1215 1216 1217 Next


