


 Arguments


Recent Comments
Prev 1204 1205 1206 1207 1208 1209 1210 1211 1212 1213 1214 1215 1216 1217 1218 1219 Next
Comments 60551 to 60600:
-
Dave123 at 13:22 PM on 30 March 2012Falling Cloud Height In the Last Decade: Is It Just ENSO?
I don't have the reference immediately available but there's something out there pre-publication that says that clouds 'droplet' or 'drizzle' components has been underestimated compared to what is measured, and cloud's positive feed back is underestimated therefor in climate models. Wish I could remember where I saw it. -
muoncounter at 12:50 PM on 30 March 2012It's the sun
Philippe - does this mean that down-welling IR can be measured? But if the GHE doesn't exist, how can that be possible? Interesting that they're seeing >300 W/m^2 with an air temperature of 40F. That's after a couple of days of high humidity and relatively low solar input - it's been cloudy. Could clouds be a positive feedback? Note- the linked figures are for 3/23-3/30. They may change to keep current. -
muoncounter at 12:35 PM on 30 March 2012Solar Cycle Length proves its the sun
Solheim, Stordahl and Humlum 2012 (the paper under discussion since this comment) find a negative correlation between solar cycle length (SCL) and temperature change. Shouldn't we look to see if this correlation is consistent? Referring to Figure 1 from this paper, the graph posted here, the early cycles (1680-1790) are shorter. This was the guts of the Little Ice Age, so short cycles -> cooling. However, Vaquero and Trigo 2012 report an interesting point: We have reconstructed the SCL (average duration of 10.72 \pm 0.20 years) during the MCA using observations of naked-eye sunspot and aurora sightings. Thus, solar activity was most probably not exceptionally intense ... Looking again at the graph, 10.7 years would be very comfortable during those LIA years. However, the Medieval Climate Anomaly (MCA) was a warm period - indeed, in its former identity as the MWP, it is the warm period vital to so manydenia'skeptic' arguments. So once again, a so-called 'skeptic argument' - solar cycle length - runs both hot and cold. It can be used to justify warming and cooling, as needed to suit the needs of the moment. -
scaddenp at 12:16 PM on 30 March 20122nd law of thermodynamics contradicts greenhouse theory
BernardB also seems to think backradiation leads to a runaway (meltdown). Positive feedback != runaway. Moving the cooler to vacuum (so convection taken away - as well as most of the effectiveness of the heatsink), and you have a situation close to the one discussed at Science of Doom. Ie two stars side by side. However Science of Doom does the maths. You could do the same for the heatsink and see how much difference the backradiation makes. -
Tom Curtis at 11:33 AM on 30 March 2012Solar Cycle Length proves its the sun
BernarB @25, see here. -
Tom Curtis at 11:33 AM on 30 March 20122nd law of thermodynamics contradicts greenhouse theory
BernardB @9:30 AM, March 30th on the Sun Cycle Length page asks why heat sinks on electronic components work if back radiation warms the surface. Supposedly the "back radiation" between opposing fins in the heat sink would result heat simply being recycled in the unit. At a minimum, BernardB's reasoning is specious on the minimal grounds that the heat sink will still radiate thermal energy away from itself. It is true that the effective surface area for a heat sink relying purely on thermal radiation for cooling would be no larger than that of a solid box of the same dimensions, but that surface area is still much larger than that of the CPU (or other electronic component) the heat sink is designed to cool, and the the emissivity of the heat sink is potentially much higher than that of the chip. Consequently a heat sink provides significant gains in cooling relative to the computer chip by itself even if forced to rely exclusively on thermal radiation. In space, that cooling by thermal radiation would be more efficient provided it is not exposed to direct sunlight. That is because on Earth, within the computer casing the heat sink is exposed to back radiation of approx 390 W/m^2 in all directions from bodies at the ambient surface temperature. In space the "back radiation" when not exposed to direct sunlight is effectively at the temperature of the cosmic background radiation of 2.7 degrees K, or about 3 millionth of a Watt per meter squared. In practice that means the heat sink would radiate heat away at 390 W/m^2 faster than would an equivalent heat sink on the Earth's surface. More fundamentally BernardB is neglecting the fact that heat sinks work be convection. The air (or other fluid medium) between the fins is heated up primarily by contact with the fins. Because the it is then warmer, it then rises carrying the heat away far more efficiently than would radiative transfer. Because the initial transfer of heat is by conduction, the greater the surface area the greater the heat, hence the fins, which are always (or nearly always) oriented vertically for improved convective flow. With large modern PCs, even this process is insufficient and fans are placed above the heat sink to force the airflow greatly increasing cooling efficiency. The presence of the fan noise you can almost certainly hear as you read this is proof that BerarnB's understanding of the operation of heat sinks is faulty.
An exception to the use of fans is found in some modern PCs which are filled with oil. The greater heat capacity of oil relative to air allows convection to continue to cool the heat sinks effectively, thereby eliminating noise and saving on power (and CO2 emissions). For more on the operation of heat sinks, see here and here. For more on oil filled computers, see here.
With large modern PCs, even this process is insufficient and fans are placed above the heat sink to force the airflow greatly increasing cooling efficiency. The presence of the fan noise you can almost certainly hear as you read this is proof that BerarnB's understanding of the operation of heat sinks is faulty.
An exception to the use of fans is found in some modern PCs which are filled with oil. The greater heat capacity of oil relative to air allows convection to continue to cool the heat sinks effectively, thereby eliminating noise and saving on power (and CO2 emissions). For more on the operation of heat sinks, see here and here. For more on oil filled computers, see here.

-
barry at 10:47 AM on 30 March 2012Falling Cloud Height In the Last Decade: Is It Just ENSO?
Rob, I'm a bit confused - the SMH article and the michael's piece are about the work done by the two NZ researchers, Davies and Molloy, but you write,The mainstream media, and 'skeptic' climate scientist Pat Michaels have jointly assumed the role of Chicken Licken and have likewise grossly misinterpreted a recent paper by two Auckland University researchers, Loeb (2012), Laken (2012)(not yet published) and Erlykin and Wolfendale (2010).
Have you edited out some text there? -
Philippe Chantreau at 10:46 AM on 30 March 2012It's the sun
"We can, when standing at the Earth surface, empirically measure longwave IR backradiation from the atmosphere, and there are posts on this site and elsewhere documenting this." Indeed composer. Martha's Vineyard Coastal Observatory, for instance has an hourly (I think) updated graph of downwelling IR. Just click on the link to Infared radiation. Simple as that. Considering there is always some level of IR, even at night, the GH effect deniers have some seriously contorted explaining to do. No doubt that some will try. I'm waiting for Bernhard's words on these observations. -
Solar Cycle Length proves its the sun
BernhardB - Actually, the appropriate topic for your argument is the interminable Greenhouse effect and the 2nd Law thread. This is one of the classic 'skeptic' arguments, demonstrating serious shortcomings in physics knowledge, that quite frankly makes 'skeptics' look bad. Some have realized this - for example both Fred Singer and JoNova have weighed in, pointing out that this is a bad argument, and reflects (backradiates?) rather poorly on skeptics in general. -
Composer99 at 10:05 AM on 30 March 2012It's the sun
With regards to a comment by one BernhardB here, I am linking to this thread where it is more on topic (at least, I suspect so - if there is a better thread please do point it out). As a response, Bernhard, I am no physicist, but I would say this: We can, when standing at the Earth surface, empirically measure longwave IR backradiation from the atmosphere, and there are posts on this site and elsewhere documenting this. Just as we can empirically measure from orbiting satellites the effect heat-trapping (aka greenhouse) gases in the atmosphere have on outgoing longwave IR. I'm only marginally aware of what a heat sink for a power transistor is, but I gather from your derisive line Then I would like to know why the fins on power transistor heat sinks don`t "back radiate" each other into a China Syndrome melt down. that melt downs are not a common occurence among them. As such, I would suspect the issue is not with either power transistors, their heat sinks, or observed longwave IR backradiation. I would not be surprised if one of the more physics-educated commenters here has more to say. -
Composer99 at 09:57 AM on 30 March 2012Solar Cycle Length proves its the sun
BernhardB: The thermometer on the upper right hand sidebar has the most common pseudoskeptic arguments, and includes "It's the Sun" which I suspect is strictly speaking a more appropriate thread for your comment since it appears to deal with the Sun in a more generic fashion. This post & comment thread is to do with the Friis-Christensen 1991 paper and further topical research. As such your comment appears to be off-topic for this thread. -
BernhardB at 09:17 AM on 30 March 2012Solar Cycle Length proves its the sun
If it`s not the sun, was it a "positive back radiation feedback" as explained by Roy Spencer and used in the "Trenberth Energy budget"? Then I would like to know why the fins on power transistor heat sinks don`t "back radiate" each other into a China Syndrome melt down. The configuration to do so is even better than Roy Spencer`s "thought experiment". Here is a comparison: http://askbernhard.9f.com/ -
John Hartz at 08:46 AM on 30 March 2012Monckton Misleads California Lawmakers - Now It's Personal (Part 1)
funglestrumpet: Given the sparse turnout for Monckton's presentations, there's no need for SkS to make him the center of our attention. He's just a babbling brook in a very large forest. -
scaddenp at 08:10 AM on 30 March 2012Medieval Warm Period was warmer
Perhaps time to look closely the supplementary material? here (rather more proxies, and note the sensitivity tests). Note that the AR4 predates this paper too. -
muoncounter at 07:28 AM on 30 March 2012Solar Cycle Length proves its the sun
tompinlb You've clearly misread both the figures and the authors' Table 1. The trends are given in degrees per 100 years, not degrees per decade. Svalbard and Archangel are the only stations analyzed that give a reasonable northern hemisphere temperature trend (1.6 and 1.4 degrees per 100 years, respectively). "The stations selected by the authors show rates of change well in excess of the HadCRUT average." Comparing a few tightly clustered stations with the entire northern hemisphere HADCRUT is the specious argument. Running the HADCRUT trend back as far as 1850 when Svalbard begins in 1910 is the specious argument. Drawing conclusions from such weakly defined trends as are shown in the center panels of figures such as those shown here is the specious argument. Perhaps you should review the long list of the papers shown here. For example, Benestad 2005: ... further comparison with the monthly sunspot number, cosmic galactic rays and 10.7 cm absolute radio flux since 1950 gives no indication of a systematic trend in the level of solar activity that can explain the most recent global warming.” Laut 2004: Analysis of a number of published graphs that have played a major role in these debates and that have been claimed to support solar hypotheses shows that the apparent strong correlations displayed on these graphs have been obtained by incorrect handling of the physical data. Thejll and Lassen 2000: ... since around 1990 the type of Solar forcing that is described by the solar cycle length model no longer dominates the long-term variation of the Northern hemisphere land air temperature. Finally, any prediction based on cycle analysis without an underlying physical mechanism is specious, which Google defines as "superficially plausible, but actually wrong." -
Phil M at 07:27 AM on 30 March 2012Skeptical Science hacked, private user details publicly posted online
John@126 Yeah, figure of speech ;) -
John Hartz at 07:18 AM on 30 March 2012Skeptical Science hacked, private user details publicly posted online
@Phil M: The SkS author team is unlikely to catch the perp. We're relying on Interpol to do so. -
funglestrumpet at 07:04 AM on 30 March 2012Monckton Misleads California Lawmakers - Now It's Personal (Part 1)
Let's put a great big digital clock counting the days we have waited in pregnant expectation for Monckton to issue a rebuttal to Peter Hadfields debunking of great swathes of his presentation material. If we put it somewhere prominent on the home page, no one visiting this site is going to let it slip their memory. If it were to contain links to Professor Abraham's excellent work as well as all of Peter Hadfield's extensive Monckton catelog, then it would ensure that old and new alike were properly informed as to the veracity of the English nobleman's presentation material. Build up a head of steam on the issue and Monckton will face a growing voice of well informed critism during his Q & A sessions and who knows what that might bring, all things considered. -
Philippe Chantreau at 06:49 AM on 30 March 2012Solar Cycle Length proves its the sun
tompinlb says "It would seem likely there are mechanisms, that are not yet understood by science, which operate to amplify changes in the solar forcings." These are called feedbacks and there is a sizeable litterature on the subject to say the least. They also have been abundantly discussed on SkS. If such mechanisms exist, why would they not also amplify other forcings than solar? Could they be selective as to the nature of the orignal forcing? How would that be possible? I note that tompinlb was recently arguing against the existence of the possible signature of a major feedback that certainly would be involved in amplification of solar changes (the tropospheric hot spot, possible evidence of water vapor feedback). -
geoffchambers at 06:47 AM on 30 March 2012Skeptical Science hacked, private user details publicly posted online
John Mason #126 Thanks for the explanation. Yes, I believe you were polite, but rocks aren’t really my thing. The person I’d be interested in engaging with was the one who accused me of paying Exxon to let me troll for them. How did he know?Moderator Response: [Dikran Marsupial] Please can we keep the discussion as good natured as possible, note the comments policy forbids inflamatory comments, and this thread could easily head in that direction if we are not carefull. Please can the discussion be confined to the issues rather than those taking part in the discussion. -
Dikran Marsupial at 06:33 AM on 30 March 2012Solar Cycle Length proves its the sun
tompinlb Your last paragraph suggests that decadal scale forecasts are meaningful, however it is widely known that the internal variability of the climate (due to things like ENSO) is large compared to the expected trend due to GHGs, and I would expect also of solar influences. Making forecasts for station data is even less practical as the spatial averaging greatly attenuates the variance. If you want to suggest that the models lack forecasting skill, then you need to provide evidence that this is the case, rather than just boldly state it as a fact. Where there is suficient "test data", then the models perform pretty well (e.g. Hansen's original projections) Regarding your question "Is it not the case that over the last decade actual temperatures have increasingly diverged lower than the IPCC forecasts, all the while CO2 has been increasingly steadily?" This is a question that has been absolutely done to death. If CO2 were the only forcing and the internal variability of the climate were small, then yes it would be a surprise to see a lack of warming while CO2 levels are rising. However, neither of these assumptions are valid. Further discussion of this should be directed to a more appropriate thread, e.g. Global warming stopped in 1998 I offer this as well intentioned advice: You appear to be labouring under a number of misunderstandings about climate and model projections. Please before you post arguments, check what has already been discussed on these topics by reading the relevant posts on SkS. The list of most used climate myths at top left of the page would be a good place to start. -
ajbmilne at 06:29 AM on 30 March 2012It's CFCs
Lu has published another related article: http://journalofcosmology.com/QingBinLu.pdf Any comments on it, or on his claim that CO2 traces and temperature traces don't match for the years 1850-1930 or for his reported CO2 concentrations of 285-310 ppm? It seems to be in contradiction to other data on this site: http://www.skepticalscience.com/pics/Comparison.png Forgive me if these are questions that have been answered before, I'm new to the site. If they have been answered I'd appreciate being pointed to them. -
scaddenp at 06:16 AM on 30 March 2012Solar Cycle Length proves its the sun
tompinlb - there is absolutely no doubt that the climate responds to changes in solar activity and that solar has been major influence in the past. The problem with the solar explanation for current warming is that the solar signal is more or less flat, unlike the past. Solar proponents ask us to believe that a warming comparable with holecene climatic optimum in NH is happening in both hemispheres but without the same solar signal. The signal is consistant with GHG forcings and completely out of scale to other mechanisms. Furthermore, there is the problem of explaining why the measured increase in GHG forcing somehow is not involved in the warming. Do you have a problem with the instruments doing the measurements? The idea that actual temperatures have "increasing diverged" from IPCC models is just denialist posturing. Some detail can be found here. Furthermore the Rahmstorf and Foster paper reveals the signal more clearly when natural variation is removed. While the natural variation estimates are indeed curve-fitting, the scale of change in the natural forcing considered (temperature diff compared to change in energy), is believable from physics point of view (unlike humlum's effort). -
tompinlb at 05:25 AM on 30 March 2012Solar Cycle Length proves its the sun
Doug H@19. Sorry for the transcription error, I put the decimal point in the wrong place. The statement should have read, "The average for HadCRUT3N in this same table is shown as 0.047 degC per decade," so the Archangel Russia change of 0.14 degC per decade is 300 percent of the HadCRUT3N number. That is why it is specious to accuse the authors of selecting only stations that show little heating. The conundrum I see is this. There are many historic paleoclimate studies that show strong correlation between various records of solar activity and temperatures from many places on earth, from the tropics to the poles. The relationship between solar activity, as evidenced by sunspot counts, and cold temperatures in the Maunder, Dalton, etc. minima appear to be clear. The advocates of anthropogenic warming argue that solar influence is minimal because total solar insolation does not vary greatly. It would seem likely there are mechanisms, that are not yet understood by science, which operate to amplify changes in the solar forcings, otherwise how could the paleoclimate relationships between solar activity and global temperatures be so strong. If the evidence presented in this paper is not satisfactory, what would constitute "satisfactory evidence to support the allegation," as you say. Why do you conclude that "the apparent correlation is a curio, not more," and then compare it again to hemlines. The authors are making specific forecasts that temperatures will be cooler in the next solar cycle at these stations. Do the IPCC suite of climate models predict that it will be warmer in the next solar cycle? It is the case, is it not, that the IPCC models project major warming in the northern regions such as the Norway sites that are studied by these authors. I understand the IPCC models lack skill in making forecasts of future temperatures (as opposed to hindcasts, which anyone can do), which may be a function of poor parameterization of critical factors such as clouds and soil moisture, among others. Is it not the case that over the last decade actual temperatures have increasingly diverged lower than the IPCC forecasts, all the while CO2 has been increasingly steadily? Thanks for your insights. -
John Hartz at 05:17 AM on 30 March 2012Katharine Hayhoe's labour of love inspires a torrent of hate
Suggested reading: “For Katharine Hayhoe, Climate Change Not a Leap of Faith”, Climate Central, Mar 29, 2012 -
climatehawk1 at 05:04 AM on 30 March 2012Monckton Misleads California Lawmakers - Now It's Personal (Part 1)
Here's the old Monckton bio with the Nobel Laureate information: archived Monckton bio -
r.pauli at 04:53 AM on 30 March 2012Monckton Misleads California Lawmakers - Now It's Personal (Part 1)
Monckton now embodies a tactical change in strategic denialism - the science arguments are being abandoned - to more acts of distraction and diversion. Ideologue to demagogue. -
Riccardo at 04:29 AM on 30 March 2012HadCRUT3: Cool or Uncool?
Tom we know that natural forcings, including solar, are able to explain much of the temperature change from about 1900 to 1950. We also know that the first about 100 m of ocean are well mixed on a yearly time scale, so I do not expect to see any difference in a 150 m ocean slab like in the SoD exercise. My speculation was about some other complex effect involving ocean circulation. Here is where our explanations meet. -
Tom Curtis at 03:47 AM on 30 March 2012HadCRUT3: Cool or Uncool?
Ricardo @28, Science of Doom has an extensive discussion of the difference of the ocean's response to heating by solar radiation and back radiation (substituting for the greenhouse effect). He gets down to the nitty-gritty in the fourth post in his series where he reports on a model analyzing the two cases: In each case, the reported value is the average daily temperature for that layer in the model. The reason for the difference in the value of the forcing is that DLR operates 24/7, while solar is only present for approximately 12 hours of each day, with much reduced strengths in morning and evening. The values are chosen so that the total additional energy supplied is the same.
SOD comments:
In each case, the reported value is the average daily temperature for that layer in the model. The reason for the difference in the value of the forcing is that DLR operates 24/7, while solar is only present for approximately 12 hours of each day, with much reduced strengths in morning and evening. The values are chosen so that the total additional energy supplied is the same.
SOD comments:
"Now because the 4 year runs recorded almost identical values for solar vs DLR forcing, and because the results had not quite stabilized, I then did the 15 year run and also recorded the temperature to the 4 decimal places shown. This isn’t because the results are this accurate – this is to see what differences, if any, exist between the two different scenarios. The important results are: DLR increases cause temperature increases at all levels in the ocean Equivalent amounts of daily energy into the ocean from solar and DLR cause almost exactly the same temperature increase at each level of the ocean – even though the DLR is absorbed in the first few microns and the solar energy in the first few meters The slight difference in temperature may be a result of “real physics” or may be an artifact of the model"
As the slight differences amount to hundreds of a degree or less after fifteen years, I think we can agree that they are inconsequential, at least as an explanation of the change in the difference in the land and ocean temperature anomalies. Personally I think there is a simpler explanation. If global temperatures changed due to a temperature oscillation in the ocean, there would be no lag in ocean temperatures (by definition) and virtually no lag in land temperatures due to the low thermal mass involved (in relative terms). In contrast, a forced change will result in a change in the difference as the land, with its low thermal mass responds faster. A negative forcing will result in the difference in the anomalies falling, while a positive forcing will result in it rising. Looking at the plots above, it becomes apparent that there was a positive forcing from approximately 1890-1920, a weak negative forcing from 1930-1970, and a positive forcing significantly stronger than any previous sustained forcing on the record from 1970 to the present. The analysis is complicated in that a period of no forcing will result in the difference in the anomalies relaxing back to zero. Further, this analysis is qualitative rather than quantitative, and necessarily so without detailed model work. Never-the-less I would consider the information above prima facie evidence that the mid century temperature peak was at least in part non-forced. I base this claim on the fact that the difference in the anomalies is declining at the time of that peak. However, this is no comfort for the "it's all oceanic oscillations" crowd for the recent warming is clearly associated with a very strong positive forcing. As noted before, it is stronger than any forcing shown elsewhere on the record except for the brief excursions due to major volcanic events. An important additional caveat is that temperature records prior to 1950 are incomplete, and particularly so prior to 1880 so that prior to those dates noise is a significant factor. Also, of course, HadCRUT3 is now obsolete, and its flaws will also constitute noise on the record. -
Kevin C at 03:29 AM on 30 March 2012HadCRUT3: Cool or Uncool?
emosca11: Sorry, I wan't very clear. Pland and Pocean are defined such that they sum to 1, because they are the fraction of the sample taken from land and ocean respectively. The raw fractions of the Earth's surface will add up to less than 1, due to coverage. If we call these Fland and Focean, then Pland = Fland/(Fland+Focean) and Pocean=Focean/(Fland+Focean). If you try and reproduce my graph using just the coverage numbers from the HadCRUT distributed files, you will find that those numbers can go greater than one. That is the gridding issue which I describe in the article. -
Kevin C at 03:25 AM on 30 March 2012HadCRUT3: Cool or Uncool?
Steve:I don't know what to make of the sigmoid shape of the curve. Sorry, I thought I'd made it obvious. The shape of the HadCRUT difference curve is explained very well by just 2 known effects, and the process Riccardo explains above. Only very steep changes in forcing are anough to drag the land temperatures far away from the SSTs. All the features of the HadCRUT difference curve can therefore be explained by Krakatoa and the subsequent volcanoes (look at the stratospheric aerosol loadings on this plot) in 1880-1900, and the greenhouse warming overwhelming tropo aerosols post 1970. Looking for unexplained sinusoids without taking out the effect that we already know about is liable to give misleading results. -
Riccardo at 02:51 AM on 30 March 2012HadCRUT3: Cool or Uncool?
I don't think that the land minus ocean century scale trend has any particular meaning. I would have guessed that during a warming phase the difference should increase due to the slower response of the ocean. While this could qualitatively explain the increase from the '70s, that was not the case during the warming phase of the first half of the last century. Admittedly oversimplifying the picture, the difference between the two warming phases is the cause of the forcing, i.e the sun in one case and CO2 in the other. This in turn seems to point to the different wavelengths of the radiation involved, visible in the former and infrared in the latter. Apart from the albedo, land absorbs both (roughly) equally well. In the oceans, instead, IR radiation is absorbed at the surface and heat is spread through mixing while visible light directly spreads its energy throughout about 100 m. Is this relevant? I don't know, but if I were to research it I'd start here. -
barry at 02:35 AM on 30 March 2012Monckton Misleads California Lawmakers - Now It's Personal (Part 1)
Chriskoz@4 - the link you can't follow goes to the SSPI personnel page. http://scienceandpublicpolicy.org/personnel.html Monckton's bio there no longer includes the bit about being a Nobel Lureate, but you can see the original version in the PDF bill linked @7. -
DSL at 02:05 AM on 30 March 2012The Big Picture (2010 version)
In mainstream climate news, The Weather Channel has, remarkably, placed a GW article on its front page. I haven't yet looked at the comment stream, and I'm not sure I have the patience for it today. The article itself is a general report on the IPCC extreme events statement. http://www.weather.com/outlook/weather-news/news/articles/ipcc-special-report-analysis_2012-03-28 -
Steve Case at 01:28 AM on 30 March 2012HadCRUT3: Cool or Uncool?
Kevin C #77801 I get pretty much the same curve you get for (CRUTEM3 - HADSST2) 1850 - 2010. I used the NCDC data because the sigmoid shape of the curve was so pronounced. But that same sigmoid shape is there with the CRU/HAD data. It's just not as pretty. You wrote: It looks like we have a big cooling event covering the period 1880-1900. Given the 60 month smooth, it would have to start around 1883. I don't know what to make of the sigmoid shape of the curve. I was interested in the trend when I set out to make the graph. I found out that the several degree gap between the warm ocean and the cooler atmosphere has narrowed by about 0.25°C over the last 160 years. The sigmoid shaped curve that appeared shows us that at times the gap widens. Take a look at the 50 year period from 1920 to 1970. I'm not offering up any theories and in my wonderings around the net I haven't seen any from any one else. -
muoncounter at 23:33 PM on 29 March 2012Human CO2 is a tiny % of CO2 emissions
"we must start with known facts - not a bunch of hypotheses inferred from data" One should never allow one's argument to become contaminated with facts (or data for that matter). -- image linked to source page
800 years of minimal fluctuations in atmospheric CO2 (at what might be called a 'pre-industrial level'), followed by an abrupt upswing. Why would anyone base a hypothesis on that?
-- image linked to source page
800 years of minimal fluctuations in atmospheric CO2 (at what might be called a 'pre-industrial level'), followed by an abrupt upswing. Why would anyone base a hypothesis on that?
-
Composer99 at 23:20 PM on 29 March 2012Human CO2 is a tiny % of CO2 emissions
It's very odd of primespot to castigate this thread with: To have a serious debate, we must start with known facts - not a bunch of hypotheses inferred from data and Like so many dialogues in our society today - this one is taken over by biased people trying to shout over one another, rather than starting with facts and ending with a course of action. I find it unusual, because data (results derived from empirical observation or from calculations based on observation) are to me synonymous with facts, and you don't infer hypotheses from data - you infer conclusions and then postulate hypotheses. In addition as others have stated upthread, serious scientists and their organizations and synthesis reports (such as the IPCC) do, in fact, draw their conclusions (AGW is real and action to prevent it where possible is required) from known, easily-verifiable facts. It's not out of line to say that there is a rather natural chain of inference such that: 1 - basic physics predicts humans can alter the global climate for the worse 2 - empirical observation shows that humans are altering the global climate, for the worse - and at a rate nearly unprecedented in geological history 3 - the costs and drawbacks to simply allowing this process to go on unchecked and trying to adapt to the resulting changes can be shown to be much greater than the costs and drawbacks to mitigating its effects and preventing its growth 4 - as such, there is a clear imperative for action, in the form of reducing human emissions of known heat-trapping gases Since this position, as far as I can tell, is essentially what the IPCC, prominent climate scientists, large bodies of science (the National Academies, Royal Society, & such) and of course Skeptical Science are espousing, once again I must emphasize primespot's attempt to castigate SkS on this thread on this account mystifying. -
emosca11 at 23:18 PM on 29 March 2012HadCRUT3: Cool or Uncool?
The equation Δbias = Tbiased - Tunbiased = Tland (Pland - 0.29) + Tocean (Pocean - 0.71) = (Tland - Tocean) x (Pland - 0.29) appears near the end of the article. The last line of this equation is correct only if Pland + Pocean = 1. However, the sentence below states: "The land and ocean coverage exceed the fractions of the surface covered by land and ocean, and in some cases add up to more than 100%." Doesn't this mean that Pland + Pocean doesn't necessarily equal 1? -
Phil M at 22:21 PM on 29 March 2012Skeptical Science hacked, private user details publicly posted online
Hope you get the crooks. I guess the upshot is. It shows how damn desperate they are. Smear is their only defense now. It's a warning to other AGW realist blogs out there. Wounded and cornered animals fight back harder. Glad I have a dynamic ip. -
Dikran Marsupial at 21:47 PM on 29 March 2012There's no tropospheric hot spot
Like scaddenp, my response to tompinlib would be to point out that there is plenty of reason to think that the problem may lie with the radiosonde observations as well as the models ("all models are wrong, but some are useful" - GEP Box). They were designed for use in weather forecasting, not climate modelling, and so while the data may have a resolution of 0.1K, they have many potential sources of bias which means that they are unlikely to be well calibrated. A lot of computer modelling work has to be done to homogenise the data to remove these sources of bias and it is ongoing work. The fact that there is a high degree of uncertainty in the radiosonde observations is well illustrated by the differences between radiosonde products from different research groups. See the advanced tab of the article. -
Dikran Marsupial at 21:35 PM on 29 March 2012Human CO2 is a tiny % of CO2 emissions
primespot wrote: "To say that the levels of CO2 before the Industrial Revolution remained static is just wrong. CO2, temperatures and water levels have fluctuated quite dramatically for a long time. To have a serious debate, we must start with known facts - not a bunch of hypotheses inferred from data." I completely agree. In which case you ought to start by presenting the evidence that says there were substantial fluctuations in CO2 prior to the industrial revolution, since say the end of the last major glaciations (of course glaciations have a large effect on CO2 levels, but this doesn't explain recent changes). Another line of evidence that might support your position would be evidence that CO2 levels had been higher than present over the last 800,000 years or so. Starting with facts would be great, but it is exactly the thing you did not do. Present your evidence piece by piece and we will happily engage in a scientific dialogue with you. Note I say "piece by piece" because scientific discussion requires depth as well as breadth; so building an argument gradually assessing each pice in turn and progressing onto the next step when agreement is reach has been found to be thebest way to make progress. -
Nick Stokes at 19:41 PM on 29 March 2012HadCRUT3: Cool or Uncool?
Kevin, In TempLS V2, the spherical harmonics are embedded in the spatial linear model. I've described the maths here,, starting in the section headed "Spatial Dependence". It's true that the end effect probably isn't that different to fitting the spatial functions separately afterwards. I agree that the Gistemp method is probably not much different in its outcome to fancier methods. -
Bernard J. at 19:36 PM on 29 March 2012Human CO2 is a tiny % of CO2 emissions
To say that the levels of CO2 before the Industrial Revolution remained static is just wrong.
Straw man. No scientist is saying that. What they are saying, however, is that the concentration of atmospheric CO2 is increasing in proportion to the (~10) billions of tons of carbon that humans burn annually, and that this rate of increase is significantly greater than it has been for hundreds of thousands - if not millions - of years. Given that a little less than half of annual human emissions are sequestered, what do you think that this continually-increasing extra greenhouse gas is doing to the planet's climate?CO2, temperatures and water levels have fluctuated quite dramatically for a long time.
What you mean is that "CO2, temperatures and water levels have fluctuated quite dramatically on occasions far back over geological time"... And every time that they fluctuated dramatically, there was a concurrent dramatic impact on the biosphere. And something that seems to completely escape the Denialati is that the biosphere is what keeps humanity alive. If anyone doesn't believe this I am (and I'm sure others would be) quite happy to dissect this concept in fine detail... We are absolutely and inextricably beholden to the primary productivity of solar-driven photosynthesis (and its direct products) for our survival. Hurt the biosphere, and humanity is hurt. With the passing of abundant fossil energy this dependency will only become more - and permanently - stark.To have a serious debate, we must start with known facts - not a bunch of hypotheses inferred from data.
Consensus climatology and ecology absolutely do start with "known facts". You seem to be either oblivious to, or entirely ignoring, them.We all know that data can be used to support any bias.
"[D]ata can be used to support any bias" only if one does not use the data correctly. If you adhere to your statment then it is only a reflection on how you and your associates are wont to "use data".There is simply no evidence that shows absolutely that carbon dioxide levels are the root cause of the phenomenon known as "global warming."
The only absolute in science is that there are no absolutes. If your presumption of irrefutable absoluteness is replaced with something such as "strong certainty", then your statement is completely refuted.It is a fact that there is a "greenhouse effect" taking place, but is higher carbon dioxide levels the root cause or just a symptom?
To the extent that there are no absolutes, as noted above, it is still defensibly - strongly defensibly - possible to ascribe most (if not all) contemporary global warming to human CO2 emissions.A simple look at the data could also suggest that long cycle changes in ocean currents or a cooling/shrinking planet or some other factor could just as easily be the culprit...
No....and, of course, it could also be mankind.
"Could" in the same way that falling from 2 000 metres without a parachute "could" kill you.There is no evidence that proves that shutting off all man-made sources of carbon output - even if it were possible - would alter the changes taking place.
Eh? Were's your evidence for that?There is an abundant supply of common sense that says shutting off all carbon generating activities by mankind would cause a great deal of hardship to a lot of people!
"Common sense" is not science, and is not even a reliable guide for objective correctness. This is a basic tenet of high school level scientific philosophy.Wouldn't our energy be better spent trying to find ways to live on a warmer planet?
No. If you don't understand why, try teaching a mountain pygmy possum to live without winter snow, or a penguin to live on a tropical beach, or walrus and polar bears to live without sea ice. The same issues apply to humans, if in slightly more subtle and complex (but no less important) ways.Why do we assume - with some arrogance - that mankind has all this power to affect global temperature?
Why not?Why do we assume that mankind is some non-natural force?
Simply, because human intelligence is an emergent phenomenon of a type and magnitude that has not previously had expression in the history of the planet.Isn't mankind just another part of nature?
To the extent that human intelligence distinguishes our species from the rest of the planet - the answer is an emphatic "no".Like so many dialogues in our society today - this one is taken over by biased people trying to shout over one another, rather than starting with facts and ending with a course of action.
This is the only accurate thing that you've said. Unfortunagely for you, the "biased people" are those who have the temerity, if not the objective evidence or even the intellectual capacity, to contradict parsimonious science. In other words, your crowd... -
Doug Hutcheson at 19:21 PM on 29 March 2012Solar Cycle Length proves its the sun
tompinlb @ 17, you speak of "Archangel Russia with a change of 0.14 degC per decade" and then state "This station has experienced a rate of temperature change that is 300 percent of the average rate of change shown for HadCRUT3", yet earlier you made the point "the average for HadCRUT3N in this same table is shown as 0.47 degC per decade". I am confused, or misreading the figures, but 0.14 is not 300% of 0.47 in my book. Have I misunderstood something? Your final sentence reads "They only make the argument, and provide the evidence to support the argument, that previous solar cycle length explains from 40% to 60% of the historic change in temperatures in the stations that they investigated". I think you are mixing up correlation with causation. They have identified a weak correlation between temperature change and previous sunspot cycle length, without suggesting any mechanism by which the previous cycle is implicated in causing the temperature change. The apparent correlation is a curio, no more. As stated in the paper: "This indicates a possible existence of a physical mechanism linking solar activity to climate variations", which is really no more definite than linking hem-lines with global warming, or even hem-lines with solar cycles. They conclude "This indicates a connection between the behavior between the solar dynamo and temperatures on the Earth". Of course there is a connection! The forcing from TSI is already well explored and is taken into account when modelling future climate change, along with all the other known forcings. The observed influence of variations in TSI is slight and does not lag the solar cycle by 6 years, or 12 years, or any other arbitrarily selected time span. I would reword the final sentence of your comment @17 like this: "They make the allegation, without providing satisfactory evidence to support the allegation, that previous solar cycle length explains from 40% to 60% of the historic change in temperatures in the small sample of stations that they investigated, without proposing any credible mechanism by which this may have occurred and without showing how this mechanism has affected global mean temperatures.". If the authors had come up with a new theory that invalidated what we know already about forcings on climate, they would be in line for a Nobel Prize, instead of being relegated to publishing in a fringe journal. I believe I speak for everybody on this forum in saying we would be thrilled to discover that AGW is not real and we can all sleep easy in our beds. The Solheim, Stordahl and Humlum paper has not done anything to refute AGW, unfortunately for us. -
Tom Curtis at 17:57 PM on 29 March 2012Solar Cycle Length proves its the sun
tompinlb @11 suggests that forcings as determined by the IPCC show a similar lack of predictive ability to solar cycle length when it comes to temperatures. That is simply not true: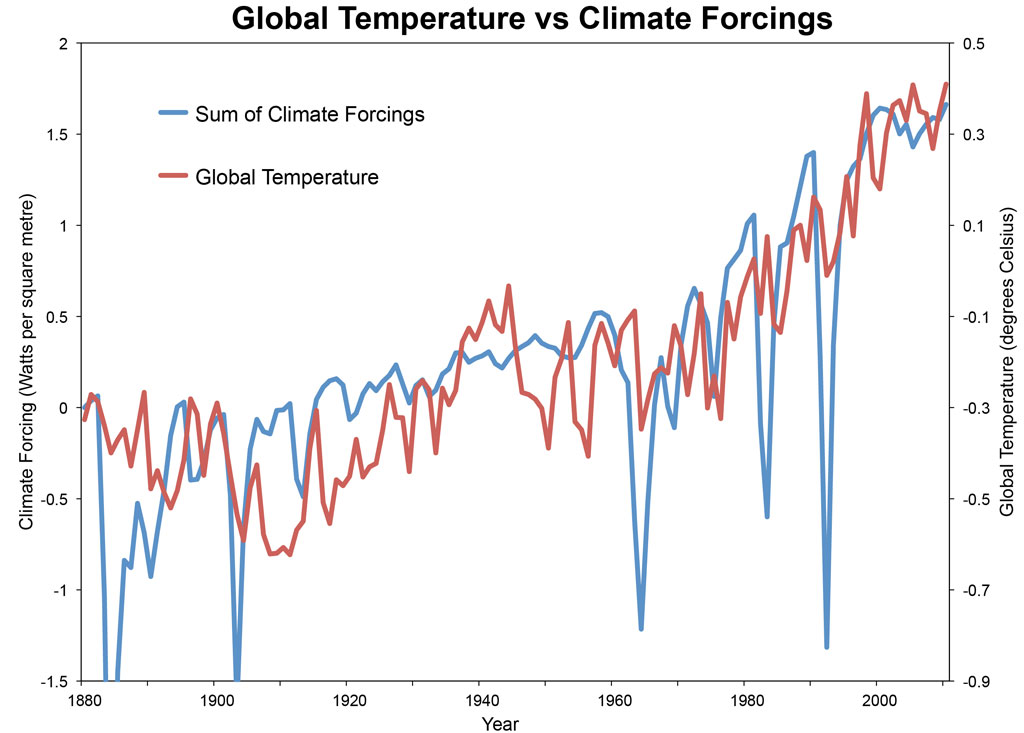 To further reinforce the point, here is a direct comparison between solar cycle length as determined by Solheim et al and global temperatures lagged by approximately one solar cycle (as required by their theory):
 Solheim et al (and tompinlb) want us to believe that the changes in solar cycle length are responsible for 40% of the trend in global temperatures. They think that is a better theory than that the temperature increase is explained by known forcings. I suggest that represents desperation (anything but CO2), not analysis.
(Unfortunately my longer response covering a number of additional points got eaten by the gods of the web. I may bring up some of those additional points in a later post.)
Edited: 5:41pm to show corrected image.
Solheim et al (and tompinlb) want us to believe that the changes in solar cycle length are responsible for 40% of the trend in global temperatures. They think that is a better theory than that the temperature increase is explained by known forcings. I suggest that represents desperation (anything but CO2), not analysis.
(Unfortunately my longer response covering a number of additional points got eaten by the gods of the web. I may bring up some of those additional points in a later post.)
Edited: 5:41pm to show corrected image.
-
Kevin C at 17:05 PM on 29 March 2012HadCRUT3: Cool or Uncool?
Chris: Here is a nice overview of the family of methods of which the GISS approach is a special case: Kernel smoothers. The GISTEMP kernel function is a simple cone - the 2-d version of a triangular tent function. To contrast, the alternative approach would be to devise a parametric form for the global temperature field (say spherical harmonics), and determine the best set of parameters to fit the parametric form to the data. I don't think anyone's done that, although Nick Stokes fits spherical harmonics to his final result for presentation. I'd go further down the kernel route than GISS and advocate BEST's krigging method, because it gives uncertainty estimates as well as values at every point. Although I think in the final result they use the post-hoc bootstrap estmates for the error rather than the ab-initio krigging values. But in practice I expect that the GISTEMP method is a pretty good approximation to the BEST method. All of these methods give better coverage than the simple grid approach, because according to the data the 5 degree boxes are significantly smaller than the correlation distance of the temperatures, at least in the longitude direction. -
tompinlb at 15:36 PM on 29 March 2012Solar Cycle Length proves its the sun
muoncounter, your argument is specious. You first select as an example the authors’ analysis of the Tromso Norway station, which had a temperature change of 0.036 degC per decade. Of all the stations studied by the authors, this shows the least warming. Is this cherry picking on your part? The average change of the seven stations in Norway investigated by the authors was 0.068 degC per decade. The average for Norway, per the author’s Table 1, was 0.56 degC per decade; the average for HadCRUT3N in this same table is shown as 0.47 degC per decade. So the seven stations investigated by the authors had an average rate of change that was 145% of the average global temperature change shown by HadCRUT3. Thus your assertion – that the “authors have selected locations that show minimal warming. They are effectively analyzing the noise, rather than the signal.” – is not consistent with the evidence. The stations selected by the authors show rates of change well in excess of the HadCRUT average. What is the basis for your assertion that they are analyzing the noise rather than the signal? You then select station Archangel Russia with a change of 0.14 degC per decade and ask how the authors can “explain away the warming” since the 1970’s. This station has experienced a rate of temperature change that is 300 percent of the average rate of change shown for HadCRUT3. At no place in this paper do the authors purport to explain 100 percent of the temperature changes in any of the stations, let alone one where temperature has increased three times as fast as the global average. They only make the argument, and provide the evidence to support the argument, that previous solar cycle length explains from 40% to 60% of the historic change in temperatures in the stations that they investigated. -
Andy Skuce at 15:30 PM on 29 March 2012Human CO2 is a tiny % of CO2 emissions
primespot: -We have samples of the air going back 800,000 years in ice cores that show the concentrations of CO2. These are "known facts". -Recent carbon dioxide increases have been caused by combustion of fossil fuels, even some of the skeptics like Willis Eschenbach and Roy Spencer accept that without reservation. This isn't a disputed hypothesis, this is as close to accepted fact as we get in science. -What evidence is there that a "shrinking planet" could have contributed to the rise in CO2? Surely, you are not serious. -Skipping over some of your other assertions, why do you believe that it is "arrogance" to assume that mankind can influence the climate? Do you think, for example, that it is arrogance to think that a nuclear war would be catastrophic? I suppose that your logic would at least lead you to believe that a nuclear war would be an entirely natural phenomenon. -I agree with you that this dialogue "is taken over by biased people trying to shout over one another, rather than starting with facts and ending with a course of action". But not in the way you think. -It's perhaps arrogance on your part to think that your "common sense" arguments are sufficient to overcome the consensus opinions of experts who have spent their lives studying this problem. -
Bob Lacatena at 15:28 PM on 29 March 2012Human CO2 is a tiny % of CO2 emissions
218, primespot,A simple look at the data...
An overly simplistic look at anything will lead you to wrong conclusions. Your "look at the data" is so far off the mark it suggests that you haven't looked at the data at all, you've listened to others, or presumed that the data says what you'd like. An intelligent and informed look at the data will show you that your statements are false....shutting off all carbon generating activities...
No one is saying this except for fear-mongers who want to scare other people out of thinking things through. What is necessary is aggressive but moderate action now, rather than complete lethargy and inaction. Failure to act now will simply require more desperate measures later, measures that will hurt society and economies, because they'll have to be too radical and too aggressive....find ways to live on a warmer planet?
No, because it will be more expensive to do so, and the planet will not simply "be warmer." That's a gross misunderstanding of what we're facing.Why do we assume that...
It's not an assumption, it's an understanding based on knowledge and facts.Like so many dialogues in our society today - this one is taken over by biased people trying to shout over one another, rather than starting with facts and ending with a course of action.
And finally, in conclusion, you say something sensible. Now that you have all of that shouting and lathered up umbrage out of your system, welcome to Skeptical Science! This site has a wealth of information which will help to educate you on the issues so that you can understand them, rather than shout platitudes based on ignorance and a complete misunderstanding. Please use the search box in the upper left hand corner. Many articles are presented in beginner, intermediate and expert versions, whichever best suits your own personal starting point and level of understanding. When you have learned more, and are able to actually make supportable statements, then we can talk. Until then, standing up and shouting as loudly as you can that you are right and everyone else is crazy will not be nearly as effective as first learning and then starting with facts and ending with a course of action. -
primespot at 14:56 PM on 29 March 2012Human CO2 is a tiny % of CO2 emissions
To say that the levels of CO2 before the Industrial Revolution remained static is just wrong. CO2, temperatures and water levels have fluctuated quite dramatically for a long time. To have a serious debate, we must start with known facts - not a bunch of hypotheses inferred from data. We all know that data can be used to support any bias. There is simply no evidence that shows absolutely that carbon dioxide levels are the root cause of the phenomenon known as "global warming." It is a fact that there is a "greenhouse effect" taking place, but is higher carbon dioxide levels the root cause or just a symptom? A simple look at the data could also suggest that long cycle changes in ocean currents or a cooling/shrinking planet or some other factor could just as easily be the culprit - and, of course, it could also be mankind. There is no evidence that proves that shutting off all man-made sources of carbon output - even if it were possible - would alter the changes taking place. There is an abundant supply of common sense that says shutting off all carbon generating activities by mankind would cause a great deal of hardship to a lot of people! Wouldn't our energy be better spent trying to find ways to live on a warmer planet? Why do we assume - with some arrogance - that mankind has all this power to affect global temperature? Why do we assume that mankind is some non-natural force? Isn't mankind just another part of nature? Like so many dialogues in our society today - this one is taken over by biased people trying to shout over one another, rather than starting with facts and ending with a course of action.Moderator Response: [Sph] Other mods, please do not delete this comment for being off-topic. Please leave it as a testament to how much passion, intensity and surety a person can put into a position as long as it is based on assumption and hearsay rather then investigation, education, and understanding.
Prev 1204 1205 1206 1207 1208 1209 1210 1211 1212 1213 1214 1215 1216 1217 1218 1219 Next


