


 Arguments


Recent Comments
Prev 1234 1235 1236 1237 1238 1239 1240 1241 1242 1243 1244 1245 1246 1247 1248 1249 Next
Comments 62051 to 62100:
-
YOGI at 09:14 AM on 4 March 2012Postma disproved the greenhouse effect
Bob Loblaw "..extra warmth..) ? "..can lead to warming if all other heat fluxes remain constant. [Fundamental misunderstanding of physics.]" Al you can say is that it would be warmer with clouds than without, but there is no rise in surface temp` unless DLR is greater surface OLR.Response:[DB] You still avoid finishing your dialogue with Dikran in comment 73 above. You will not be able to move on until you finish that one already started.
-
John Hartz at 09:13 AM on 4 March 2012Oceans Acidifying Faster Today Than in Past 300 Million Years
The OP and Romm’s article are based on the findings contained in the peer-reviewed article, “The Geological Record of Ocean Acidification”, Hönisch, et al, Journal of Science, March 2, 2012: 1058-1063, DOI:10.1126/science.1208277 Unfortunately, this paper is behind a paywall. -
R. Gates at 09:07 AM on 4 March 2012Warming to Ignite the Carbon Bomb
I think this increase in forest fires represents some of Earth system feedbacks that Hansen has recently commented on that must be accounted for in determination of any final equalibrium response to the rapid increases in greenhouse gases we've seen. In addition to the drying of the forests, there is the issue of the warmer winters which allows insects, like the pine beetle to survive, and destroy more trees, which also ultimately increases carbon in the atmosphere, and thus these biological responses also figure into any final equalibrium response. Given that the we are seeing more fires and more insect infestations already from 394 ppm of CO2, we' ve not yet obviously even seen what the equalibrium response is to our current levels of greenhouse gases, and given that they continue to rapidly build, we'll never know what it would have been. -
John Hartz at 09:06 AM on 4 March 2012Oceans Acidifying Faster Today Than in Past 300 Million Years
Purely by coincidence, Joe Romm also posted today an article about the findings of the paper discussed in the above OP. The title of Romm’s article is:”Science: Ocean Acidifying So Fast It Threatens Humanity’s Ability to Feed Itself” It covers some ground not covered in the above OP. The two articles nicely complement each other. To access Romm’s article, click here. -
Bob Loblaw at 08:58 AM on 4 March 2012Postma disproved the greenhouse effect
YOGI@70 Wow. Basically three short sentences (not counting the single word "Correct" that starts the third paragraph) and we have both a strawman and a goalpost shift. Plus a fundamental misunderstanding of physics.... 1) Who said "all night long"? I'm comparing two scenarios at a single point in time, and how something/someone "feels" at that instant. No need to consider what might be going on hours away. [Strawman - I never said the conditions had to be maintained for a period of time.] 2) At a particular point in time, 30 C with rapid heat loss will "feel cooler" than 30C with a slow heat loss. No need to wait. [Goalpost shift - now "feels warm" or "feels cool" is replaced by "needs to be substantially cooler than skin temperature, or previous temperature". I can't tell which YOGI means.] 3) Whether something warms or cools is dependent on it total energy balance, not just the net IR. Even if net IR is negative (a loss), reducing that loss (making it less negative) can lead to warming if all other heat fluxes remain constant. [Fundamental misunderstanding of physics.] It may be that you're just expressing yourself poorly, but for me, it's "three strikes, you're out". -
dhogaza at 08:22 AM on 4 March 2012Wall Street Journal 'Skeptics' Misrepresent the IPCC
funglestrumpet: Murdoch didn't really change anything. The paper's editorial and op-ed pages were anti-science before he bought it (when science clashed with the papers political views). It published an infamous "satellite data shows cooling and is the wooden stake through the heart of global warming" piece when the very first UAH reconstruction was published. That was not the first attack on climate science, and that was long before Murdoch bought it. It published a bunch of pseudo-scientific attacks on issues like conservation and acid rain in its day, probably ozone layer stuff as well though I don't remember. It may be more a case of Murdoch buying a paper with an editorial stance much too his liking than of Murdoch buying a paper and twisting its editorial stance into alignment with his own. -
adelady at 07:21 AM on 4 March 2012Postma disproved the greenhouse effect
YOGI "clear sky, warm night, surface at 30 degrees C.." What all night long ?" I don't know where you live that causes you to be surprised at this, but it is quite realistic. Where I live the temperature at 2.00am was 30.7C a couple of nights ago. And it wasn't much less at 6.00am. -
funglestrumpet at 07:12 AM on 4 March 2012Wall Street Journal 'Skeptics' Misrepresent the IPCC
For me, the fact that the WSJ is owned by Rupert Murdoch says it all. -
Dikran Marsupial at 07:03 AM on 4 March 2012Postma disproved the greenhouse effect
YOGI, thankyou for answering one of my questions, the other was: "Also please state unequivocally whether you agree that in the example you provided that the presence of another blackbody increases the equilibrium temperature of both bodies." -
YOGI at 06:59 AM on 4 March 2012Postma disproved the greenhouse effect
"Dikran Marsupial" YOGI Please can you state unequivocally whether the mirror example in Postmas paper is incorrect or not. Do you agree that with the mirror in place the blackbody will have a higher equilibrium temperature. I think it incorrect as I implied in my analogy of two black bodies, that got snipped earlier. -
Dikran Marsupial at 06:52 AM on 4 March 2012Postma disproved the greenhouse effect
YOGI, you are incorrect. A simple extension of Postma's mirror example will demonstrate why you are incorrect. Your continued avoidance of answering the questions that would clarify your position on Postma's paper is beginning to look like evasion. -
YOGI at 06:46 AM on 4 March 2012Postma disproved the greenhouse effect
Bob Loblaw "a) clear sky, warm night, surface at 30 degrees C.." What all night long ? "Net IR at the surface is -140 W/m^2 (i.e. a loss of 140 W/m^2). Feels cool." Yes once it is much less than 30°C it will feel cool. "Are you trying to say that the surface (or you) will feel no extra warmth unless the overlying cloud is actually warmer than the surface?" Correct. In b) the presence of clouds will slow the rate of surface cooling, but cannot increase surface temp` unless they are at a higher temp` than the surface. -
Dikran Marsupial at 06:42 AM on 4 March 2012Postma disproved the greenhouse effect
YOGI, before you go any futher, please answer the questions I asked here. You have not yet clarified your position on the errors in the Postma paper that you chose to hang your hat on. -
YOGI at 06:34 AM on 4 March 2012Postma disproved the greenhouse effect
Eric (skeptic) So what's up with nighttime clouds? Clouds emit infrared radiation to the efficiently absorbing ground, keeping the ground (and thus the overlying air) warmer.: https://courseware.e-education.psu.edu/public/meteo/meteo101demo/Examples/Section6p04.html -
Albatross at 06:03 AM on 4 March 2012Wall Street Journal 'Skeptics' Misrepresent the IPCC
dhogaza @63, "Can't we just make it stop?" If only dhog, these guys are like energizer bunnies. But your point is taken. I made the mistake last night of breaking the DNFTT rule, and shall not make it again. I strongly urge others to (unlike I did), as difficult as it is, to refrain from FTT. -
dhogaza at 05:44 AM on 4 March 2012Wall Street Journal 'Skeptics' Misrepresent the IPCC
Gavin and "wrong": "[Response: Note that projections are a function of two things - the scenario and the model. What was wrong in FAR was the scenario (too fast growth rate of GHGs, no aerosols, no ozone, no BC etc.), not the model (though the projections were with simple emulators not GCMs). Indeed, models today have similar sensitivities and with the same scenario will give the same temperature rise. - gavin]" Anteros is saying nothing in this thread that wasn't said over at RC (other than his quote-mining Gavin in an extremely misleading way). Those refuting him are saying nothing new. His refusal to learn is clear. Can't we just make it stop? -
MA Rodger at 05:21 AM on 4 March 2012Wall Street Journal 'Skeptics' Misrepresent the IPCC
keithpickering @59 The FAR BAU was not just projecting large CFC increases, but also large methane increases. As one of the commenters on the RealClimate thread, I concluded at the time that the FAR BAU projection had stood the test of time well, projecting a 0.23 deg C /decade rise 1990-2010 for a higher GHG scenario than actually occurred. (Of course this is the same FAR that also contains the classic fig 7.1c complete with Medieval Warm Period & Little Ice Age.) The only mitigation I have seen for the poor representation of FAR BAU provided in the WSJ letter is perhaps AR4 fig TS.26 which also latches on to the FAR "0.3 deg C/decade" for the 21st century average and applies it to 1990-2005. Then, at least TS.26 had a more considered start point. And while that one aspect of TS.26 may be a bit of a low point, the WSJ graph actually represents the flawed and lacklustre pinnacle of correctitude in an otherwise grossly fallacious diatribe. -
Volker Doormann at 05:19 AM on 4 March 2012Scafetta's Widget Problems
Sphaerica says at 10:43 AM on 2 March, 2012 Volker, I do not need a mechanism... To be taken seriously, yes, you do. Hi Sphaerica, My impression is, that a discussion about this point will be snipped by a moderator as OT. (-snip-) V.Response:[DB] Off-topic dissembling and evasion snipped.
-
Albatross at 05:17 AM on 4 March 2012Wall Street Journal 'Skeptics' Misrepresent the IPCC
Bob @55, "They've started each IPCC prediction from the single value for that year, rather than a more realistic middle-of-the-noise value. " You raise a very valid point and yet another problem with their graphic that misrepresent the IPCC. It is interesting that you also noticed that, as I was pondering that very point myself this morning and the Tamino post that you linked to also came to mind. Using Lindzen et al's faulty logic, they would have felt justified in starting the predictions at the peak in 1998 had the AR been released that year, and that of course would be very wrong. This is just as bad, if not worse than Pat Michaels' repeated misrepresentation of Hansen et al''s 1988 prediction (well Hansen said it was "treading close to scientific fraud"). I guess the fake skeptics have, for now, given up on that one and have found a new set of predictions to tamper with to mislead the public. I wonder how MIT feels about one of its profs engaging in potential scientific fraud in the public eye? What is lost in this fake debate though is how well subsequent predictions have performed: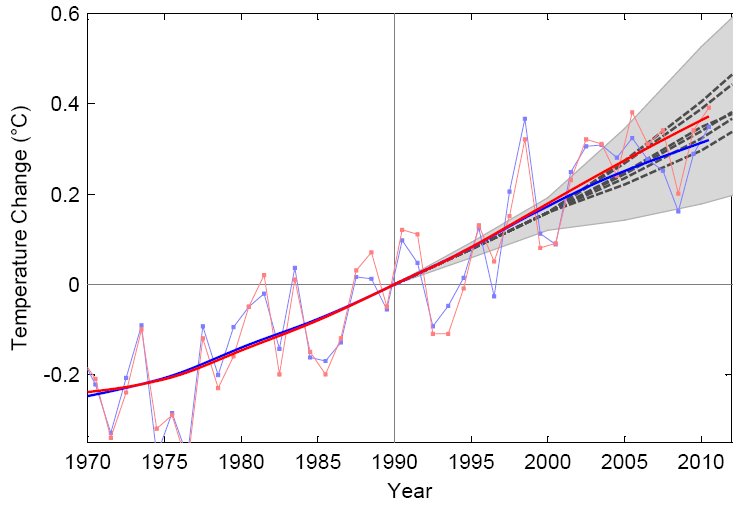 Caption: Annual global temperatures from NASA GISS (red) and Hadley Centre (blue) up to 2010, compared to the temperature projections of the IPCC TAR (grey dashed lines and grey range, as shown Figure 5d of the TAR Summary for Policy Makers). [Source]
Rahmstorf:
"Temperature trends are now near the centre of the TAR projections, with linear trends of 0.19 and 0.17 +/- 0.08 ºC per decade in the GISS and Hadley data, as compared to projected linear trends ranging from 0.15 to 0.20 ºC per decade in the TAR projections (depending on emissions scenario)."
Caption: Annual global temperatures from NASA GISS (red) and Hadley Centre (blue) up to 2010, compared to the temperature projections of the IPCC TAR (grey dashed lines and grey range, as shown Figure 5d of the TAR Summary for Policy Makers). [Source]
Rahmstorf:
"Temperature trends are now near the centre of the TAR projections, with linear trends of 0.19 and 0.17 +/- 0.08 ºC per decade in the GISS and Hadley data, as compared to projected linear trends ranging from 0.15 to 0.20 ºC per decade in the TAR projections (depending on emissions scenario)."
 [Source]
-
Alex C at 04:44 AM on 4 March 2012Wall Street Journal 'Skeptics' Misrepresent the IPCC
Bob makes a good point @55. The WSJ signatories appear to have started each projection in the year of the publication, and used an averaged trend starting from that year's temperature value. The models project the entire twentieth century though, and as such it would be more appropriate to zero the models at the same base period used by HadCRUT3. However, I wouldn't say that the effect would be as great as lowering the starting point to 0.1 in the figure above. The 1961-1990 average for the model runs seems to be just under 0.75, if not 0.75 itself. The change to 1990, though, is about 0.2˚C, which would drop the start value of that graph above by only about half a degree celsius (this is a rough estimate). The effect is not as important as the effects of using the correct trend over that time period, and the correct forcing (both scenario-wise, and correcting for the overstated concentration/forcing relationship I point out and Tom expounded). -
keithpickering at 04:17 AM on 4 March 2012Wall Street Journal 'Skeptics' Misrepresent the IPCC
Anteros #50 When you say "the BAU scenario never eventuated” you are absolutely right. But you fail to see that it was defined in a specific manner - that did eventuate. In other words "few or no steps were taken to limit the emission of GHG's". BaU was defined in an even more specific manner in the FAR Annex, and the BaU scenario shows a continuing large increase in CFCs throughout the 21st century. Only the FAR scenarios C and D show the effects of the implementation of Montreal. -
keithpickering at 04:06 AM on 4 March 2012Wall Street Journal 'Skeptics' Misrepresent the IPCC
Anteros @32 “Can I enquire how you got your figure of 0.35C per decade for the 'high' sensitivity and the BAU scenario? I ask because the FAR states that it is 0.5C per decade.” I extracted the graph from the pdf at high magnification, corrected the skew, and measured the pixel positions of the axes and the lines themselves. The slope in the first twenty years is obviously lower than it is for the entire century, even from a cursory examination. Pixel measurement allows you to quantify that. Sorry for the odd spacing of my previous post ... should have previewed first! -
keithpickering at 03:59 AM on 4 March 2012Wall Street Journal 'Skeptics' Misrepresent the IPCC
Anteros @22 "It seems you would all rather take the word of a sketchy, hand-drawn impressionistic graph than the specific written predictions of the FAR." The graphs and the text agree, when extended out to 2100. But the WSJ didn't extend their graphs out to 2100. And it is clear, looking at the graphs, that the IPCC projections indicate that the early part of their projection (the part we're in now) shows warming at a lower rate than the overall century-long rate. It is therefore utterly decpetive for the WSJ to use the overall century rate as the IPCC projection for the first twenty years: that wasn't the IPCC projection at all, for those first twenty years. "We used the 0.3 degrees per decade from the prediction of the FAR BAU. As I pointed out in my first comment, the error was in the SkS post above, suggesting that the [estimated from a graph] 0.32C was closest to the high climate sensitivity. It isn't - it is the 2.5C/2xCo2 best estimate." It is for the first twenty years. If the WSJ had wanted to be honest, they could have published the actual IPCC graph, which actually goes out to 2100. They didn't, and because they didn't, they gave a false impression of "where we should be now". "The FAR predicted, specifically that the BAU scenario would eventuate if few or no steps were taken to limit emissions of GHG's. And for those people clutching at straws with the Montreal protocol, that was signed and sealed 3 years before the IPCC FAR." The Montreal Protocol did not enter into force until 1989, and it is clear from the details of the emissions scenarios that neither BaU nor Scenario B anticipated any significant reduction of CFCs. See FAR Annex, figure A-3.Response:[DB] Fixed spacing.
-
dana1981 at 03:55 AM on 4 March 2012Wall Street Journal 'Skeptics' Misrepresent the IPCC
Bob - yes, there are really a lot of problems with the WSJ graphic, and we've only touched on a few here. The link in comment #1 to our post on the subject shows how to do the analysis properly. -
Bob Loblaw at 03:35 AM on 4 March 2012Wall Street Journal 'Skeptics' Misrepresent the IPCC
...while I'm at it.... Hasn't anyone noticed (or did I miss a comment?) that the original "Reality vs. Alarm" graph has used the trick that Tamino talks about here? They've started each IPCC prediction from the single value for that year, rather than a more realistic middle-of-the-noise value. The peak temperature for 1990 gives the "IPCC 1990" line a jump start above all the rest. If that projection started at 0.1 instead of 0.3, then the line wouldn't be that far off. By using 0.3, the graph is assuming that whatever caused the temporary upward spike in 1990-1991 will never go away as the "IPCC 1990" projection moves forward in time. -
Bob Loblaw at 03:21 AM on 4 March 2012Wall Street Journal 'Skeptics' Misrepresent the IPCC
Coming in late.... It looks like Anteros (or the sources he/she is using) are playing the following game: - both the expert and the fake skeptic agree that C = A * B - the expert says "my best estimate of B is 2.5, but it could be as low as 1.5 or 4.5" - the expert says "I don't know what A is going to be in the next 20 years. If it is 10, then C will probably be 25, but it could be as low as 15 or as high as 45, because of my uncertainty in B. Let's call that value of A 'Business as Usual'. If A is 5, then C will probably be 12.5, but in the range 7.5 to 22.5. If A is 2, then the range for C changes to 3 to 9, with a best estimate of 5". - 20 years later, it turns out that A was about 4, and that C was about 12, which implies that B is about 3. - To the expert, none of the scenarios for A were matched exactly, but the results for C = A * B, lead to only a slight change in the "best estimate" for B (within the range from 20 years ago), so the expert is pretty happy and thinks she's done well. After all, her area of expertise is in the estimation of B and the measurement of C, not guessing what will happen to A. - the fake skeptic, on the other hand, is claiming that the expert predicted that A would be 10 and B would be 4.5, so C should have been 45, so the fact that C was 12 means that the expert got everything wrong and can't be trusted to give us an accurate value for B. Whether the fake skeptic is really that silly, or thinks everyone else can be fooled is an exercise for the reader. -
Bob Loblaw at 02:51 AM on 4 March 2012Greenhouse Effect Basics: Warm Earth, Cold Atmosphere
dunc461: Again,a review of some "first principles". Gases do only emit and absorb at certain wavelengths (aka wave numbers), and this is a basic principle of spectroscopy. In Planck's law, emissivity is a function of wavelength. More so, Kirchhoff's Law says that emissivity equals absorptivity at the same wavelength (all other factors being equal), so if CO2 is absorbing at a particular wavelength, it should also emit at that wavelength. ...but as Tom has pointed out, energy absorbed by one molecule can be transferred to other molecules, so the bulk radiation emitted from a layer of the atmosphere has properties that are a mix of the bulk atmospheric constituents, not the single (or few) gases that do the absorbing. In your last post, I think you've roughly got the idea, but the way you are looking at it is a bit unusual, and you have missed one extremely important thing. The unusual part is that in radiative transfer, you usually just think of the upward-directed and downward-directed fluxes as individual values that occur (or can be measured) at a point in the atmosphere - not "generated by the layer below" - because it doesn't matter if is was emitted by the layer below, or whether it just passed through the layer below having been emitted from other layers further down. The usual way of describing this process is to use Beer's Law. Thus, the heating due to IR absorption is (upward IR)*(portion absorbed) + (downward IR)*(portion absorbed). This is just mathematical arrangement, however, and is done that way because it is easier to see what is going on and arrange things for computer calculation. The error is that you've forgotten about solar radiation. It is also being absorbed (according to Beer's Law), and needs to be included in the energy balance. -
Bob Loblaw at 02:22 AM on 4 March 2012Postma disproved the greenhouse effect
Re YOGI@63 Hmmm. You seem to feel that cloud must be warmer than you (or the surface) to "feel the warmth". How about these conditions?: a) clear sky, warm night, surface at 30 degrees C, so upward-emitted IR is about 480 W/m^2. Back radiation from clear sky about 340 W/m^2, which translates to an apparent sky temperature (for the purposes of IR radiation) of about 5 C. Net IR at the surface is -140 W/m^2 (i.e. a loss of 140 W/m^2). Feels cool. [Although I've selected these temperatures arbitrarily, they are realistic.] b) Identical to a), except that cloud has moved in at an altitude of about a kilometer, and the base of cloud is at about 25 C (i.e. still colder than surface). Back radiation from sky is now from cloud, not clear sky, and is about 450 W/m^2 (based on 25 C). Net IR at the surface is now only -30 W/m^2 (loss of 30), so the loss of energy from the surface is reduced from 140 to 30 W/m^2 - or only about 21% of what it was. [Again, arbitrary, but realistic, numbers.] To me, the second case (substantially less net IR loss from surface) will "feel warmer", even though the cloud is cooler than the surface (or me). Do you disagree with this scenario? Are you trying to say that the surface (or you) will feel no extra warmth unless the overlying cloud is actually warmer than the surface? -
paulhtremblay at 01:58 AM on 4 March 2012Wall Street Journal 'Skeptics' Misrepresent the IPCC
>>If the only thing the IPCC was offering up to the world was an estimation of climate sensitivity, the FAR would have been a very short document. That's a very disingenuous argument. It assumes that the IPCC's main goal consisted in predicting how much CO2 the world would release. In fact, that prediction consisted only a very small part of the IPCC report, and as others have pointed out, has nothing to do with the science of AGW, and does not diminish the egregious errors of the WSJ article. -
Eric (skeptic) at 01:31 AM on 4 March 2012Postma disproved the greenhouse effect
YOGI, the presence of clouds at night will keep the earth's surface warmer (i.e. will inhibit radiational cooling), all other things being equal. The clouds can be any temperature from relatively warm low clouds to very cold high clouds but will mostly be cooler than the surface. Yet they cause the surface to be warmer than it otherwise would be. -
Tom Curtis at 01:25 AM on 4 March 2012Wall Street Journal 'Skeptics' Misrepresent the IPCC
Anteros is clearly not interested in arguing his case in good faith. This is no surprise, for if he did argue it in good faith his case would vanish. Further, in order to prosecute his case, he is clearly prepared to misrepresent the IPCC, and anybody else that suites his purpose. Therefore I see no point in further discussion with him. I will note that when I took his criticisms at face value, and pointed out the consequences (@43 above), he merely dismissed it as "quibbles about hundredths of a degree". To show the significance of these "quibbles" below:The graph is the WSJ graph with the IPCC FAR 1990-2030 trend for scenario A shown in green. It also shows in yellow the IPCC FAR trend from 1990 to 2030 for scenario C, ie, the scenario that most closely matches the actual historical forcings if we allow for the IPCC FAR's incorrect estimate of forcing for a doubling of CO2; and in orange the trend for scenario D, as discussed above. Anteros can talk about quibbles as much as he likes, but it is transparent that had the WSJ 16 correctly represented the IPCC FAR projections (by any reasonable standard of "correctly") it would have significantly weakened their case. Anteros has suggested that we cannot learn from past mistakes if we do not recognize them. He is correct, which is why it is heartening that in both SkS discussions the nature of the errors made in IPCC FAR have been clearly identified. This contrasts sharply with Anteros and the WSJ 16 whose sole purpose seems to be to point vociferously at the error without discussing its causes, thereby distracting people from any real thought on the situation.
-
Dikran Marsupial at 01:01 AM on 4 March 2012The Independence of Global Warming on Residence Time of CO2
owl905 (i) The ice core data shows that even through an event as extreme as a major glaciation, the response of the natural carbon cycle is a change of only about 90-100 ppm, and in each case, an equilibrium is restored on the scale of tens of thousands of years. This is true, even though CO2 is thought to have provided positive feedback amplifyng the change in forcings. So why doesn't this positive feedback result in runaway warming or a snowball earth? Simple, there are other feedback mechanisms that exist, that oppose it. David Arher's primer on the carbon cycle is well worth reading, one of the things that it explains is why CO2 can provide positive feedback on short (by geological standards) timescales and negative feedback on longer timescales (via the "weathering thermostat") (ii) You wrote "arguing in favour a return to natural levels in a useful period of time" I am arguing no such thing. The adjustment time estimate of 74 years is likely an underestimate of the most rapid response of the oceans to an increase in CO2. This won't bring us back to pre-industrial levels. For that you need the slower response processes by which carbon is taken down into the deep ocean (thousands of years) and a full return to pre-industrial conditions is only possible by permanent sequestration of the carbon back into the lithosphere by weathering, which will take tens to hundreds of thousands of years. This is mentioned in my paper and links are given to more authoratative works. We can however stabilise CO2 levels much more quickly by cutting emissions to a point where they match environmental net uptake, which will limit the change to our climate. (iii) Additionally, your remark to MHauber that the missing CO2 accounting is virtual proof of a mystery sink is far beyond what the accounting, the chaotic nature of the pollution, or the science, supports." The sink isn't a great mystery, we know that the carbon is taken up by the other reservoirs, but we don't know exactly how much is going into each reservoir. However the point is that assuming conservation of mass, we don't need to know where in the natural environment the carbon is going to know with high confidence that it is being taken up by the natural environment. If you think this is beyond science, then the mass balance argument has appeared in several papers, at least one of which was referenced in my paper. I suspect the reason it doesn't appear more often is that it is so obvious as to be taken for granted. If you think it is false, then please do point out which step is incorrect. (iv) "And that ocean 'carbon sink' is so poor, ocean acidification has become one of the great pollution problems. That's exactly why suggestion of oceanic sequestering of a decade ago went to the trash heap. " Actually that is not correct. The surface waters are still taking up substantial amounts of anthropogenic emissions (note the evidence of an increase in the airborne fraction is highly equivocal, which suggests that the surface ocean has not yet saturated). The thing that limits the rate at which the oceans can take up CO2 on longer timescales is the transfer of CO2 from the surface waters to the deep ocean. On long timescales, the oceans are still very powerful carbon sinks. -
dunc461 at 00:36 AM on 4 March 2012Greenhouse Effect Basics: Warm Earth, Cold Atmosphere
Tom Curtis @51 Thanks, I really appreciate your help and look forward to your future posts. It really didn’t make sense to me that the energy absorbed would only be emitted at certain wavelengths. That is why I was looking for higher "window" rates at the top of the atmosphere. Lapse rate is a new term for me. My current understanding is that lapse rate is defined as “The rate at which air temperature falls with increasing altitude.” and it is effect of the GHCs on lapse rate that causes the ”greenhouse” effect. In simple terms, am I correct in saying that the temperature of given layer in the atmosphere (except the top and bottom layers) is the temperature at which the sum of the following is equal to zero. BBR = Black Body Radiation 50% BBR Generated in the layer below + BBR that passed through the layer below + 50% BBR Generated in the layer above + BBR that passed through the layer above + Heat of absorption by GHC +/- Sensible Heat gain or loss by convection */- Latent Heat gain or loss - Heat of adiabatic expansion - Portion of pass through BBR from layer above to layer below - Portion of pass through BBR from layer below to layer above - 50% BBR Generated to the layer below - 50% BBR Generated to the layer above = 0 -
Bob Lacatena at 00:32 AM on 4 March 2012Wall Street Journal 'Skeptics' Misrepresent the IPCC
52, Anteros, The problem is that any focus on the "prediction" and the "error" concerning the emissions scenario is a huge waste of time, a distraction, and down-right silly. If the emissions scenario was inaccurate for a period of five or ten years it simply means they failed to properly predict the economics and policies of an entire world of hundreds of nations and billions of people over a very short time frame. What is more important is that it says nothing whatsoever about the science. And it provides no comfort whatsoever to those who wish to claim that the science is invalid. You are like a man who has been told he as diabetes because you eat too much ice cream, but the doctor was wrong about the ice cream, your real sin is chocolate cake. So do you walk out of the doctor's office whistling gleefully because he was wrong about the factors behind your diabetes? Your focus on the emissions scenario and your eagerness to use words like "big error" and "wrong" demonstrate nothing except for your own narrow focus and apparent wish to ignore the science at any cost. And your eagerness to declare the entire process as wrong rather as a result, rather than to recognize that the difference in emissions scenario confirms, rather than diminishes, the strength of the science, makes all of your words suspect. -
Dikran Marsupial at 00:29 AM on 4 March 2012Postma disproved the greenhouse effect
YOGI you have been asked to clarify your position and give an explicit answer on two questions. Instead you have given only the vaguest response possible. This is an indication that you are trolling. Please demonstrate that you are not by giving direct, unambiguous answers to the questions you have been asked. -
Anteros at 00:22 AM on 4 March 2012Wall Street Journal 'Skeptics' Misrepresent the IPCC
Lotharson - I'm not sure you understand actually what a prediction is If the only thing the IPCC was offering up to the world was an estimation of climate sensitivity, the FAR would have been a very short document. It baffles me that you don't understand the comment "the emissions scenario was the big error". Unless you want to backtrack and say it was the climate sensitivity? When you say "the BAU scenario never eventuated you are absolutely right. But you fail to see that it was defined in a specific manner - that did eventuate. In other words "few or no steps were taken to limit the emission of GHG's". So this is why Barry Bickmore said the predictions were "way off" and Gavin Schmidt said they were "wrong" - because they were What is so hard to understand/admit about that? Of the two constituents of the prediction, one of them was very wrong. See Gavin's original comment for clarification if you're still confused. -
Lotharsson at 23:30 PM on 3 March 2012Wall Street Journal 'Skeptics' Misrepresent the IPCC
Anteros:The emissions scenario was the big error in 1990
Don't be ridiculous - and don't fallaciously pretend that there was only one scenario. They provided four, precisely because they couldn't predict what the world would do. It's horrendously illogical and deeply disingenuous to complain that predictions predicated on a scenario that did not eventuate are wrong - especially when other scenarios were provided that were much closer to realised emissions. Speaking of which:For the BAU scenario ...
How many times do people have to point out that the BAU scenario never eventuated, and therefore it is invalid to compare BAU scenario projections/predictions with observations before you understand that insisting on such an invalid comparison is utterly fallacious? Every single claim anyone makes about FAR temperature predictions that presume a BAU scenario is moot. Every single one. (Which doesn't leave many of yours in play.) For example, acknowledging that point entirely collapses your argument that the WSJ "FAR" trend line is somehow a valid and non-misleading choice because it is based on BAU/best sensitivity. If that's how they chose it, they are engaging in deliberate deception or deep incompetence. Clearly the only predictions/projections from FAR that can be validly compared directly to subsequent observations are those for scenarios that are reasonably close to the forcings that actually transpired - i.e. Scenario D, or for reasons explored above possibly Scenario C. And that in that case, even the high estimate in the table given in the OP was about 0.25 C per decade averaged over the century (and even less in initial decades), which is already well below the "FAR" trend line drawn by the WSJ. And the best estimate was somewhere between 0.17 and 0.18 C per decade - which is way below the WSJ trend line. The WSJ clearly did not choose the "best" estimate for anything approaching the actual forcings, which means they did indeed exaggerate the FAR projections. What part of this do you disagree with? And if you absolutely insist (although thus far without any supporting evidence) that the written text about predictions/projections is more authoritative than the graphs, then under the only valid scenarios for comparison with observations we have (from the IPCC quote given above):"...just above 0.1°C per decade (Scenario C) and about 0.1 °C per decade (Scenario D)"
(noting that those estimates did not provide uncertainty ranges in the quoted text). That comparison makes the WSJ "FAR" trend line egregiously overstated (i.e. by a factor of more than 3x), wouldn't you agree? -
Riccardo at 23:26 PM on 3 March 2012Postma disproved the greenhouse effect
Clouds warmer than the surface? It's called temperature inversion and does not lead to the formation of clouds. -
CBDunkerson at 23:16 PM on 3 March 2012Wall Street Journal 'Skeptics' Misrepresent the IPCC
I'm sorry, but why are we indulging Anteros's increasingly convoluted semantic 'justifications'? Sirrah. You entered this thread with a false quotation; "Based on current model results, We predict: An average rate of increase of global mean temperature during the next century of 0.3C per decade (with an uncertainty range of 0.2-0.5C per decade)" So far as I can see you have never acknowledged or explained this. So long as that remains the case I see no reason to believe that you are willing or able to discuss matters in good faith. You also seem unable to acknowledge that the BAU emissions scenario did not come to pass. As you say, it assumed that no steps would be taken to mitigate GHG emissions. Instead, we have seen the successful implementation of the Montreal Protocol (hardly a given when the research papers upon which FAR was based were written), the spotty implementation of the Kyoto Protocol, numerous smaller efforts at GHG reduction, and the collapse of the Soviet Union... all resulting in emissions measurably lower than those specified for the BAU scenario. Yet you continue to insist that this BAU scenario, rather than observed emissions, is the 'right' scenario to use for comparison to observed temperatures. Again, why should we take anything you say seriously when you are insisting that we should ignore observed reality? If we take the 2.5C 'most likely' sensitivity range from IPCC FAR, actual observed emissions, and the fact that the IPCC stated warming is expected to be lower in early decades and higher in later (rather than the straight line the WSJ 16 used) then we find the results are consistent with observed warming. The only way you get the IPCC FAR being 'way off' is by insisting on using the BAU Scenario A emissions... which are 'way off' from what actually happened. Thus, your sole objection would appear to be that the IPCC presented an emissions scenario which did not come to pass. In fact, they presented several. Because there was no way they could possibly know what mitigation efforts and economic conditions would exist in the future. Your insistence on focusing only on the highest of those possible scenarios as 'their prediction' is thus perverse. -
YOGI at 23:12 PM on 3 March 2012Postma disproved the greenhouse effect
Back-rad works for sure, you can feel the warmth of clouds on a cold night. So as long as it warmer than the surface, I have no objection. -
Anteros at 22:15 PM on 3 March 2012Wall Street Journal 'Skeptics' Misrepresent the IPCC
HH @ 47 To confirm that we're not disagreeing about obvious things. The CS of 2.5 is certainly close to the current best estimate. The predictions indeed have two fundamentally different components - the emissions scenario and the CS. Either (or both) can be the reason a prediction fails to match subsequent events. The emissions scenario was the big error in 1990. -
Anteros at 22:10 PM on 3 March 2012Wall Street Journal 'Skeptics' Misrepresent the IPCC
Tom Curtis - I'm a bit baffled. You state that the word prediction is in the title of the SkS article. Indeed - that would lead one to believe there was going to be some reference to the IPCC FAR prediction. There isn't - at all. It is indeed true that the word is allowed in reference to a 1975 paper. This seems to me to prove my point - and I apologise for not anticipating some astonishing pedantry. It is true, then, that the word 'prediction' occurs once in the article, having nothing whatsoever to do with the IPCC FAR. Do you have any concern about why the predictions of the FAR vanished completely in an article about the FAR predictions. If the WSJ authors had done that, what might you have (legitimately) said? You claim that the FAR prediction comes with an error range. Again, indeed it does, but the limits of that error range (the specified uncertainty) are merely the two other CS's considered - 1.5 & 4.5C/2xCo2. For the BAU scenario and the best estimate of 2.5C/2xCo2 there is only one prediction - 0.3C per decade. Whatever quibbles there are about hundredths of a degree, the claim that the WSJ line is nearest the 'high' sensitivity is false. It is nearest the best estimate. I should repeat, again, that from the very beginning of this thread (and the thread at RC which prompted this one) I have made the point that I agree with Professor Bickmore's view which drastically disagrees with the original SkS article. That was - and is - the motive for my commentry. Hyperactive Hydrologist - the predictions of the FAR given to the relevant world leaders by the IPCC were specified in both the SPM and the Overview of the FAR. Tom Curtis quotes them @ 13. As I have mentioned previously the 1992 UNFCCC was constructed and signed on the basis of the FAR predictions. The fact that, as Barry Bickmore says, they were "way off" is not something to sweep under the carpet or to pretend never happened. Before moving forward with better predictions (as happened by SAR '95) it is surely important to admit that the predictions were, in fact, "way off". To hide from that fact is disingenuous.Response:[DB] To be clear, the individual perpetuating "astonishing pedantry" is you. You entered this thread with a straw-man mis-quote and have been tearing at that house of cards you erected since.
To hide from that fact is indeed disingenuous.
-
Hyperactive Hydrologist at 21:59 PM on 3 March 2012Wall Street Journal 'Skeptics' Misrepresent the IPCC
Apologies, It seems I failed in reading the executive summary. The word predicted appears in point e) in relation to the BAU scenario. However the BAU scenario assumes a certain emission trajectory and radiative forcing and therefore can be seen as a prediction. I feel like I am quibbling over semantics. For me the important point I am taking from this article is that a large proportion of the uncertainty in climate models lies with the assumptions made in the scenarios. This for me increase my confidence in the actual models. -
Hyperactive Hydrologist at 21:18 PM on 3 March 2012Wall Street Journal 'Skeptics' Misrepresent the IPCC
Maybe we need to include some definitions taken from the TAR. Unfortunately they didn't seem to do a glossary for the FAR. Climate prediction A climate prediction or climate forecast is the result of an attempt to produce a most likely description or estimate of the actual evolution of the climate in the future, e.g. at seasonal, interannual or long-term time scales. See also: Climate projection and Climate (change) scenario. Climate projection A projection of the response of the climate system to emission or concentration scenarios of greenhouse gases and aerosols, or radiative forcing scenarios, often based upon simulations by climate models. Climate projections are distinguished from climate predictions in order to emphasise that climate projections depend upon the emission/concentration/ radiative forcing scenario used, which are based on assumptions, concerning, e.g., future socio-economic and technological developments, that may or may not be realised, and are therefore subject to substantial uncertainty. -
Hyperactive Hydrologist at 21:11 PM on 3 March 2012Wall Street Journal 'Skeptics' Misrepresent the IPCC
Anteros, I am really confused by your "predictions" "projections" issue. I have looked through the IPCC FAR chapter 6, the modelling chapter, and the title of sub chapter 6.6, containing the modelling results, clearly states - 6.6 Projections of Future Global Climate Change. The chapter itself contains the word predictions twice. Both occasions in the introduction when discussing types of climate models. The word prediction never occurs in the sub chapter 6.6. -
Tom Curtis at 21:08 PM on 3 March 2012Wall Street Journal 'Skeptics' Misrepresent the IPCC
Anteros @22, I am happy to concede that you used whatever method you claimed, but unless you are one of the authors of the WSJ article, or have received private communication from them, your conjecture about the method they used has no more standing than does Keith Pickering's conjecture. Never-the-less, let us assume that you are right. So, suppose we examine the IPCC FAR to see what their prediction of temperature rise was for the first few decades of the 21st century. From the executive summary of Chapter 6, we read:"e) Based on the IPCC Business as Usual scenarios, the energy-balance upwelling diffusion model with best judgement parameters yields estimates of global warming from pre-industrial times (taken to be 1765) to the year 2030 between 1.3°C and 2.8"C, with a best estimate of 2.0°C. This corresponds to a predicted rise trom 1990 of 0.7-1.5°C with a best estimate of 1.1oC. Temperature rise from pre-industrial times to the year 2070 is estimated to be between 2.2°C and 4.8°C with a best estimate of 3.3°C This corresponds to a predicted rise from 1990 of 1.6°C to 3.5°C, with a best estimate of 2.4°C"
You will notice that: 1) The best estimate temperature rise from 1990 to 2030 is 1.1 degrees C, or 0.275 degrees C per decade. That is 11.3% less than the trend shown by the WSJ article (estimated as 0.31 C per decade by pixel count on the graph), so on your terms they have over estimated the IPCC FAR prediction by 12.7%. That is the very best that can be said for your,and the WSJ 16's case, and it isn't much. 2) The best estimate temperature rise from 1990 to 2070 is 2.4 degrees C, or 0.3 degrees C per decade. That is 9% greater than the projected trend per decade from 1990 to 2030. Therefore your frequently made contention that the IPCC FAR "predicted" a constant rate of temperature increase over the full century is false. Therefore you are not justified in using the stated average trend over the full 110 year period from 1990 to 2100. 3) The prediction comes with an error range, the low end of which is a 0.7 degree C rise from 1990 to 2030. That corresponds to a decadal trend of 0.175 degrees C per decade. This compares to the 0.185 degrees C per decade from the instrumental record (GISTEMP) over the period 1990-2011 (0.16 HadCRUT3, trends from woodfortrees.org). The IPCC FAR clearly indicated that short term variability would prevent a monotonic increase, saying:"Because of other factors which influence climate, we would not expect the rise to be a steady one."
Therefore to show that their "predictions" had failed, you would need to show that temperature increases had fallen outside error range on all temperature series. Clearly, neither you nor the WSJ 16 have done so. What is more, purporting that "... the projections exaggerate, substantially, the response of the earth's temperature to CO2 ..." while not showing the error bars on the prediction, when those error bars show the prediction has not yet been falsified is deceptive conduct. So much can be said using your, and (as you claim) the WSJ 16's standard. That is, even if their approach was correct, they have significantly overstated the predicted trend, failed to acknowledge that the trend increases over time during the century, and failed to show error bars which would refute their primary claim in relation to the graph. But their standard is not correct. It amounts to interpreting a conditional as a direct statement. In every location that the IPCC FAR makes a temperature "prediction", they actually make three or four, specifying a prediction under BAU, and then specifying the prediction for other forcing scenarios. Therefore they do not predict that temperatures will rise by 1.1 degree C by 2030. Rather,they predict the temperature increase on the assumption of one forcing scenario, and then specify it for other forcing scenarios. Therefore it is not true to say they predicted a given temperature increase without specifying the forcing scenario used. There predictions have the logical form of: If forcing scenario A, temperature range A. As is shown above, the actual forcing scenario followed was scenario D, and therefore the IPCC FAR prediction for events as they turned out is their prediction for scenario D. A case can be argued that we should adjust the IPCC FAR predictions to account for their overestimate of the forcing of a doubling of CO2, which they overestimate by 110%. In that way you would make their "predictions" conditional on changes in GHG concentrations rather than on changes in forcings. Based on that, an actual forcing of +0.63 W/m^2 should be treated as a forcing of 0.7 W/m^2 in assessing their predictions. On that basis we should use their scenario C predictions (0.18 C/ decade) rather than their scenario D predictions. But there is no basis for using their scenario A predictions, because the projected changes in GHG concentrations did not come to pass. This insistence that conditionals be treated as direct statements is bizarre. Done consistently, it literally allows you to infer anything you want, and hence is the sign of a fool. Done strategically it is the sign of a scoundrel who has no compunction in ignoring rational reasoning for rhetorical purposes. It is of a piece with your still unacknowledged, and still unapologetic misquotation of the IPCC FAR. -
Tom Curtis at 19:38 PM on 3 March 2012Wall Street Journal 'Skeptics' Misrepresent the IPCC
Anteros @36, the original SkS post on the FAR contains the word "predictions" twice - once in the title and again when referring to "Broecker's 1975 prediction". Your original claim was,"Now, my point was that you never mentioned [any] of this in your article. You never mentioned the word "prediction" once."
Clearly that claim is false. Grow a set and admit error.Moderator Response: [Riccardo] unclosed tags fixed -
Albatross at 19:15 PM on 3 March 2012Wall Street Journal 'Skeptics' Misrepresent the IPCC
Anteros, "You misrepresent me by saying I claimed Keith never used the word 'prediction'. I referred to the original post, as you did, and which was discussed at RC - which you have referred to yourself." I find it ironic you taking exxception to people (accidentally) misprepresenting you when you misrepresented Gavin Schmidt. However, that I misrepresented you was unintentional (it really was), and I apologise for that. Here we tend to speak to the thread at hand, so I naturally assumed that you were discussing Keith's post. Unfortunately, you seem determined to be hung up on semantics-- one needs to step back and look at the bigger picture and the topic of this thread-- Lindzen using a chart that does not support his claim that the models exaggerate the warming (i.e., climate sensitivity). Surely we can all agree on that point. Do you agree that their claim that the instrumental record supports a lower climate sensitivity is not supported by the literature, as I showed in my post 27 above. It is late here and I need to sign off. Alex makes some good points,and I hope that he can access the actual data instead of estimating trends off charts. Maybe we`ll get to the bottom of this yet. I look forward to seeing your list of errors made by Lindzen et al., whenever you get around to it of course. -
Albatross at 19:01 PM on 3 March 2012Wall Street Journal 'Skeptics' Misrepresent the IPCC
Anteros @31, "You say I "claim to be a true skeptic". This is totally false - I have never made such a claim, and it seems you have made many other incorrect assumptions too." I'm really not sure how to interpret this, I was giving you the benefit of the doubt when I stated that you claim to be a true skeptic-- that is the deafult position, at least for a good scientist. But by your own admission you now state that you are not a true skeptic. That is a rather odd assertion for you to make. How Lindzen et al. arrived at that slope is actually not immediately obvious, because they failed to provide specifics. But this is actually all moot-- because what you keep failing to recognize is that the entire premise for their claim that the models are wrong relied on that figure, when the figure in fact does not support their claim. BAU did not happen as expected, as was explained to readers in the above OP, but Lindzen et al. did not share that with their audience. Now I am open to the possibility that Keith erred in his calculations in Table 1. Right now, however, it appears the only way of obtaining a slope of 0.3 C or more for 1990-2010 is to use BAU and a CS of 4.5 C. -
Alex C at 18:52 PM on 3 March 2012Wall Street Journal 'Skeptics' Misrepresent the IPCC
I too am interested in how the 0.24 figure was obtained. I myself just did rough pixel-counting to get 0.5˚C over the time period in question (1990-2010), though that's not nearly as substantive as having the decadal means. I unfortunately cannot download the data, it's available here: http://cera-www.dkrz.de/WDCC/ui/Compact.jsp?acronym=IPCC-DDC_FAR_GISS_SCA but one needs to have a login to obtain it. Unless someone else knows of where this is available on the web...?
Prev 1234 1235 1236 1237 1238 1239 1240 1241 1242 1243 1244 1245 1246 1247 1248 1249 Next


