


 Arguments


Recent Comments
Prev 1239 1240 1241 1242 1243 1244 1245 1246 1247 1248 1249 1250 1251 1252 1253 1254 Next
Comments 62301 to 62350:
-
From Peru at 03:38 AM on 5 March 2012Roy Spencer's Junk Science
RonManley: You said:"a sensible value for CO2-equivalent sensitivity (0.89 °C for a doubling of CO2-equivalent)" Isn't that too little? Most climate analysis found a climate sensitivity around 3ºC for a doubling of CO2. -
RonManley at 03:12 AM on 5 March 2012Roy Spencer's Junk Science
Can natural oscillations explain the climate? Roy Spencer would seem to argue that this is the case. Recently (Scaffeta’s Widget Problem) you had an article on Scafetta’s claims to be able to model climate just using natural cycles. At that time I produced two versions of a very simple regression model: the first using only sun spots (as a proxy for radiation), optical mean depth (for aerosols) and the Atlantic Multi-decadal oscillation (as a representative oscillation): the second model added CO2 as a fourth independent variable. The first model was hopeless – it represented some of the variations but none of the trend. The second model was much better – it represented both the variations and the trend, and was actually more accurate than a 23 model IPCC ensemble. At that stage I made a tentative estimate of CO2 sensitivity which I now realise was in error (I multiplied the CO2 coefficient by the number of years of data (156) not the increase in CO2 (105 ppm)). Since then I have tried replacing CO2 with CO2-equivalent. This model has slightly improved accuracy (r2 = 0.90) and a sensible value for CO2-equivalent sensitivity (0.89 °C for a doubling of CO2-equivalent). You can see the model herehere. I fully realise that it is dangerous to read too much into a regression type model but it would be an interesting challenge to see if anyone can model the temperature from 1856 to the present as accurately as this model with a 4 independent variables and without invoking CO2. -
R. Gates at 01:46 AM on 5 March 2012Roy Spencer's Junk Science
The Foster and Rahmstorf study, along with other attribution studies ar of course powerful evedence that Spencer is quite mistaken. Furthermore, the entire issue of deeper ocean heat content is not even considered. The greater thermal inertia and energy storage capacity of the deeper ocean makes it a much better metric for seeing what actually was occurring during the past decade with Earth's energy balance. The troposphere has a far lower heat capacity and lower thermal inertia and is far more subject to the noise of short-term natural variations, and thus requires filtering to see any underlying trend. In looking at the energy storage of the deeper ocean over the past decade we see it stored more energy than any 10 year period out of the past 40. Hardly a sign of a planet that is cooling. -
R. Gates at 01:33 AM on 5 March 2012Warming to Ignite the Carbon Bomb
Owl905, Of course scientists like William Ruddiman would argue that human land use changes beginning with the clearing of forests some 8,000 years ago and agriculture 5,000 years ago already began altering atmospheric chemistry enough to change the temperture profile of this interglacial. Thus, from Ruddiman's perspective the Anthropocene began many thousands of years ago and we created our own conditions for more stable subsequent temperatures. In previous interglacials, human ancestors were not developed nor widespread enough to have altered atmospheric chemistry to the same degree as they did starting with the early Holocene. This alteration of atmospheric chemistry has of course only accelerated as civilization has advanced, and now of course the issue becomes one of excess, as human greenhouse gas emissions can be thought of as a " human volcano" in term of the rate at which they are flowing into the atmosphere, vastly overwhelming any natural mechanisms that might remove them. -
CBDunkerson at 01:31 AM on 5 March 2012Wall Street Journal 'Skeptics' Misrepresent the IPCC
Tom wrote: "As has already been well established, Anteros understanding of "arguing in good faith" also involves gross misquotation of, and misrepresentation of the IPCC FAR and Gavin Schmidt." Not to mention repeatedly ignoring the presentation of overwhelming evidence directly contradicting his claims and then simply repeating his (blatantly false), 'I am so disappointed that no one has answered me' mantra. When someone is in denial over the content of the discussion itself there really is no point. -
Tom Curtis at 00:07 AM on 5 March 2012Wall Street Journal 'Skeptics' Misrepresent the IPCC
Anteros claims at 68 that:"Graph A provides a very clear visual image of what the FAR defines as the high sensitivity prediction - 0.5C per decade. You'll note that it is virtually straight."
For your convenience, here is a graph illustrating that contention: As has already been mentioned by Keith Pickering @58, it is obvious that the slope of the graph prior to about 2020 is less than the slope from about 2020 to 2100. Given this obvious fact, Anteros apparently believes that "arguing in good faith" requires him to use the slope of the line from 2020 to to 2100 as the "IPCC prediction" for the period 1990 to 2011.
In this regard, it should be noted that in his post @46, Anteros claimed that:
As has already been mentioned by Keith Pickering @58, it is obvious that the slope of the graph prior to about 2020 is less than the slope from about 2020 to 2100. Given this obvious fact, Anteros apparently believes that "arguing in good faith" requires him to use the slope of the line from 2020 to to 2100 as the "IPCC prediction" for the period 1990 to 2011.
In this regard, it should be noted that in his post @46, Anteros claimed that:
"You claim that the FAR prediction comes with an error range. Again, indeed it does, but the limits of that error range (the specified uncertainty) are merely the two other CS's considered - 1.5 & 4.5C/2xCo2."
The upper limit of the error range was a rise of 1.5 degrees C over four decades, or a trend of 0.375 C per decade. This compares with his current (@68) estimate that the trend rate over that period for scenario A with 4.5 C per doubling of CO2 is 0.5 C per decade. So, apparently Anteros believes that "arguing in good faith" means making contradictory assertions about the same situation in different contexts based on whatever is rhetorically most useful. As has already been well established, Anteros understanding of "arguing in good faith" also involves gross misquotation of, and misrepresentation of the IPCC FAR and Gavin Schmidt. I am certainly glad that none of the SkS regulars "argue in good faith" as Anteros appears to define the phrase. We have far more integrity than that. -
Riccardo at 21:14 PM on 4 March 2012Roy Spencer's Junk Science
Consistency is not an option in some quarters and that's fortunate because it allows us to easily discriminate between good science and bad science. Of the unfortunate side of this story we know. -
John Brookes at 20:58 PM on 4 March 2012Roy Spencer's Junk Science
Its very similar to the stock market, which can drop and even not rise over a 10 year period, but the trend is unambiguously up. -
funglestrumpet at 20:26 PM on 4 March 2012Wall Street Journal 'Skeptics' Misrepresent the IPCC
dhogaza @ 66 Agreed. It just seems to me that if we are going to get the public to agree with what is rapidly becoming an urgent need for action on the issue, we cannot continue letting Murdoch and his like have such influence on the issue. While Murdoch might legitimately claim that his editors have editorial freedom, it would be a very unusual editor to be so politically inept as to not pay heed to the views of those responsible for them keeping their job. It calls to mind the probably apocryphal tale of the company chairman saying: “It is only a suggestion, gentlemen, but don’t forget who’s making it.” In the U.K., Murdoch has just lost a lot of influence because the politicians have at last found strength in numbers and given him the finger – a bit like a group of shopkeepers getting together to reject a mafia protection racket; on reflection, a lot more than a ‘bit’ like. Pity we can’t give him the finger globally. Imagine if all the Murdoch owned American media had a completely and genuinely independent editorial policy. They can’t all be single without children or grandchildren who will suffer if we continue with business as usual. Some of them must have learnt that sex is intended to be performed as a duet instead of in solo. I don’t speak American English, but I think the word ‘jerk’ applies somehow. -
Anteros at 19:10 PM on 4 March 2012Wall Street Journal 'Skeptics' Misrepresent the IPCC
(-snip-) It is also surprising that my criticisms remain unanswered. I found it encouraging to agree with a point made by Barry Bickmore, and I can't help notice that not one person has made a comment to him, but my observation of exactly the same thing provokes such ire amongst the regulars here. The most important point about the attempt to discredit the WSJ article [which, I repeat, I have no motive to defend - it is just a poor op-ed] is the allegation that the 1990 FAR line is closest to the high sensitivity prediction. It isn't - that is false. Graph A provides a very clear visual image of what the FAR defines as the high sensitivity prediction - 0.5C per decade. You'll note that it is virtually straight. Remember that the central best estimate is 0.3C (graph B). The WSJ line is 0.32C. Here is what the post above says -Looking back at Table 1, only one projection is anywhere close to the 0.32°C per decade increase that the WSJ graph shows
That is because the numbers in Table 1 are completely different from the numbers given by the FAR. The FAR says 0.5C per decade, Keith Pickering's table 1 says 0.35C. Even Albatross concedes that there may have been a mistake. But Keith Pickering defends it. (-snip-)Moderator Response:[DB] As Tom Curtis has amply demonstrated at comment 52 above and at comment # 70 below, and by many others at various points in this thread, you continue to erect a house of misquote cards and then proceed to demolish them. All the while throwing inflammatory accusatory darts questioning the integrity of others (multiple instances in multiple comments, since snipped).
Moderating this site is a tiresome chore, particularly when commentators repeatedly submit offensive or off-topic posts. We really appreciate people's cooperation in abiding by the Comments Policy, which is largely responsible for the quality of this site.
Please note that posting comments here at SkS is a privilege, not a right. This privilege can and will be rescinded if the posting individual continues to treat adherence to the Comments Policy as optional, rather than the mandatory condition of participating in this online forum.
Finally, please understand that moderation policies are not open for discussion. If you find yourself incapable of abiding by these common set of rules that everyone else observes, then a change of venues is in the offing.
Please take the time to review the policy and ensure future comments are in full compliance with it. Thanks for your understanding and compliance in this matter.
-
owl905 at 18:07 PM on 4 March 2012Warming to Ignite the Carbon Bomb
Followup on R.Gates comment - the current interglacial was already an anomaly - it didn't peak and decline like the last three interglacial periods. The 'lucky' event seems to be the Younger Dryas (the Lake Agassiz puzzle). Somehow (or consequently), the spike was intercepted by a cold period ... and temperatures steadied up until the Industrial Revolution. As R. Gates suggested - we've now artificially provided the spike-driver to re-instate the natural high and probable subsequent decline (and a gigaload of GHGs to boot). The implication that this may take our current standard of living with it ... is just minor collateral damage in the scheme of things. "Civilization is Man's way of showing Nature who's boss." - quip from my webpages 15 years ago. -
Tom Curtis at 17:18 PM on 4 March 2012Nordhaus Sets the Record Straight - Climate Mitigation Saves Money
Bernard J. @9, Fairoakien explicitly asked about the costs "to Canada". I think that it is probably that Canada will be a net economic beneficiary of global warming well into this century, and possibly into the next one as well. The same is probably true of Russia (particularly Siberia) and Finland. As you point out, however, that benefit will come at the price of very substantial costs elsewhere in the world. Quite apart from the moral issue of gaining benefits from actions that directly harm others, should these nations pursue a high emissions policy, the fact is that the world will descend into a sustained economic crisis at best if global warming is not mitigated. While Canada's farmers may benefit, I doubt that Canada over all will benefit from doubling it's arable land in the face of economic conditions equivalent to a permanent global financial crisis, or 1930's depression. Finally, Fairoakien is wrong in asserting that benefits are ignored when assessing the costs of global warming. The IPCC in particular considers both costs and benefits in its assessments. -
Bernard J. at 16:46 PM on 4 March 2012Nordhaus Sets the Record Straight - Climate Mitigation Saves Money
Fairoakien asks at #5:What are the costs to canada [sic] if the climate becomes warmer and farming opens up in larger areas.
Aside from the hints given in johngray's pointer at #7, Fairoakien needs to consider that the geometrical premise of his question does not necessarily stand up. As the poleward borders of growing regions move further poleward, the equatorially-oriented borders may (and usually will) themselves move also. Fairoakien needs to consider what happens to the surface area of a latitudinal band that spans a particular number of degrees of arc, when the arc band moves away from the equator... -
Tom Curtis at 10:37 AM on 4 March 2012Greenhouse Effect Basics: Warm Earth, Cold Atmosphere
dunc461 @60, your itemization of the relevant processes is basically correct, excepting (as noted by Bob Loblaw) absorption from the sun and (in GCMs and the real atmosphere) lateral heat transfer. More important than those omissions is that it omits the fact that heat loss or gain by convection is governed by the difference between the existing lapse rate at a particular place and time (the environmental lapse rate) and the lapse rate at which convection with consequent loss of pressure involves no loss of heat (the adiabatic lapse rate, or if their is moisture in the air, the moist adiabatic lapse rate). For non-chemical engineers who are reading this, "adiabatic" processes are processes in which there is no net transfer of energy. The result is that if other effects make the lapse rate greater than the moist adiabatic lapse rate, convection will increase until the lapse rate returns to the moist adiabatic lapse rate. Conversely, if other processes cause the lapse rate to be less than the moist adiabatic lapse rate, convection will weaken thus tending bring the lapse rate back to the moist adiabatic lapse rate. The result is that for much of the Earth, in the troposphere the lapse rate can be taken as being determined by the moist adiabatic lapse rate. There are limits on this process, notably at the poles and the tropopause (and above) where convection is weak so that other factors dominate. This is the subject of my intended next post in this series. -
amhartley at 10:35 AM on 4 March 2012Nordhaus Sets the Record Straight - Climate Mitigation Saves Money
On assessing investments using ratios vs. differences: The tendency to use ratios indiscriminately seems like a basic human weakness, not necessarily a means of justifying inaction on climate change. Time Magazine had a good article last year about how the public generally assesses cost / benefits. Imagine that you were going to buy a coat for $50 & you find at the last minute that the store down the street sells the same thing for $20. Chances are, you would take the time to walk to the other store to save the $30. Now imagine that you were buying a bicycle costing $1,000, & at the last minute you learn that the store down the road sells the same bike for $950. Most people would not take the time to save that $50 difference, even though it's greater than the $30 they might save on the coat. Somehow, it seems, we are wired to over-emphasize ratios. -
Bob Loblaw at 10:31 AM on 4 March 2012Greenhouse Effect Basics: Warm Earth, Cold Atmosphere
dunc461: Note that I said it was unusual, not wrong (except for the lack of solar). In essence, the real atmosphere works as a continuous function, not a series of layers, so the "best" way is to use calculus and analog solutions to describe the system. We almost invariably end up breaking things into layers (or a series of discrete points that kind of look like layers) for practical purposes, however - e.g., finite difference methods for solving differential equations. Beer's Law is a fun example: there is an integrated form (e.g., I/I_0 = exp(-tau*m)) that I used to teach, but a chemist might be more familiar with it in a differential form (e.g, dI/dz = ...) because that's how it is commonly used in a lab when measuring concentrations of solutions by optical methods (sodium comes to mind). Neither is "wrong", but one may be more familiar depending on a person's background, and one may be more convenient, depending on the usage. -
R. Gates at 10:15 AM on 4 March 2012Warming to Ignite the Carbon Bomb
Good point nigelj. One could of course extrapolate that backward to the beginning of the Holocene itself, and suggest that civilization's rise was part of a positive feedback response to the warmer temperatures which allowed for the rise of agriculture which was necessary for civilization. Thus, during this particular interglacial period, one particular species of animal was ripe to take advantage of the warmer temperatures and thus developed the means to further warm the planet by the release of massive amounts of greenhouse gases. So to that extent, civilization is an ongoing positive feedback response to the initial Milankovitch cycle that shifted to begin warming the ocean, melting the ice sheets, outgassing CO2, etc. The difference between this interglacial and others of the past few million years is clearly civilization as a positive feedback response to warmer interglacial temperatures-- hence why giving it the term Anthopocene is quite appropriate and should be marked as officially beginning when human civilization began altering atmospheric chemistry in a measurable way beyond individual human respiration. -
dunc461 at 09:57 AM on 4 March 2012Greenhouse Effect Basics: Warm Earth, Cold Atmosphere
Bob Loblaw @61 Thanks for your post. You have to forgive my approach. As an old Chemical Engineer, I tend to compare this process to a distillation column where back in day we used Theoretical Stages and did Heat and Material Balances. I used the generated BBR to designate the full spectrum radiation and the pass through BBR to represent the radiation where the energy in the GHC bands had been partially depleted. You are of course right about the solar radiation. I thought about that just after I completed the post. -
nigelj at 09:42 AM on 4 March 2012Warming to Ignite the Carbon Bomb
Positive feedbacks arent just limited to natural forces, climate change will cause changes in the patterns of humanity that will also cause positive feedbacks. Migration to escape problem areas will increase travel to stay in touch with homeland areas, itself increasing emissions. Relocation of of cities requires energy, air conditioning requires energy encouraging more fossill fuel use. The list could be endless. -
Bob Loblaw at 09:29 AM on 4 March 2012Postma disproved the greenhouse effect
YOGI @ 76: So solar radiation input is irrelevant, then? All this data I've seen where net IR is always negative, all day long, but the sun warms the surface, is wrong? (Presuming your DLR and OLR are Downwelling and Outgoing Longwave Radiation, not something to do with Lapse Rates.) [Snipped]Moderator Response: [JH] Please do not feed this troll, i.e., Yogi -
Bob Loblaw at 09:20 AM on 4 March 2012Wall Street Journal 'Skeptics' Misrepresent the IPCC
re: Alex C @ 60 I just used the eyecrometer on the provided "Reality vs. Alarm" graphic, and 0.1 looked like reasonable mid-range value from '89 to '93. The link to Tamino shows how you should do it, which is more in line with what you say, so I didn't see the need to analyze further. The other projections in the "Reality vs. Alarm" graph don't pop out quite the same way that the 1990 one does - they are much more in the middle. And the year of publication doesn't necessarily reflect the year that the projection starts - look at Albatross's updated TAR graph in comment 61. Although published in 2001, the projection starts to spread (gray band) from a point of origin in 1992. It takes time to collect data, run the models, analyze the results, etc. How would the WSJ graphic look if the first report was held off (contents unchanged) until 1992, and the SAR until 1996, the TAR was rushed out the door in 2000 instead of 2001, and the fourth delayed until 2008? Would the fake skeptics be saying "the warming greatly exceeds all the projections!"? Somehow, I doubt it. -
DSL at 09:20 AM on 4 March 2012Scafetta's Widget Problems
You know why, Robert. Given the current state of understanding in the general public, every alternative theory, no matter how absurd, must be addressed. If no one challenged Volker, I guarantee that within five years my mother-in-law, bless her simple lifestyle, would be telling me, "but I heard that Mercury is actually causing global warming. See, it's a natural cycle." Fifty years from now, were she still alive, she'd be telling us how we need to blow up Mercury instead of charging more at the pump (government conspiracy!). -
Robert Murphy at 09:15 AM on 4 March 2012Scafetta's Widget Problems
Why was Volker Doorman taken even halfway seriously? Look at his website; it's explicitly astrologically oriented with a new-age eastern mystical bent. There never *was* going to be a scientific argument from him. -
YOGI at 09:14 AM on 4 March 2012Postma disproved the greenhouse effect
Bob Loblaw "..extra warmth..) ? "..can lead to warming if all other heat fluxes remain constant. [Fundamental misunderstanding of physics.]" Al you can say is that it would be warmer with clouds than without, but there is no rise in surface temp` unless DLR is greater surface OLR.Response:[DB] You still avoid finishing your dialogue with Dikran in comment 73 above. You will not be able to move on until you finish that one already started.
-
John Hartz at 09:13 AM on 4 March 2012Oceans Acidifying Faster Today Than in Past 300 Million Years
The OP and Romm’s article are based on the findings contained in the peer-reviewed article, “The Geological Record of Ocean Acidification”, Hönisch, et al, Journal of Science, March 2, 2012: 1058-1063, DOI:10.1126/science.1208277 Unfortunately, this paper is behind a paywall. -
R. Gates at 09:07 AM on 4 March 2012Warming to Ignite the Carbon Bomb
I think this increase in forest fires represents some of Earth system feedbacks that Hansen has recently commented on that must be accounted for in determination of any final equalibrium response to the rapid increases in greenhouse gases we've seen. In addition to the drying of the forests, there is the issue of the warmer winters which allows insects, like the pine beetle to survive, and destroy more trees, which also ultimately increases carbon in the atmosphere, and thus these biological responses also figure into any final equalibrium response. Given that the we are seeing more fires and more insect infestations already from 394 ppm of CO2, we' ve not yet obviously even seen what the equalibrium response is to our current levels of greenhouse gases, and given that they continue to rapidly build, we'll never know what it would have been. -
John Hartz at 09:06 AM on 4 March 2012Oceans Acidifying Faster Today Than in Past 300 Million Years
Purely by coincidence, Joe Romm also posted today an article about the findings of the paper discussed in the above OP. The title of Romm’s article is:”Science: Ocean Acidifying So Fast It Threatens Humanity’s Ability to Feed Itself” It covers some ground not covered in the above OP. The two articles nicely complement each other. To access Romm’s article, click here. -
Bob Loblaw at 08:58 AM on 4 March 2012Postma disproved the greenhouse effect
YOGI@70 Wow. Basically three short sentences (not counting the single word "Correct" that starts the third paragraph) and we have both a strawman and a goalpost shift. Plus a fundamental misunderstanding of physics.... 1) Who said "all night long"? I'm comparing two scenarios at a single point in time, and how something/someone "feels" at that instant. No need to consider what might be going on hours away. [Strawman - I never said the conditions had to be maintained for a period of time.] 2) At a particular point in time, 30 C with rapid heat loss will "feel cooler" than 30C with a slow heat loss. No need to wait. [Goalpost shift - now "feels warm" or "feels cool" is replaced by "needs to be substantially cooler than skin temperature, or previous temperature". I can't tell which YOGI means.] 3) Whether something warms or cools is dependent on it total energy balance, not just the net IR. Even if net IR is negative (a loss), reducing that loss (making it less negative) can lead to warming if all other heat fluxes remain constant. [Fundamental misunderstanding of physics.] It may be that you're just expressing yourself poorly, but for me, it's "three strikes, you're out". -
dhogaza at 08:22 AM on 4 March 2012Wall Street Journal 'Skeptics' Misrepresent the IPCC
funglestrumpet: Murdoch didn't really change anything. The paper's editorial and op-ed pages were anti-science before he bought it (when science clashed with the papers political views). It published an infamous "satellite data shows cooling and is the wooden stake through the heart of global warming" piece when the very first UAH reconstruction was published. That was not the first attack on climate science, and that was long before Murdoch bought it. It published a bunch of pseudo-scientific attacks on issues like conservation and acid rain in its day, probably ozone layer stuff as well though I don't remember. It may be more a case of Murdoch buying a paper with an editorial stance much too his liking than of Murdoch buying a paper and twisting its editorial stance into alignment with his own. -
adelady at 07:21 AM on 4 March 2012Postma disproved the greenhouse effect
YOGI "clear sky, warm night, surface at 30 degrees C.." What all night long ?" I don't know where you live that causes you to be surprised at this, but it is quite realistic. Where I live the temperature at 2.00am was 30.7C a couple of nights ago. And it wasn't much less at 6.00am. -
funglestrumpet at 07:12 AM on 4 March 2012Wall Street Journal 'Skeptics' Misrepresent the IPCC
For me, the fact that the WSJ is owned by Rupert Murdoch says it all. -
Dikran Marsupial at 07:03 AM on 4 March 2012Postma disproved the greenhouse effect
YOGI, thankyou for answering one of my questions, the other was: "Also please state unequivocally whether you agree that in the example you provided that the presence of another blackbody increases the equilibrium temperature of both bodies." -
YOGI at 06:59 AM on 4 March 2012Postma disproved the greenhouse effect
"Dikran Marsupial" YOGI Please can you state unequivocally whether the mirror example in Postmas paper is incorrect or not. Do you agree that with the mirror in place the blackbody will have a higher equilibrium temperature. I think it incorrect as I implied in my analogy of two black bodies, that got snipped earlier. -
Dikran Marsupial at 06:52 AM on 4 March 2012Postma disproved the greenhouse effect
YOGI, you are incorrect. A simple extension of Postma's mirror example will demonstrate why you are incorrect. Your continued avoidance of answering the questions that would clarify your position on Postma's paper is beginning to look like evasion. -
YOGI at 06:46 AM on 4 March 2012Postma disproved the greenhouse effect
Bob Loblaw "a) clear sky, warm night, surface at 30 degrees C.." What all night long ? "Net IR at the surface is -140 W/m^2 (i.e. a loss of 140 W/m^2). Feels cool." Yes once it is much less than 30°C it will feel cool. "Are you trying to say that the surface (or you) will feel no extra warmth unless the overlying cloud is actually warmer than the surface?" Correct. In b) the presence of clouds will slow the rate of surface cooling, but cannot increase surface temp` unless they are at a higher temp` than the surface. -
Dikran Marsupial at 06:42 AM on 4 March 2012Postma disproved the greenhouse effect
YOGI, before you go any futher, please answer the questions I asked here. You have not yet clarified your position on the errors in the Postma paper that you chose to hang your hat on. -
YOGI at 06:34 AM on 4 March 2012Postma disproved the greenhouse effect
Eric (skeptic) So what's up with nighttime clouds? Clouds emit infrared radiation to the efficiently absorbing ground, keeping the ground (and thus the overlying air) warmer.: https://courseware.e-education.psu.edu/public/meteo/meteo101demo/Examples/Section6p04.html -
Albatross at 06:03 AM on 4 March 2012Wall Street Journal 'Skeptics' Misrepresent the IPCC
dhogaza @63, "Can't we just make it stop?" If only dhog, these guys are like energizer bunnies. But your point is taken. I made the mistake last night of breaking the DNFTT rule, and shall not make it again. I strongly urge others to (unlike I did), as difficult as it is, to refrain from FTT. -
dhogaza at 05:44 AM on 4 March 2012Wall Street Journal 'Skeptics' Misrepresent the IPCC
Gavin and "wrong": "[Response: Note that projections are a function of two things - the scenario and the model. What was wrong in FAR was the scenario (too fast growth rate of GHGs, no aerosols, no ozone, no BC etc.), not the model (though the projections were with simple emulators not GCMs). Indeed, models today have similar sensitivities and with the same scenario will give the same temperature rise. - gavin]" Anteros is saying nothing in this thread that wasn't said over at RC (other than his quote-mining Gavin in an extremely misleading way). Those refuting him are saying nothing new. His refusal to learn is clear. Can't we just make it stop? -
MA Rodger at 05:21 AM on 4 March 2012Wall Street Journal 'Skeptics' Misrepresent the IPCC
keithpickering @59 The FAR BAU was not just projecting large CFC increases, but also large methane increases. As one of the commenters on the RealClimate thread, I concluded at the time that the FAR BAU projection had stood the test of time well, projecting a 0.23 deg C /decade rise 1990-2010 for a higher GHG scenario than actually occurred. (Of course this is the same FAR that also contains the classic fig 7.1c complete with Medieval Warm Period & Little Ice Age.) The only mitigation I have seen for the poor representation of FAR BAU provided in the WSJ letter is perhaps AR4 fig TS.26 which also latches on to the FAR "0.3 deg C/decade" for the 21st century average and applies it to 1990-2005. Then, at least TS.26 had a more considered start point. And while that one aspect of TS.26 may be a bit of a low point, the WSJ graph actually represents the flawed and lacklustre pinnacle of correctitude in an otherwise grossly fallacious diatribe. -
Volker Doormann at 05:19 AM on 4 March 2012Scafetta's Widget Problems
Sphaerica says at 10:43 AM on 2 March, 2012 Volker, I do not need a mechanism... To be taken seriously, yes, you do. Hi Sphaerica, My impression is, that a discussion about this point will be snipped by a moderator as OT. (-snip-) V.Response:[DB] Off-topic dissembling and evasion snipped.
-
Albatross at 05:17 AM on 4 March 2012Wall Street Journal 'Skeptics' Misrepresent the IPCC
Bob @55, "They've started each IPCC prediction from the single value for that year, rather than a more realistic middle-of-the-noise value. " You raise a very valid point and yet another problem with their graphic that misrepresent the IPCC. It is interesting that you also noticed that, as I was pondering that very point myself this morning and the Tamino post that you linked to also came to mind. Using Lindzen et al's faulty logic, they would have felt justified in starting the predictions at the peak in 1998 had the AR been released that year, and that of course would be very wrong. This is just as bad, if not worse than Pat Michaels' repeated misrepresentation of Hansen et al''s 1988 prediction (well Hansen said it was "treading close to scientific fraud"). I guess the fake skeptics have, for now, given up on that one and have found a new set of predictions to tamper with to mislead the public. I wonder how MIT feels about one of its profs engaging in potential scientific fraud in the public eye? What is lost in this fake debate though is how well subsequent predictions have performed: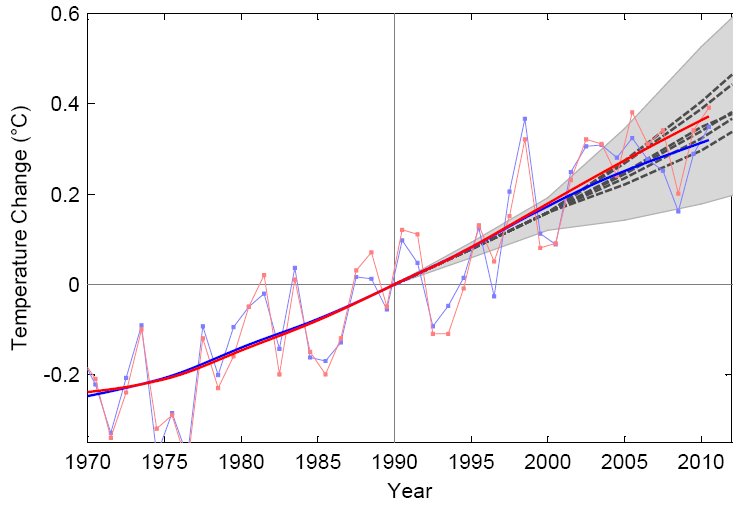 Caption: Annual global temperatures from NASA GISS (red) and Hadley Centre (blue) up to 2010, compared to the temperature projections of the IPCC TAR (grey dashed lines and grey range, as shown Figure 5d of the TAR Summary for Policy Makers). [Source]
Rahmstorf:
"Temperature trends are now near the centre of the TAR projections, with linear trends of 0.19 and 0.17 +/- 0.08 ºC per decade in the GISS and Hadley data, as compared to projected linear trends ranging from 0.15 to 0.20 ºC per decade in the TAR projections (depending on emissions scenario)."
Caption: Annual global temperatures from NASA GISS (red) and Hadley Centre (blue) up to 2010, compared to the temperature projections of the IPCC TAR (grey dashed lines and grey range, as shown Figure 5d of the TAR Summary for Policy Makers). [Source]
Rahmstorf:
"Temperature trends are now near the centre of the TAR projections, with linear trends of 0.19 and 0.17 +/- 0.08 ºC per decade in the GISS and Hadley data, as compared to projected linear trends ranging from 0.15 to 0.20 ºC per decade in the TAR projections (depending on emissions scenario)."
 [Source]
-
Alex C at 04:44 AM on 4 March 2012Wall Street Journal 'Skeptics' Misrepresent the IPCC
Bob makes a good point @55. The WSJ signatories appear to have started each projection in the year of the publication, and used an averaged trend starting from that year's temperature value. The models project the entire twentieth century though, and as such it would be more appropriate to zero the models at the same base period used by HadCRUT3. However, I wouldn't say that the effect would be as great as lowering the starting point to 0.1 in the figure above. The 1961-1990 average for the model runs seems to be just under 0.75, if not 0.75 itself. The change to 1990, though, is about 0.2˚C, which would drop the start value of that graph above by only about half a degree celsius (this is a rough estimate). The effect is not as important as the effects of using the correct trend over that time period, and the correct forcing (both scenario-wise, and correcting for the overstated concentration/forcing relationship I point out and Tom expounded). -
keithpickering at 04:17 AM on 4 March 2012Wall Street Journal 'Skeptics' Misrepresent the IPCC
Anteros #50 When you say "the BAU scenario never eventuated” you are absolutely right. But you fail to see that it was defined in a specific manner - that did eventuate. In other words "few or no steps were taken to limit the emission of GHG's". BaU was defined in an even more specific manner in the FAR Annex, and the BaU scenario shows a continuing large increase in CFCs throughout the 21st century. Only the FAR scenarios C and D show the effects of the implementation of Montreal. -
keithpickering at 04:06 AM on 4 March 2012Wall Street Journal 'Skeptics' Misrepresent the IPCC
Anteros @32 “Can I enquire how you got your figure of 0.35C per decade for the 'high' sensitivity and the BAU scenario? I ask because the FAR states that it is 0.5C per decade.” I extracted the graph from the pdf at high magnification, corrected the skew, and measured the pixel positions of the axes and the lines themselves. The slope in the first twenty years is obviously lower than it is for the entire century, even from a cursory examination. Pixel measurement allows you to quantify that. Sorry for the odd spacing of my previous post ... should have previewed first! -
keithpickering at 03:59 AM on 4 March 2012Wall Street Journal 'Skeptics' Misrepresent the IPCC
Anteros @22 "It seems you would all rather take the word of a sketchy, hand-drawn impressionistic graph than the specific written predictions of the FAR." The graphs and the text agree, when extended out to 2100. But the WSJ didn't extend their graphs out to 2100. And it is clear, looking at the graphs, that the IPCC projections indicate that the early part of their projection (the part we're in now) shows warming at a lower rate than the overall century-long rate. It is therefore utterly decpetive for the WSJ to use the overall century rate as the IPCC projection for the first twenty years: that wasn't the IPCC projection at all, for those first twenty years. "We used the 0.3 degrees per decade from the prediction of the FAR BAU. As I pointed out in my first comment, the error was in the SkS post above, suggesting that the [estimated from a graph] 0.32C was closest to the high climate sensitivity. It isn't - it is the 2.5C/2xCo2 best estimate." It is for the first twenty years. If the WSJ had wanted to be honest, they could have published the actual IPCC graph, which actually goes out to 2100. They didn't, and because they didn't, they gave a false impression of "where we should be now". "The FAR predicted, specifically that the BAU scenario would eventuate if few or no steps were taken to limit emissions of GHG's. And for those people clutching at straws with the Montreal protocol, that was signed and sealed 3 years before the IPCC FAR." The Montreal Protocol did not enter into force until 1989, and it is clear from the details of the emissions scenarios that neither BaU nor Scenario B anticipated any significant reduction of CFCs. See FAR Annex, figure A-3.Response:[DB] Fixed spacing.
-
dana1981 at 03:55 AM on 4 March 2012Wall Street Journal 'Skeptics' Misrepresent the IPCC
Bob - yes, there are really a lot of problems with the WSJ graphic, and we've only touched on a few here. The link in comment #1 to our post on the subject shows how to do the analysis properly. -
Bob Loblaw at 03:35 AM on 4 March 2012Wall Street Journal 'Skeptics' Misrepresent the IPCC
...while I'm at it.... Hasn't anyone noticed (or did I miss a comment?) that the original "Reality vs. Alarm" graph has used the trick that Tamino talks about here? They've started each IPCC prediction from the single value for that year, rather than a more realistic middle-of-the-noise value. The peak temperature for 1990 gives the "IPCC 1990" line a jump start above all the rest. If that projection started at 0.1 instead of 0.3, then the line wouldn't be that far off. By using 0.3, the graph is assuming that whatever caused the temporary upward spike in 1990-1991 will never go away as the "IPCC 1990" projection moves forward in time. -
Bob Loblaw at 03:21 AM on 4 March 2012Wall Street Journal 'Skeptics' Misrepresent the IPCC
Coming in late.... It looks like Anteros (or the sources he/she is using) are playing the following game: - both the expert and the fake skeptic agree that C = A * B - the expert says "my best estimate of B is 2.5, but it could be as low as 1.5 or 4.5" - the expert says "I don't know what A is going to be in the next 20 years. If it is 10, then C will probably be 25, but it could be as low as 15 or as high as 45, because of my uncertainty in B. Let's call that value of A 'Business as Usual'. If A is 5, then C will probably be 12.5, but in the range 7.5 to 22.5. If A is 2, then the range for C changes to 3 to 9, with a best estimate of 5". - 20 years later, it turns out that A was about 4, and that C was about 12, which implies that B is about 3. - To the expert, none of the scenarios for A were matched exactly, but the results for C = A * B, lead to only a slight change in the "best estimate" for B (within the range from 20 years ago), so the expert is pretty happy and thinks she's done well. After all, her area of expertise is in the estimation of B and the measurement of C, not guessing what will happen to A. - the fake skeptic, on the other hand, is claiming that the expert predicted that A would be 10 and B would be 4.5, so C should have been 45, so the fact that C was 12 means that the expert got everything wrong and can't be trusted to give us an accurate value for B. Whether the fake skeptic is really that silly, or thinks everyone else can be fooled is an exercise for the reader. -
Bob Loblaw at 02:51 AM on 4 March 2012Greenhouse Effect Basics: Warm Earth, Cold Atmosphere
dunc461: Again,a review of some "first principles". Gases do only emit and absorb at certain wavelengths (aka wave numbers), and this is a basic principle of spectroscopy. In Planck's law, emissivity is a function of wavelength. More so, Kirchhoff's Law says that emissivity equals absorptivity at the same wavelength (all other factors being equal), so if CO2 is absorbing at a particular wavelength, it should also emit at that wavelength. ...but as Tom has pointed out, energy absorbed by one molecule can be transferred to other molecules, so the bulk radiation emitted from a layer of the atmosphere has properties that are a mix of the bulk atmospheric constituents, not the single (or few) gases that do the absorbing. In your last post, I think you've roughly got the idea, but the way you are looking at it is a bit unusual, and you have missed one extremely important thing. The unusual part is that in radiative transfer, you usually just think of the upward-directed and downward-directed fluxes as individual values that occur (or can be measured) at a point in the atmosphere - not "generated by the layer below" - because it doesn't matter if is was emitted by the layer below, or whether it just passed through the layer below having been emitted from other layers further down. The usual way of describing this process is to use Beer's Law. Thus, the heating due to IR absorption is (upward IR)*(portion absorbed) + (downward IR)*(portion absorbed). This is just mathematical arrangement, however, and is done that way because it is easier to see what is going on and arrange things for computer calculation. The error is that you've forgotten about solar radiation. It is also being absorbed (according to Beer's Law), and needs to be included in the energy balance.
Prev 1239 1240 1241 1242 1243 1244 1245 1246 1247 1248 1249 1250 1251 1252 1253 1254 Next


