


 Arguments


Recent Comments
Prev 1247 1248 1249 1250 1251 1252 1253 1254 1255 1256 1257 1258 1259 1260 1261 1262 Next
Comments 62701 to 62750:
-
Bob Lacatena at 10:19 AM on 27 February 20122nd law of thermodynamics contradicts greenhouse theory
Actually, I think every denier should be forced to read this thread, and then to look in a mirror, and recognize that to a lesser degree they are doing the same thing. It may be easier to argue their position, or to talk themselves into believing their position has substance, but in 99% of cases it comes down to the exact same thing. -
Doug Hutcheson at 10:03 AM on 27 February 2012Global Extinction: Gradual Doom as Bad as Abrupt
JP40 @ 37, I am sorry if you took the impression that I hate civilisation. That is too strong a view. Civilisation, with its opportunities for intellectual growth, has some wonderful aspects. What I regret, however, is the damage our advanced Western-style civilisation has done to the biosphere. Do you not find it depressing that we are candidly discussing the chances that humanity will cause the destruction of the very processes of nature that sustain it? The forces of destruction are largely fuelled by greed, which is arguably not a merit of civilisation. Technology allows us to exploit more of our resources and overpopulation places growing demand for that technology. Our growth is constrained by a limited quantity of exploitable resources as we only have one planet, but our economy collapses without perpetual growth. I have no problem with civilisation per se, but I do have a problem with our collective blindness. To quote from the original post:The world revealed by their research is a devastated landscape, barren of vegetation and scarred by erosion from showers of acid rain, huge "dead zones" in the oceans, and runaway greenhouse warming leading to sizzling temperatures.
Is this not similar to the dangerous climate we are heading for, unless we change our carbon trajectory? Is this not the by-product of our greed-based economy? Yes, the sun will destroy Earth in some billions of years, but humanity has the capacity to cause mass extinctions well before that time. What you call "self-destructive nihilism", I call pragmatism. To avoid the worst outcome, we have to change course quickly and drastically. Being a pragmatist, I don't believe the vested interests of humanity will change quickly enough, or drastically enough, to avoid very bad consequences. -
scaddenp at 09:33 AM on 27 February 20122nd law of thermodynamics contradicts greenhouse theory
Sadly, this thread is the happy hunting ground for the wilfully ignorant. It's wasting time trying to teach those who are determined not to let facts undermine their fantasies. -
JMurphy at 09:24 AM on 27 February 2012Climate change models underestimate future temperature variability; food security at risk
Living in London, I've been hearing and reading all about our drought over the last few weeks - supposedly the worst since 1976 (which was more down to a Summer heatwave), but seemingly we've had the driest two-year period in 90 years. Temperatures are also the highest in February over the last few days since 1998 - now, what was the global temperature that year ? No rain expected for the foreseeable future but, then again, Scotland seems to have had the 20% that we are down. However, we are still the lucky ones, even with all that, compared to those in places like Somalia mentioned in the article. -
Eric (skeptic) at 09:09 AM on 27 February 20122nd law of thermodynamics contradicts greenhouse theory
OK cover the Earth with a blanket (FULL CLOUD COVER) and see how cold it gets Venus? -
Stephen Baines at 08:47 AM on 27 February 20122nd law of thermodynamics contradicts greenhouse theory
DM Yes, I totally agree. Were the doubters to take measurements and do the actual science, they would find that the GHE is perfectly in line with thermodynamics. But they don't do the measurements and instead engage in endless obfuscation, which indicates that they are not actually serious about the issue. It is downright laughable that physicists would not 1) recognize that the 2nd law was contradicted and 2) would not do anything about it if they did. It's also downright depressing that this thread is going on 28 pages!!! -
logicman at 08:18 AM on 27 February 2012Climate change models underestimate future temperature variability; food security at risk
Here in the UK we are having a drought. The declaration of drought in winter is unprecedented. "The South East of England recently joined a long list of regions in drought. On Monday 20 February, the Environment Secretary announced that the South East of England has officially moved into drought status. This is due to the combination of persistent dry weather and the continuing decline in groundwater levels and river flows and increasing the risk to public water supplies, agriculture and the environment. As a result Hampshire, West Sussex, East Sussex, Kent, Surrey, London, Berkshire, Hertfordshire, Buckinghamshire, Oxfordshire, and the east of Gloucestershire are now in drought." UK Environment Agency Food prices likely to increase The Mayans - a lesson from history. -
Dikran Marsupial at 08:16 AM on 27 February 20122nd law of thermodynamics contradicts greenhouse theory
Stephen Baines The back radiation is less than the heat radiated from the surface, so the net flow of heat is from warmer to cooler, so it evidently does obey the second law of thermodynamics. I suspect that the problem is that the common definition of the second law that crops up pre-dates statistical mechanics and concept of a photon, in which case it is perhaps understandable that it doesn't specify the net flow of heat (implying that there may be an exchange of energy, but that it is biased in the direction from warmer to cooler). -
Tom Curtis at 07:53 AM on 27 February 2012Monckton Misrepresents Reality (Part 3)
owl905 @9: 1) The flat lining of surface OHC gain, accompanied by a more rapid warming of the deep ocean did not start suddenly in the 00's. It is a periodic occurrence that has happened in at least two major prior episodes, and two minor episodes in the last fifty years: Consequently your assumption that the situation is remarkable is unwarranted.
2) Below 500 meters, the temperature gradients in the ocean are very small, being in the range of just 1 or 2 degrees C over several hundred, or even thousands of meters. Consequently small changes of temperature in the deep ocean can significantly change the temperature profile and hence the rate of heat transfer to the deep ocean:
Consequently your assumption that the situation is remarkable is unwarranted.
2) Below 500 meters, the temperature gradients in the ocean are very small, being in the range of just 1 or 2 degrees C over several hundred, or even thousands of meters. Consequently small changes of temperature in the deep ocean can significantly change the temperature profile and hence the rate of heat transfer to the deep ocean:
 What is more, the effect can apply over very large areas so that a small change in the rate of heat transfer can add up to a lot of heat.
3) If you have an issue with this (and it certainly appears that you do), can I suggest that you discuss it on this thread where the issue is canvassed in depth, and where the relevant evidence is already presented.
What is more, the effect can apply over very large areas so that a small change in the rate of heat transfer can add up to a lot of heat.
3) If you have an issue with this (and it certainly appears that you do), can I suggest that you discuss it on this thread where the issue is canvassed in depth, and where the relevant evidence is already presented.
-
Stephen Baines at 07:25 AM on 27 February 20122nd law of thermodynamics contradicts greenhouse theory
I have to agree with Rob above. If there was some disagreement between the GH effect and the 2nd law, it would have been noticed by at least one of the thousands of scientists, all steeped in the Laws of Thermodynamics, who have studied some aspect of GHGs over the last 150 years. Instead of arguing about semantics and analogies, the doubters need to produce a reproducible experiment that can withstand peer review. The fact that haven't done so, despite the fact that it would yield a Nobel Prize, is telling. -
Stephen Baines at 07:03 AM on 27 February 20122nd law of thermodynamics contradicts greenhouse theory
Mods...Sorry about the triple posts...thread didn't update properly. Delete accordingly. -
Stephen Baines at 06:58 AM on 27 February 20122nd law of thermodynamics contradicts greenhouse theory
YOGI What is the point of bringing up clouds? The blanket analogy is meant to explain the effect of greenhouse gases on loss of heat from the earth's surface. Clouds require a different analogy entirely, one that also accounts for changes to albedo or incoming energy. As Phil notes, in this analogy the absorption of solar energy by the earth's surface is the equivalent of heat released by the human body as a result of metabolism. Both the earth and the human body are open systems thermodynamically, although they receive energy in different forms. From that point of view atmopsheric GHGs and blankets act similarly, both reducing loss of heat generated by absorption of solar energy or metabolism. The analogy does break down eventually if you take it far enough, as all analogies do. For example, the human body actively alters its metabolism to maintain a relatively constant core temperature, while the earth actually appears to amplify variations in solar radiation. That makes calculation of equilibrium surface temepratures different in each case. But the point of the analogy is not to represent energetics of the earth system, but simply to make the GH effect tangible by relating it to common experience. The blanket analogy succeeds on that front. -
Sceptical Wombat at 06:55 AM on 27 February 2012Monckton Misrepresents Reality (Part 3)
Tom Curtis @6 All your points are well taken. However one thing that stands out to me is that the triangle at the bottom left of the diagram is remarkably similar to the one at the top right. That is is looks as if warming was accelerating to about 1940 then took a dive before accelerating again in the 1950s. Any comments? -
william at 06:35 AM on 27 February 2012Radiative Balance, Feedback, and Runaway Warming
A positive feed back can also be limited by the cause running out. For instance, if all the methane of the Arctic permafrost rapidly enters the atmosphere due to the observed warming of high latitudes, this will cause a run away green house effect until it is all used up. Over a few decades, the methane will oxidize to Carbon dioxide which will reduce its effect. We could see some severe bounces in temperature which then decrease to a higher level than before the bounce. I wonder how many of us will be around following such a rapid change in our climate. -
Rob Honeycutt at 06:35 AM on 27 February 20122nd law of thermodynamics contradicts greenhouse theory
YOGI... This is the point where I usually suggest to "doubters" that they need to collect and publish their findings, if they can. To everyone else reading this, we accept the past 150+ years of research that makes up the basis for the greenhouse effect. This is established physics and is not in question by... well, by anyone really. You're incomplete understanding, and your desire to find some fault somewhere, is driving you into a circuitous pattern that has no end. If, somehow, someway, you managed to connect all your dots and come up with a theory that was complete it would literally mean re-writing the past 150 years of physics. You'll please excuse me if I suggest that the likelihood of this is extremely low, to the point of being a near impossibility. But if you want to try, knock yourself out. Outside of that you are clearly exhibiting a Dunning-Kruger effect and wasting everyone's time and energy. -
Rob Honeycutt at 06:23 AM on 27 February 20122nd law of thermodynamics contradicts greenhouse theory
Daniel @ 1346... Actually, I think that's officially called the "He who must not be named" thread. -
YOGI at 06:18 AM on 27 February 20122nd law of thermodynamics contradicts greenhouse theory
Phil#1347 We create our body heat internally from the calorific value of the food we eat. Excess heat may be lost through respiration or evaporation of perspiration, and body heat is continually lost in IR radiation from the body surface (when the surrounding air temperature is lower than the body temperature). Now as you know a blanket will reduce the IR emmission from your body in cold air by insulating it, and enable you to maintain your body temperature easier. -
YOGI at 06:06 AM on 27 February 20122nd law of thermodynamics contradicts greenhouse theory
Dikran Marsupial OK cover the Earth with a blanket (FULL CLOUD COVER) and see how cold it gets. I really did mean your blanket analogy was not safe, and if you want to continue pushing it, I have no problem with de-bunking it at every step. Solar IR makes up a significant proportion of insolation. Your thought experiment proves that beyond a single photon or so, the second thermo law must also apply between the Earth`s atmosphere and surface. -
Chris Colose at 06:02 AM on 27 February 2012Radiative Balance, Feedback, and Runaway Warming
David, Hansen's argument for why a runaway might occur is extremely unconvincing, nor do I really think he understands how a runaway greenhouse operates. The physics outlined in this post rules out a water vapor runaway because there simply isn't enough sunlight to sustain such a situation, as has also been outlined in a number of articles on the subject (see some older papers by James Kasting for example, or Selsis et al 2007, as well as Ray Pierrehumbert's new climate book). Clouds could, in principle, change that argument but if the Earth were relatively prone to a runaway greenhouse effect, it is very likely it would have occurred in many hothouse climates of the distant past, even with a slightly fainter sun during many of these intervals. Even CO2/CH4 feedbacks don't fundamentally alter that picture, because in the runaway limit the OLR is determined primarily by water vapor and clouds. That said, the fact that a runaway greenhouse couldn't occur is really a distraction from the point that climate sensitivity could be 3 or 4 C per doubling of CO2 (or even higher on longer timescales), and we are more than capable of tripling or quadrupling CO2 levels. -
David Lewis at 05:20 AM on 27 February 2012Radiative Balance, Feedback, and Runaway Warming
Regarding your statement: "it's worth mentioning that it is virtually impossible to trigger a true runaway greenhouse in the modern day by any practical means, at least in the sense that planetary scientists use the word to describe the loss of any liquid water on a planet" Hansen's discussed this issue in his December 2008 AGU Bjerknes Lecture. He also addressed this topic in Chapter 10 "The Venus Syndrome" in his book "Storms of My Grandchildren". He says he decided to bring the Venus Syndrome into the discussion because "it seems possible that strategic changes to fossil fuel use will not be adopted", i.e. civilization will burn every bit of fossil carbon that can be extracted from the Earth's crust. "So we had better examine what may happen if we push the planet beyond its tipping point". He says in the explanation in his book that Venus once had abundant water vapour in its atmosphere and "probably" had oceans. As the Sun brightened from its 30% less bright early solar system state, Venus heated up, "and the strong greenhouse effect of water vapor amplified the warming. Eventually a 'runaway' greenhouse effect occurred, with the ocean boiling or evaporating into the atmosphere". As the water vapor dissociated when it encountered UV at the top of the atmosphere, H escaped into space leaving O to combine with the C that had "baked out" of the crust until the atmosphere was 97% CO2 at a pressure of 90 bars. He says this theory is confirmed by the enrichment of heavy hydrogen, i.e. deuterium, on Venus today which is ten times more abundant there relative to normal hydrogen than on Earth or in the Sun. Ergo Venus was once wet. "So Venus had a runaway greenhouse effect". He displayed this graph in the Bjerknes Lecture as well as in his book: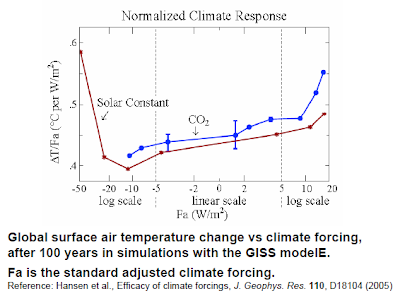 The graph, he says, "illustrates results of experiments with two different climate forcings: changing atmospheric carbon dioxide and changing brightness of the sun". "Qualitatively, this is the behavior that we know must occur: A sufficient negative forcing causes a runaway snowball Earth condition, with freezing temperatures over the entire planet, while a sufficient positive forcing causes a runaway greenhouse effect. We know that this U-shaped curve is correct - the question is, at what forcings do the sharp upturns to runaway conditions occur?"
He suggests "that the forcings needed to reach snowball Earth or runaway greenhouse conditions are no more than 10 to 20 W/m2 when solar irradiance or CO2 change are defined as the forcing".
After some discussion of the evolution of climate science, he says: "Now we are ready for the important part - trying to figure out how close we are to the climate forcing that will cause a runaway greenhouse effect. Until recently I did not worry too much about that", because much more CO2 had been in ancient atmospheres, "probably a few thousand parts per million", more than burning all the fossil fuels could produce.
"So we should be safe, right? Wrong, unfortunately".
250 million years ago the sun was 2% dimmer, which is an equivalent forcing change to a doubling of CO2. "So if the estimated amount of CO2 250 million years ago was 2,000 ppm, it would take only about 1,000 ppm of CO2 today to create a climate equally as warm".
But this is not the biggest factor, he says. Some estimates of early Cenozoic CO2 are as low as 1,000 ppm. He points to a Zeebe, Zachos, and Dickens 2009 paper which he quotes from: "Our results imply a fundamental gap in our understanding of the amplitude of global warming associated with large and abrupt climate perturbations". His estimate of Cenozoic CO2 depended on there not being this fundamental gap.
If Cenozoic climate sensitivity was greater than 3 degrees C for 2x CO2 it favors lower estimates for how much CO2 there was. "The PETM results would be easier to understand if the baseline CO2, prior to the PETM warming was closer to 500 ppm. But even so, the magnitude of the PETM warming implies a climate sensitivity greater than 3 degrees for doubled CO2". He notes: "if we burn all the fossil fuels, the forcing wil be at least comparable to that of the PETM, but it will have been introduced at least ten times faster. The time required for the ocean to respond to this forcing is only centuries. Thus, carbon cycle diminishing feedbacks will not significantly reduce the ocean warming. The warming ocean can be expected to affect methane hydrate stability at a rate that could exceed that in the PETM, where the rate of change was driven by the speed of the methane hydrate climate feedback, not by the nearly instantaneous introduction of all fossil fuel carbon".
"Carbon cycle diminishing feedbacks, which were important for keeping Earth away from runaway conditions during paleoclimate global warming events, are not likely to be as effective in drawing down atmospheric CO2 during the very rapid burning of fossil fuels by humanity".
"It is difficult to imagine how the methane hydrates could survive, once the ocean has had time to warm. In that event a PETM-like warming could be added on top of the fossil fuel warming. After the ice is gone, would Earth proceed to the Venus syndrome, a runaway greenhouse effect that would destroy all life on the planet, perhaps permanently? While that is difficult to say based on present information, I've come to conclude that if we burn all reserves of oil, gas and coal, there is a substantial chance we will initiate the runaway greenhouse. If we also burn the tar sands and tar shale, I believe the Venus syndrome is a dead certainty". Hansen said this was his opinion. His "model blows up before the oceans boil".
Schellnhuber, a leading figure at PIK, the Potsdam Institute for Climate Impact Research, at the 4 degrees and beyond conference held at Oxford UK September 2009 mentioned that PIK was thinking of fleshing out the Venus Syndrome concept by creating a model that doesn't blow up. He used these slides, i.e. 16, 17 and 18 during his audio presentation as he discussed "a number of exciting futures that are ahead of us, including a runaway greenhouse effect perhaps" which he cautioned we would not want to experience.
"Is there something like a runaway greenhouse effect?" he asked. "We don't think there is such a thing on this planet, it never happened in history, the other thing happened namely snowball Earth, a runaway glaciation, that actually happened twice probably, but we have not seen... a runaway greenhouse effect. But there can be something like a limited runaway greenhouse effect where you enter a temperature T1 and then the system by itself pushes temperature to another level, here, and this could be a jump in temperature over centuries of 5 degrees or something. We cannot exclude that yet".
He displayed this chart:
The graph, he says, "illustrates results of experiments with two different climate forcings: changing atmospheric carbon dioxide and changing brightness of the sun". "Qualitatively, this is the behavior that we know must occur: A sufficient negative forcing causes a runaway snowball Earth condition, with freezing temperatures over the entire planet, while a sufficient positive forcing causes a runaway greenhouse effect. We know that this U-shaped curve is correct - the question is, at what forcings do the sharp upturns to runaway conditions occur?"
He suggests "that the forcings needed to reach snowball Earth or runaway greenhouse conditions are no more than 10 to 20 W/m2 when solar irradiance or CO2 change are defined as the forcing".
After some discussion of the evolution of climate science, he says: "Now we are ready for the important part - trying to figure out how close we are to the climate forcing that will cause a runaway greenhouse effect. Until recently I did not worry too much about that", because much more CO2 had been in ancient atmospheres, "probably a few thousand parts per million", more than burning all the fossil fuels could produce.
"So we should be safe, right? Wrong, unfortunately".
250 million years ago the sun was 2% dimmer, which is an equivalent forcing change to a doubling of CO2. "So if the estimated amount of CO2 250 million years ago was 2,000 ppm, it would take only about 1,000 ppm of CO2 today to create a climate equally as warm".
But this is not the biggest factor, he says. Some estimates of early Cenozoic CO2 are as low as 1,000 ppm. He points to a Zeebe, Zachos, and Dickens 2009 paper which he quotes from: "Our results imply a fundamental gap in our understanding of the amplitude of global warming associated with large and abrupt climate perturbations". His estimate of Cenozoic CO2 depended on there not being this fundamental gap.
If Cenozoic climate sensitivity was greater than 3 degrees C for 2x CO2 it favors lower estimates for how much CO2 there was. "The PETM results would be easier to understand if the baseline CO2, prior to the PETM warming was closer to 500 ppm. But even so, the magnitude of the PETM warming implies a climate sensitivity greater than 3 degrees for doubled CO2". He notes: "if we burn all the fossil fuels, the forcing wil be at least comparable to that of the PETM, but it will have been introduced at least ten times faster. The time required for the ocean to respond to this forcing is only centuries. Thus, carbon cycle diminishing feedbacks will not significantly reduce the ocean warming. The warming ocean can be expected to affect methane hydrate stability at a rate that could exceed that in the PETM, where the rate of change was driven by the speed of the methane hydrate climate feedback, not by the nearly instantaneous introduction of all fossil fuel carbon".
"Carbon cycle diminishing feedbacks, which were important for keeping Earth away from runaway conditions during paleoclimate global warming events, are not likely to be as effective in drawing down atmospheric CO2 during the very rapid burning of fossil fuels by humanity".
"It is difficult to imagine how the methane hydrates could survive, once the ocean has had time to warm. In that event a PETM-like warming could be added on top of the fossil fuel warming. After the ice is gone, would Earth proceed to the Venus syndrome, a runaway greenhouse effect that would destroy all life on the planet, perhaps permanently? While that is difficult to say based on present information, I've come to conclude that if we burn all reserves of oil, gas and coal, there is a substantial chance we will initiate the runaway greenhouse. If we also burn the tar sands and tar shale, I believe the Venus syndrome is a dead certainty". Hansen said this was his opinion. His "model blows up before the oceans boil".
Schellnhuber, a leading figure at PIK, the Potsdam Institute for Climate Impact Research, at the 4 degrees and beyond conference held at Oxford UK September 2009 mentioned that PIK was thinking of fleshing out the Venus Syndrome concept by creating a model that doesn't blow up. He used these slides, i.e. 16, 17 and 18 during his audio presentation as he discussed "a number of exciting futures that are ahead of us, including a runaway greenhouse effect perhaps" which he cautioned we would not want to experience.
"Is there something like a runaway greenhouse effect?" he asked. "We don't think there is such a thing on this planet, it never happened in history, the other thing happened namely snowball Earth, a runaway glaciation, that actually happened twice probably, but we have not seen... a runaway greenhouse effect. But there can be something like a limited runaway greenhouse effect where you enter a temperature T1 and then the system by itself pushes temperature to another level, here, and this could be a jump in temperature over centuries of 5 degrees or something. We cannot exclude that yet".
He displayed this chart:
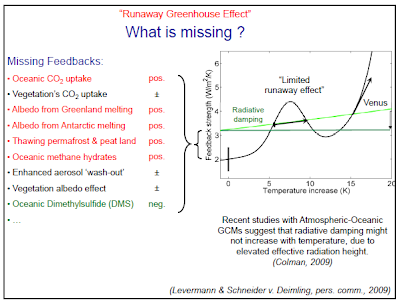 "You see most of the feedbacks are red.... But Venus?.... I don't think it will ever happen, but unfortunately we have never calculated this. It can't be done with state of the art GCMs of course. But we are thinking in Potsdam about doing first conceptual models about it.... Just to open up this field".
-
JP40 at 04:50 AM on 27 February 2012Global Extinction: Gradual Doom as Bad as Abrupt
This technology debate is ignoring totally renewable technology like wind and solar energy. There are also renewable ways to produce food, like airoponic indoor farms, which use a very small amount of water, and nutrients that can be made by bacteria cultures. Currently, these technologies are expensive and impractical, and probably won't be able to save our civilization, but to say that all technologies just increase how fast we use up the Earth's resources is the fallacy here. -
Chris Colose at 04:06 AM on 27 February 2012Radiative Balance, Feedback, and Runaway Warming
fixed, thanks -
muoncounter at 03:54 AM on 27 February 2012Satellites find over 500 billion tons of land ice melting worldwide every year, headlines focus on Himalayas
mspelto#39: "At this point the detailed inventories are better validated." Are you saying that GRACE is under-reporting ice mass loss in these areas? -
mspelto at 03:45 AM on 27 February 2012Satellites find over 500 billion tons of land ice melting worldwide every year, headlines focus on Himalayas
In the high mountains of Central Asia detailed glacier mapping inventories, such as from (GLIMS: Global Land Ice Measurements from Space) using ASTER, Corona, Landsat and SPOT imagery, of thousands of glaciers have indicated increased strong thinning and area loss since 2000 throughout the region except the Karokoram. Links to below papers. In the Russian Altai mapping of 126 glaciers indicate a 19.7 % reduction in glacier area 1952-2004, with a sharp increase after 1997 (Shahgedanova et al., 2010). In Garhwal Himalaya, India, of 58 glaciers examined from 1990-2006 area loss was 6% (Bhambri et al, 2011). In the Nepal Himalaya area loss from 1963-2009 is nearly 20%, (Bajracharya et al., 2011), volume losses increased from an average of 320 mm/a 1962-2002 to 790 mm/a from 2002-2007 in the Khumbu region, including area losses at the highest elevation on the glaciers (Bolch et al., 2011). In the Tien Shan Range over 1700 glaciers were examined from 1970-2000 glacier area decreased by 13%, from 2000-2007 glacier area shrank by 4% (Narama et al, 2010). An inventory of 308 glaciers in the Nam Co Basin, Tibet, noted an increased loss of area for the 2001-2009 period, 6% area loss (Bolch et al., 2010). GRACE estimated Himalayan glacier losses at 10% of that found in the aforementioned examples for volume loss for the 2003-2010 period the (Jacobs et al, 2012). At this point the detailed inventories are better validated. -
Phil at 03:42 AM on 27 February 20122nd law of thermodynamics contradicts greenhouse theory
With regard to the Blanket analogy, it is worth pointing out that the heat humans (and other organisms) produce is derived from the respiration of foodstuffs, and so is not an internal source of energy and typically pass through a blanket unimpeded (unless you happen to have it over your head :-) ). Incoming Solar radiation is thus analogous to food in the Blanket analogy. -
Bruce A. at 03:39 AM on 27 February 2012Radiative Balance, Feedback, and Runaway Warming
Thanks for an informative and well written article. It is helping me clarify my understanding and thinking about this issue, and will likely be more helpful when I reread it. Is there an editing oversight in the caption for Figure 4, where the caption says "blue circles," while the figure shows and text states "blue squares?" -
Daniel Bailey at 02:12 AM on 27 February 20122nd law of thermodynamics contradicts greenhouse theory
There's always the Poptech thread...the Valhalla of mythic D-K. -
Bob Lacatena at 01:43 AM on 27 February 20122nd law of thermodynamics contradicts greenhouse theory
1343, Rob, No, this is the Galileo thread. The Dunning-Kruger thread overloaded and exploded. -
JP40 at 01:33 AM on 27 February 2012Global Extinction: Gradual Doom as Bad as Abrupt
Doug H - if you hate civilization so much, then maybe you should go to the African rift valley and chop off your thumbs. You would live a very short, hard, and hungry life in your "garden of eden." If you want to get philosophical, in 5 billion years the sun will become a red giant, and if there isn't an intelligent, spacefaring civilization around, life, the most amazing thing in the universe, could be destroyed forever. You seem to be saying that we all need to be punished for what we are currently doing to the planet. The important thing is that we learn from our mistakes and don't make them again. It makes me very sad that self-distructive nihilisim like this exists. -
Bob Lacatena at 00:08 AM on 27 February 2012Satellites find over 500 billion tons of land ice melting worldwide every year, headlines focus on Himalayas
18, owl905, My calculations were simply a "for instance" intended to give some measure of contrast to what the energy that melts 500 Gt of ice is capable of doing. Obviously this would be spread through the entire system (ocean/atmosphere) and eventually deeply into the ocean... although all of that would take time, and because of the high specific heat of water compared to air, the ocean is what really matters. The point isn't to demonstrate how much warming would have been caused if the ice hadn't been available to melt, but rather simply that 500 Gt of ice translates into a huge amount of energy. -
Dikran Marsupial at 00:01 AM on 27 February 20122nd law of thermodynamics contradicts greenhouse theory
YOGI wrote: "Unlike the Earth I am internally heated so the [blanket] analogy is not safe" which clearly shows that YOGI has not the slightest familiarity with how the greenhouse effect works, which is not a good position from which to be questioning it. The atmosphere is largely transparent to visible and UV light, which makes up the majority of the Sun's radiation. Thus most of the Suns radiation is absorbed by the surface, which heats up as a result, and re-radiates this energy as IR radiation. Thus as far as the atmosphere is concerned, it is being heated from below by the surface, which is why the blanket analogy is perfectly reasonable, provided it is not extended beyond this most basic point. Now anybody who has made the slightest effort to understand the way in which the greenhouse effect works will know that already. Sadly the WWW is full of Dunning-Kruger sufferers who think that a few things they have read on climate blogs means they know more than scientists who work on this for a living. Generally all they manage is to make themselves look silly, as YOGI has done on this thread (he/she is not the first and I suspect will not be the last). The basic idea of the greenhouse effect goes back to the 1820s at the very least, so it would be extremely unusual for a physical theory to have survived this long if it contradicted a fundamental law of thermodynamics! Of course it doesn't. The error is to assume that the second law says that heat cannot flow from a cooler body to a warmer one. It doesn't, essentially the net flow of heat must be from the warmer body to the cooler one, and even then it is only true in a statistical sense after the exchange of a sufficiently large number of IR photons. To see this is true, consider a thought experiment, where there are two identical bodies, separated by a small gap, both of which are only slightly above absolute zero. One is warm enough to emit photons of IR at random at an average rate of one per year (365 days). The other is a little cooler, so that it radiates a photon at an average rate of one per 366 days. If you observed them for a month, then assuming one photon was emitted by one body and absorbed by the other in that month, it is almost as likely to have gone from the cooler body to the warmer body, thus making the warmer body a little warmer. However this is not in contradiction of the second law of thermodynamics. If you observe the bodies for long enough, you will find that slightly more IR photons from the warmer body are absorbed by the cooler body than vice versa, and hence the net flow of heat is from warmer to cooler. Anyway, I hope my exchange with YOGI has demonstrated that he/she is not here for rational discussion of the science, and is not worth the effort. DNFTT. -
MarkR at 19:49 PM on 26 February 2012Satellites find over 500 billion tons of land ice melting worldwide every year, headlines focus on Himalayas
From Peru: So we know that he total heat budget should be pretty closely tied to the total radiative balance. 2004-2011 saw an exceptionally low level of solar activity, knocking around a tenth of a W m-2 off the heating rate. That explains some of it. Other recent work showing an increase in aerosol optical depth thanks to China and decreasing statospheric water vapour would also reduce the heating. Cyclical or random 'weather' factors could also be involved. Accounting for this in the way that The aerosol optical depth effect won't stay forever. I suspect it won't continue to grow for that much longer. The drying of the stratosphere is a weird one. It has to continue to dry to carry on cancelling out the growing greenhouse heating, and I've no idea what'll happen to that! -
Rob Painting at 19:44 PM on 26 February 2012Satellites find over 500 billion tons of land ice melting worldwide every year, headlines focus on Himalayas
From Peru - Go to the thread suggested by Tom Curtis & we'll discuss it there. I understand why you are confused, but you are making some assumptions that are simply not valid. -
Glenn Tamblyn at 18:39 PM on 26 February 2012Global Extinction: Gradual Doom as Bad as Abrupt
Owl9005 @30 "You fall on your facia with the Punjab as an example that isn't about technology - while you acknowledge all the technology used to make it succeed." Key point about you comment - you are speaking in the past tense. The question isn't whether something has 'succeeded'! It is whether that success is or can be enduring. Yes Owl, the technology allowed it to succeed. For now. By being so good at consuming a resource - groundwater - that for a time the good times rolled. And still are at present. But the water tables keep on dropping. And they can't do that forever. What happens when the technology of pumps runs up against the lack of resources availabe to be pumped? This is the fallacy of always assuming that technology will provide long term answers rather than just stop-gaps for a few decades. Technology is neutral. We can use it to solve problems or compound them. Technology doesn't solve problems, sensible thinking does. Technology is simply the 'force multiplier' for other judgements. -
owl905 at 18:22 PM on 26 February 2012Monckton Misrepresents Reality (Part 3)
@Tom 7, thanks for the reply, but it doesn't register here. The heat sink capacity of the deep oceans is too large to suggest it's a temporary exception. 'Warming the deep oceans will make it harder for heat to flow' ... then it shouldn't have started in the 00's after almost two centuries of rising temperatures. And suggesting that one or two degrees in deep currents or the Thermo conveyor creates resistance ... another non-starter here. It doesn't end. This theory of the 'temporary deep ocean sink' still looks very fundamentally flawed. If something new, or different, or an oscillation, provides transport to the deep ocean - there's nothing obvious that's going to drive it back to the surface. -
Tom Curtis at 18:10 PM on 26 February 2012Satellites find over 500 billion tons of land ice melting worldwide every year, headlines focus on Himalayas
From Peru @33: I) The atmosphere and land surface have not been warming more steadily than the ocean. It is just that because most heat goes into the ocean, fluctuations in the land/atmosphere/cryosphere heat content are difficult to see on the chart. III) Again, the deep ocean has also experience fluctuations in heat gain, more or less coincident and opposite in direction to those of the surface ocean. Having said that, there is a far more detailed discussion of just this issue here. I recommend you read it, and then post any further comments on that thread. -
Glenn Tamblyn at 18:08 PM on 26 February 2012Uncertainty Is Not the Basis for Investment
Pete @61. Agreed. The real world is more complex that my example. My point is that their is an underlying driver for water vapour increase that does not depend on increased evaporation. -
Glenn Tamblyn at 17:59 PM on 26 February 2012Satellites find over 500 billion tons of land ice melting worldwide every year, headlines focus on Himalayas
A different way of looking at sphaerica's calcs. Total heat from melting ice is 1.665 x 10^20 J Mass of the atmosphere is around 5 x 10^21 grams. Specific heat of Air as about 1 j/gK So the heat of ice melt is the equivalent of a uniform rise in Air temps of 1.665 x 10^20/5 x 10^21 which equals 0.0333 K/year or 0.333 K/decade. And we are seeing air temperature rises of the order of 0.15 K/decade. That seems to say that ice melt is consuming twice as much heat as atmospheric warming. Or if ice wasn't melting, the atmosphere might be warming 3 times as fast. So what happens when we run out of ice? -
From Peru at 17:39 PM on 26 February 2012Satellites find over 500 billion tons of land ice melting worldwide every year, headlines focus on Himalayas
Tom Curtis: I am just trying to find the solution to the apparent contradictory findings that: 1)sea level rise has slowed slightly while the ice sheets in Antartica, Greenland and most of the land glaciers are suffering accelerating melting due to surface warming. 2)To explain 1, thermosteric sea level rise must had slowed down (i.e. the oceans are warming more slowly since 2004), while surface and atmospheric temperatures have continued to warm without slowing (the rate of warming has been nearly constant, as Foster and Rahmstorf found). 3)In effect, temperature mesurements of the deep sea have shown us that ocean warming has continued, but at a slower rate. The contradiction with the surface record was partly reduced when the 0-2000 meter deep ocean heat content data was published, (not long ago only the 0-700 m Ocean heat content(OHC) was avaivable, and it showed almost no warming since 2004) but still show significantly less warming in the last decade than in the previous decade. How can happen that: I)The atmosphere and land surface are warming steadily II)The 700 upper meters of the sea are warming a lot more slowly since 2004 than in the few decades before III) The deep ocean is warming steadily What is happening in the shallow ocean? -
Tom Curtis at 16:33 PM on 26 February 2012Satellites find over 500 billion tons of land ice melting worldwide every year, headlines focus on Himalayas
From Peru @31, the chart you show shows a trend of increasing Earth Total Heat Content of approximately 6.4 x10^21 Joules per annum. That is the equivalent of a 1.1 W/m^2 energy imbalance globally averaged. The question is, does the currently reduced energy imbalance indicate the imbalance will be reduced into the future, ie, is global warming slowed down? Well, as it happens the plateau in ETHC around 1974/75 associated with one of the largest La Nina's on record did not indicate that. Neither did the plateau around 1984 associated with the El Chichon volcanic eruption and one of the largest El Nino's on record. Nor did the plateau in the early 1990's associated with the Pinatubo eruption. Nor did the decline in ETHC in the late 1990s associated with the other of the two largest El Nino's on record. Despite this, you now want to tell me the reduction in gain in ETHC around 2008/9 represents a slow down of global warming, even though it is associated with the deepest solar minimum since 1910 and a strong La Nina? Are you really going to conclude that a Foster and Rahmstorf style analysis of ETHC must fail simply on the basis that it has not been done yet, and that it succeeded when applied to temperatures? -
Sceptical Wombat at 16:29 PM on 26 February 2012Monckton Misrepresents Reality (Part 3)
Tom Curtis @ 6 Thanks -
From Peru at 15:54 PM on 26 February 2012Satellites find over 500 billion tons of land ice melting worldwide every year, headlines focus on Himalayas
Tom Curtis: You said: "you need to determine what the change of temperature would have been without the effect of known short term influences such as ENSO, and the solar cycle.Foster and Rahmstorf have done exactly that and shown no reduction in the global warming trend" I believed exactly that just an hour before, but after seeing the 0-2000 meters ocean heat content/thermosteric sea level timeseries with more attention(as your previous comment suggested me to do) I realized that I was wrong. The nearly constant warming that Foster and Rahmstorf found covers just the Earth surface and the atmosphere. However 90% of the warming occurrs in the oceans... and there the 1992-2003 warming was bigger than the 2004-2011 one. That explains the non-acceleration of sea level rise despite the ongoing accelerating meltdown.
You told me that in the previous comment...why you are now telling that global warming has not slowed down?
and there the 1992-2003 warming was bigger than the 2004-2011 one. That explains the non-acceleration of sea level rise despite the ongoing accelerating meltdown.
You told me that in the previous comment...why you are now telling that global warming has not slowed down?
-
Rob Honeycutt at 15:51 PM on 26 February 20122nd law of thermodynamics contradicts greenhouse theory
Ahem... Um, is this the Dunning-Kruger thread? -
climateadj at 15:11 PM on 26 February 2012Tropical Thermostats and Global Warming
My speculative hypothesis for the "Tropical Thermostat" is an anti-phased relationship between solar insolation and ocean upwelling. That is, the hotter the sun, the stronger the upwelling of cool water. At some point the rate of warming from the sun is matched by the rate of cooling from upwelling and a temperature plateau is reached. This mechanism could concievably act as a natural temperature governor across the tropics. The rate of ocean upwelling could be correlated with annual variations in a number of related phenomena, such as deep convection, trade winds, or the migation of the ITCZ. This might be relatively easy to test. For instance, a cross-correlation analysis of ARGO and solar insolation data would determine if the signals are anti-phased. That being said, I still wouldn't bet that tommorrow's tempeature plateau would be the same as today's. I imagine that the rise in the DC signal has a corresponding impact on the AC signal. -
Tom Curtis at 14:16 PM on 26 February 2012Satellites find over 500 billion tons of land ice melting worldwide every year, headlines focus on Himalayas
From Peru @28, "Global warming" refers to the background trend, not to annual fluctuations. Therefore, while the rate of increase of temperatures has slowed down, but there is no evidence that the pace of global warming has slowed. To determine whether or not Global Warming has slowed down, you need to determine what the change of temperature would have been without the effect of known short term influences such as ENSO, and the solar cycle. Foster and Rahmstorf have done exactly that and shown no reduction in the global warming trend. Therefore, in the near future when we are at a solar maximum and have an El Nino we can expect global temperature records to be smashed again. After that, of course, we can expect so-called climate skeptics to write endless blogs about how there has been no warming since 2013 or 2014. -
Rob Painting at 14:06 PM on 26 February 2012Satellites find over 500 billion tons of land ice melting worldwide every year, headlines focus on Himalayas
From Peru - "The slowdown in global warming during the last decade was real and not an ENSO + Solar driven (because of the big La Niñas + reduced solar activity in recent years) artifact? I hope you realize that none of those are mutually exclusive. We've been down this road with comments before. Some readers, for whatever reason, seem to want to pin this on one factor alone, when in fact it may be due to multiple factors. The trend toward more intense and dominant La Nina at the end of the 'noughties' has clearly affected global surface temperatures, but so too has the solar cycle, and maybe those Asian aerosols (reflective particles of pollution). The slower rate of ocean heat uptake is partially a result of the downward trend in the solar cycle through the 'noughties'. Not only did it (solar output) reach the lowest solar sunspot cycle in a century, but it also lasted 2 years longer than normal. But the solar cycle trend is now upwards, and due to the 18 month-24 month thermal lag of the oceans, we will soon see this manifest itself in global surface temperatures. See SkS posts: NASA scientists expect more rapid global warming in the very near future Personally I find it a little troubling that all these factors lined up to cool the Earth, and yet it keeps absorbing more heat. That heat will make soon make itself felt in the next El Nino. It's lurking down there below the 100 metre layer of the surface ocean ready to pounce!

-
Tom Curtis at 13:56 PM on 26 February 2012Monckton Misrepresents Reality (Part 3)
Owl905 @5, while I agree saying that the heat in the deep ocean will return to the surface in the near future is slightly inaccurate, never-the-less the heat in the deep ocean will contribute to future warming. That is because warming the deep oceans makes it harder for heat to flow to the deep oceans, so that in the near future we can expect a greater proportion of the warming from enhanced greenhouse gas concentrations and feedbacks to be retained at the surface. The effect of that will be a more rapid temperature rise. Consequently, while the language may not have been precise,the point being made was entirely accurate. -
Tom Curtis at 13:51 PM on 26 February 2012Monckton Misrepresents Reality (Part 3)
Sceptical Wombat @3, you raise an interesting point. As it happens, in his St Pauls address, Monckton accused the IPCC of "... a statistical lie known as the start point or end point fallacy" based on the same graph. That is, of course, a very different argument to that which he made in response to Dana, and which is discussed above. But while Monckton's purported reasons change, his conclusion (that the IPCC lied) never does. His argument against the IPCC in St Paul was, of course, entirely invalid. The start point fallacy is committed when just a small change in start point makes a large change in the determined trend. The way you avoid the start point or end point fallacy is you ensure that all trends shown are statistically significant. As the shortest trend shown by the IPCC is 25 years, all the trends they show are statistically significant. Therefore they did not commit the start point fallacy. It really is that simple, but you don't need to know statistics or check statistical significance to see that Monckton was entirely misrepresenting the facts of the matter. Nick Stokes has developed a trend viewer, which is available at his blog, Moyhu. The viewer shows all trends in the given data set, from any start date to any end date. To read it, you pick a start year on the Y axis, then scan across till you come to the end date that you want, on the X axis (or vise versa). The colour of the relevant point on the graph will then show you the trend. Care does need to be taken because of Nick's unusual colour scheme. Specifically, he uses the yellower shades of green to indicate small positive trends, and bluer shades of green to indicate small negative trends. When looking at shades of green, therefore, look for the grey zone indicating near zero trend to make sure you know the sign of the trend in that area. Just to confuse things further, he also uses grey between to shades of orange to indicate a strong positive trend, so those regions of grey are not to be confused with the grey sections found in green areas and indicating near zero trends. With that warning in mind, here is the HadCRUT3 plot with the end year 2005 (approximately) marked out clearly by a black border: First, you will notice that for every trend with start year prior to 1987 that ends in 2005, the trend is positive.
Second, you will notice that for every trend with a start year prior to 1987 that ends in 2005, the general pattern is that the more recent the start year, the stronger the trend.
Third, you will notice that the same is true for all end years between 1995 and 2012, provided that you only consider trends at least 20 years in length.
The reason for the twenty year limit is only to ensure statistical significance. However, with that limit you can see that the general pattern is robust with respect to start points and end points. That is, there is no start point (or end point) fallacy involved.
I should further not that I have only used HadCRUT3 to enable direct comparison with the IPCC Graph. HadCRUT3 is less accurate than either the NCDC or GISTEMP temperature indices, and indeed is soon to be supplanted by HadCRUT4. All of NCDC, GISTEMP and HadCRUT4 show this pattern even more strongly than does HadCRUT3.
First, you will notice that for every trend with start year prior to 1987 that ends in 2005, the trend is positive.
Second, you will notice that for every trend with a start year prior to 1987 that ends in 2005, the general pattern is that the more recent the start year, the stronger the trend.
Third, you will notice that the same is true for all end years between 1995 and 2012, provided that you only consider trends at least 20 years in length.
The reason for the twenty year limit is only to ensure statistical significance. However, with that limit you can see that the general pattern is robust with respect to start points and end points. That is, there is no start point (or end point) fallacy involved.
I should further not that I have only used HadCRUT3 to enable direct comparison with the IPCC Graph. HadCRUT3 is less accurate than either the NCDC or GISTEMP temperature indices, and indeed is soon to be supplanted by HadCRUT4. All of NCDC, GISTEMP and HadCRUT4 show this pattern even more strongly than does HadCRUT3.
-
Chris Colose at 13:46 PM on 26 February 2012Radiative Balance, Feedback, and Runaway Warming
Tom Actually Charlie is correct here. Climate scientists usually don't define the Stefan-Boltzmann response as a feedback whatsoever, but rather as the baseline relative to how other feedbacks are referenced. Take the following image for example (from Roe, 2009): Here the y-axis is the feedback factor,f, typically associated with the equation 1/1-f. Climate sensitivity is proportional to 1/1-f. More specifically it is *equal to* CS=b/1-f where b is the response you'd get in a system that only had the Stefan-Boltzmann response operating. Thus, in the limit where we have no feedbacks, f=0 and the equation reduces to CS=b. That is, you'd get the response from just the Stefan-Boltzmann response.
In the above graph, the "all" feedback factor is positive, f=0.6 or so. This means that CS = b/0.4 = 2.5b (i.e., climate sensitivity is inflated by a factor of 2.5). Note however that the Stefan-Boltzmann response is not included in the graph.
Here the y-axis is the feedback factor,f, typically associated with the equation 1/1-f. Climate sensitivity is proportional to 1/1-f. More specifically it is *equal to* CS=b/1-f where b is the response you'd get in a system that only had the Stefan-Boltzmann response operating. Thus, in the limit where we have no feedbacks, f=0 and the equation reduces to CS=b. That is, you'd get the response from just the Stefan-Boltzmann response.
In the above graph, the "all" feedback factor is positive, f=0.6 or so. This means that CS = b/0.4 = 2.5b (i.e., climate sensitivity is inflated by a factor of 2.5). Note however that the Stefan-Boltzmann response is not included in the graph.
-
Search For 'Missing Heat' Confirms More Global Warming 'In The Pipeline'
neil - Even if CO2 emission halted tomorrow, and aerosols were not a factor (pretty big "ifs", mind you), there would still be some warming in the pipeline. Currently the oceans are absorbing ~40% of our emissions, call it 2ppm/yr. The climate is still catching up to emissions from decades ago. Until the oceanic drawdown zeros out TOA imbalances, we will continue to increase the energy in the climate. That means increases in surface temperatures as well as oceanic. Only when that imbalance is canceled will we see a halt in temperature increases - the two processes have quite a distance before they meet.
Prev 1247 1248 1249 1250 1251 1252 1253 1254 1255 1256 1257 1258 1259 1260 1261 1262 Next


