


 Arguments


Recent Comments
Prev 1249 1250 1251 1252 1253 1254 1255 1256 1257 1258 1259 1260 1261 1262 1263 1264 Next
Comments 62801 to 62850:
-
YOGI at 07:03 AM on 26 February 20122nd law of thermodynamics contradicts greenhouse theory
#1322 ok there may an exchange but it cant get cool off in the direction of the warmer body, as the warmer body is warming it faster than it can cool off. -
Dikran Marsupial at 06:58 AM on 26 February 20122nd law of thermodynamics contradicts greenhouse theory
YOGI wrote "It will want to radiate it towards somewhere colder." O.K. so when a molecule of water vapour in the atmosphere emits a photon of IR, how does it know not to emit it in the direction of a warmer body? -
YOGI at 06:56 AM on 26 February 20122nd law of thermodynamics contradicts greenhouse theory
Dikran Marsupial "O.K. so the water vapour absorbs the IR radiated from the ground and then warms up. What happens to the heat energy that the water vapour has acquired in this way?" It will want to radiate it towards somewhere colder. But while it is warmer, it will mean the ground will lose heat slower, remember my cup of tea ? ~ insulation. "insulators do not work by reducing the rate at which something radiates photons of IR" Paint your roof white and it will do exactly that. -
Dikran Marsupial at 06:50 AM on 26 February 20122nd law of thermodynamics contradicts greenhouse theory
IanC can I suggest we leave YOGIs greenhouse until we get to the conclusion of the discussion of why the desert cools rapidly at night. We won't make any progress in this discussion if it keeps branching out onto new thought experiments before the earlier ones have been resolved. -
JoeTheScientist at 06:48 AM on 26 February 2012Monckton Misrepresents Reality (Part 3)
Can't we start arresting some of these frauds for, well, fraud?? -
neil at 06:48 AM on 26 February 2012Search For 'Missing Heat' Confirms More Global Warming 'In The Pipeline'
Ok, I'm going to try one more time, then I'm out. Like I've said, you have a point about aerosols, but you are wrong on carbon-induced warming. I think I can identify the source of confusion. There is a difference between "past emissions" and a "constant composition atmosphere". The fully-coupled models used for IPCC AR4 were only 'physical' models. They did not contain carbon-cycles, so carbon could not be advected around or exchanged between natural reservoirs. Instead, atmospheric CO2 concentrations are specified in this class of models. Common scenario's included an instant doubling of CO2, or a 1% increase in CO2 per year. Ok, now lets consider what happening is these model results, which we are familiar with. In the scenario where CO2 is increased, and lets say set to 450 ppm - the surface temperature takes hundreds, or thousands of years to come into equilibrium (this here is your "warming in the pipeline"). Even if CO2 is increased slowly at say 1% per year, rather than instantly, it takes hundreds of years for equilibrium to be reached (because of the slow-adjustment of the ocean some people here have talked about). However, the key to realize is that in order to maintain an atmospheric CO2 of 450 ppm, you need a constant source of emissions. If there were no emissions, the ocean would take up carbon, and the atmospheric CO2 would drop below 450 ppm. However the AR4 models could not diagnose what emissions were consistent with keeping CO2 at 450 ppm, since they did not contain carbon cycles. The set of intermediate complexity earth system models (such as UVic, Bern, Climber) do contain carbon cycles, and could diagnose the emissions consistent with keeping CO2 at 450 ppm. Also, the new generation of fully coupled models being used currently in CMIP5 / AR5 are earth system models (or carbon-climate models), that are capable of tracking carbon through the system. So, for a constant composition atmosphere, surface temperatures take hundreds of year to come into equilibrium (but, keeping CO2 constant also requires some ongoing emissions). For zero emissions, (or the commitment to past emissions), there is no future warming, as explained previously. @Rob 45 That makes no sense at all. How can the ocean warm without eventually exchanging that heat to the atmosphere? Don't get confused between heat and temperature!! The ocean can absorb a massive amount of heat, but the average temperature of the ocean (and particulalrly the deep ocean) will remain below the temperature of the surface! Thus the direction of the heat flux remains downward! -
YOGI at 06:47 AM on 26 February 20122nd law of thermodynamics contradicts greenhouse theory
IanC#1318 So from the IR intensity Earth looks a lot colder from 20km up than it really is on the surface. Did you like my greenhouse in #1307 ? -
scaddenp at 06:46 AM on 26 February 2012Medieval Warm Period was warmer
Chris, in what way do you think Cook & Palmer challenges consensus? (I mean its used in the Mann/Jones 2003,2004 papers). Also did you follow up and look at their 2006 paper. Of course, MCA/MWP is example of natural variability. But not of unforced variability. Instead of cherry picking particular proxies, tell what is wrong with the methodology of the Mann 2009 paper which integrates them all for a global picture. -
Chris Colose at 06:33 AM on 26 February 2012Radiative Balance, Feedback, and Runaway Warming
sauerj- I wouldn't have thought that the article was that exciting, but glad I could help! I didn't show graphs with different CO2 concentrations because you'd barely see the difference between what I did, and say, an 800 ppm experiment. Keep in mind that the forcing for 2xCO2 is something like 4 W/m2 and I'm plotting the y-axis on these graphs over a range of many hundreds of W/m2, so it won't show up well unless you go to CO2 levels much higher than we're really worried about for future global warming. And it turns out that the OLR threshold at which it start to level off and become independent of temperature doesn't depend too strongly on the CO2 concentration. -
IanC at 06:27 AM on 26 February 20122nd law of thermodynamics contradicts greenhouse theory
YOGI 1302, Our discussion up to post 1290 is related to the figures in the article. If you read the caption that came with the figure, you'll notice that 265K, instead of 287K, will be the more sensible surface temperature. "The closer you get to the surface the less absorption there is from the 600-750 band, and the majority of the effect is above 3km." No. Absorption increases with density. Since the density is the greatest near the surface, the absorption is the greatest there too. -
Dikran Marsupial at 06:24 AM on 26 February 20122nd law of thermodynamics contradicts greenhouse theory
YOGI O.K. so the water vapour absorbs the IR radiated from the ground and then warms up. What happens to the heat energy that the water vapour has acquired in this way? n.b. insulators do not work by reducing the rate at which something radiates photons of IR (that depends on its temperature) -
YOGI at 06:19 AM on 26 February 20122nd law of thermodynamics contradicts greenhouse theory
If I take my cup of tea out in the cold night air it will cool quicker. Same for the ground, but if there is more water vapour above it will absorb IR from the ground, warm up, and reduce the rate at which the ground can then radiate. -
WheelsOC at 06:15 AM on 26 February 2012Radiative Balance, Feedback, and Runaway Warming
I'll add my voice to the chorus on clarity! On a side note, isn't it interesting to see how Monckton thinks the positive feedbacks play into this? According to his wording, the IPCC imagines them. Pretty sure that these actually originate from physicists and other earth scientists who study the atmosphere, write the literature on it, and that literature is then eventually summarized by the IPCC. Even the models they use in the report are set up and run by scientists for their own purposes, not for making IPCC reports. It betrays some of the mindset that it takes to shrug off such a strong, facts-based, scientific consensus: "This must not be coming from the majority of working scientists trying to make sense of the planet, it must be coming from the United Nations' political machinery and their need to support the Big Government Wealth Redistribution Agenda!" or something along those lines. -
sauerj at 05:55 AM on 26 February 2012Radiative Balance, Feedback, and Runaway Warming
Chris Colose, Well done! ... I am a chemical engineer. It is beaten into our heads to relate things with graphs as doing so shows relationships so well. As of yet, I've never seen anyone explain 'sensitivity' so well as you have done. Sensitivity is simply the 'gain' or 'multiplier' that relates a change in an independent variable (i.e. forcing, such as CO2) to a change in the dependent variable (temp). In formula form: dT = Sensitivity x dCO2. Essentially, S is the SLOPE on a graph. (For a graph formatted with Temp on the x- axis as in the article, Sensitivity would actually be '1/slope'.) And, WOW!, your article shows this visually so well! It clearly shows how a more horizontal sloped curve (for Flux vs Temp formatted graphs) versus a more vertically sloped curve result in HIGHER sensitivities. This is the kind of technical (but yet simple) explanation that will turn the heads of the more technically astute minds out there (assuming they are the least bit open-minded)! This is the kind of stuff that might get them to say, "Oh! Now I get it!" Like, @4 chriskoz and @7 Pirate mentioned, I would propose a PART-2 follow-up article which I think would knock this whole thing over the fence. Then, I would feel fully ready to explain the science of global warming amply loaded with the needed ammunition that could NOT be refuted. I can only wonder if such an addendum would also be universally helpful. Here is the suggestion: After Fig.3, I would take the article on a slightly different course. For the next graph, I would show two RED curves; one for 250ppm (pre-industrial) and another for 500ppm (give a hypothetical year, 2065). Why 250 & 500 curves? These CO2 values work well with the typical scientific talk of doubling CO2 and how such a doubling impacts temperature. Plus it shows realistic resulting temperatures for a starting point (pre-ind) CO2 and not-so-far-away (2065) CO2. ... Leave the horizontal line at 240 W/m2 (at this point in the article assume albedo differences and solar cycle variances are still neutral). With these two CO2-only RED curves, I would expect the difference in equilibrium temp to be ~1.0 - 1.2K, which I have read on this site as the expected dTemp for doubling of CO2 with NO other feedbacks mixed in. Then, on this same graph, add two BLUE curves representing the average Relative Humidity earth conditions, one at 250ppm CO2 and the other at 500ppm CO2. I assume the '500ppm w/RH' curve will simply be shifted down below the '250ppm w/RH' curve (you would know the exact particulars on this better than I). If you look at the present Fig.3, I see how, at 200K, the RED curve is shifted vertically down below the BLACK curve, and the BLUE curve (at this 200K) also "starts" at this same point (at this trace humidity state). For the 250ppm & 500ppm RED & BLUE curves, they will simply start (at the 200K temp) at two different vertical shifts down from the BLACK curve, with the 500ppm curve simply being 'LOWER' than the 250ppm curve (probably by the same porportional vertical distance). Then, when these curves move to the right from this starting point (200K), they will cross the 240W/m2 horizontal line at their various equilibrium temperatures. [Slight diversion: WOW, your article is so COOL how it visually explains these changes in the equilibrium point. With your clear graphs, any technically oriented person would instantly understand & get your point and realize its significance in a heartbeat!] Since the two BLUE curves are so much flatter (i.e. or lower angle, or read higher sensitivity), the horizontal distance between the two BLUE curves will be much greater than the horizontal distance for the RED curves, i.e. a much higher sensitivity. Therefore, the 1.0-1.2 dT for doubling of CO2 alone turns into ~3.0dT when adding in the humidity feedback. ... This would really help explain the positive feedback of humidity added on top of doubling CO2 alone. After this, I would take the article the direction as proposed by @4 chriskoz. This graph could show the impact on Temp caused by an extreme change in solar radiation, such as during the Maunder Minimum, but I would like to see the article stay more applicable to today's typical solar cycles. Therefore, I would setup this next graph to show the resulting dT between 1) a LOW POINT on our current measured SOLAR CYCLES and 2) a HIGH POINT on our current SOLAR CYCLES. I don't know what the difference in average, earth-surface, net input W/m2 for these two points amounts to ... ~0.25W/m2??? But whatever it is, show these two horizontal lines super-imposed on a "detailed" view of the graph ('detailed' so to better see the dT impact). I expect this equilibrium dTemp impact to be roughly 10% (or less) than that for the CO2 doubling w/ RH impact (~3.0dT). I recall reading on this site that modern variances in solar radiation amounts to (at most) 1/10th that of human induced CO2 changes. owl905: Your point about 400ppm (or 1,000,000 ppm) is NOT a small point! And, the article probably needs to be tweaked a bit in its wording to assure absolute accuracy. The greenhouse effect of CO2 can NOT be ONLY a function of its %concentration (PPM) amongst the rest of gases. Instead, it HAS to be a function of actual #moles per unit volume of CO2 in the atmosphere (or, more clearly for most people, MASS per unit volume). These two are not the same; a given PPM does NOT mean a set MASS/volume concentration. For example, imagine an atmosphere that only had 1/10 the mass (in the entire atmosphere) of N2 and O2 (these being non-greenhouse gases). Then, let's only add CO2 to this hypothetical atmosphere; thus it is the ONLY greenhouse gas in the atmosphere. But, let's add the CO2 to a %concentration of 400ppm, then obviously the mass of CO2 (per unit volume) would be 1/10 of our present atmosphere. There is NO WAY this 1/10 mass/volume CO2 atmosphere could have the same greenhouse effect as our present atmosphere. The point here is that the key driving variable HAS to be MASS/volume NOT % of molecules which, technically, is all that PPM really states. Therefore, the key variable defining greenhouse effect is not PPM, but actually mass/volume or molecules/volume (however you want to express it). But, this detail is getting TOO technical for most people to understand & it deviates from the usually 'talk' of defining the greenhouse effect as a function of PPM. So, I would simply say (for Fig.2) that you would first "flood the atmosphere with present day quantities of N2 and O2, then add CO2 to the concentration of 400PPM". Then, explain that the N2 & O2 cause NO greenhouse effect, so you have created an artifical atmosphere that has a CO2-only greenhouse effect that would mimic today's atmospheric "concentration" of 400ppm of CO2 (this being your original intention in Fig.2) ... without explaining the detail that this also means that this hypothetical atmosphere would also have the same mass/volume concentration of CO2 as today's atmosphere. This slight wording tweak ("400ppm in the same N2 & O2 atmosphere as per today's atmosphere") would then be technically fully accurate and defendable. Sorry for LONG comment. I tend to get too windy. -
Tor B at 05:51 AM on 26 February 2012Radiative Balance, Feedback, and Runaway Warming
Thanks for the clear and informative explanations. Thinking about various variables that affect sensitivity, I'm reminded of Richard Alley's incredible 2009 AGU lecture "The Biggest Control Knob: CO2 in Earth's Climate History" . It appears the 11-year solar cycle will cause greater temperature swings (within an equilibrium system) when the temperature is higher, lets say due to increased atmospheric CO2. Will this make future weather events more chaotic or less "average" (whatever is the new climatic average)? In our current not-in-equilibrium Earth system, the effects of the recent extended solar minimum (plus increased aerosols & La Nina) appear to have virtually countered temperature increases due to increasing CO2. I've read someplace that climate scientists are functionally certain that new global surface temperature records will occur within several years, at the latest. I presume this is because of the influence of both increasing CO2 and increasing solar radiation, regardless of what happens with ENSO or air polution. (SkS article about Dr. Alley can be found here.) -
Dikran Marsupial at 05:50 AM on 26 February 20122nd law of thermodynamics contradicts greenhouse theory
YOGI O.K. so how does it insulate the ground? IR is radiated from the surface, then what happens to it? -
YOGI at 05:45 AM on 26 February 20122nd law of thermodynamics contradicts greenhouse theory
Insulation, it cant warm the ground though unless its warmer than the ground. -
Dikran Marsupial at 05:25 AM on 26 February 20122nd law of thermodynamics contradicts greenhouse theory
YOGI O.K. so *how* does water vapour slow the loss of heat at night (we can move onto the day later)? -
YOGI at 05:22 AM on 26 February 20122nd law of thermodynamics contradicts greenhouse theory
By slowing the loss of heat at night (unless clouds/air that are warmer move in, then that can radiate and warm a cooler surface below), and in daytime by reducing sunlight, and increasing convection due to the low density of water vapour. -
Dikran Marsupial at 05:05 AM on 26 February 20122nd law of thermodynamics contradicts greenhouse theory
YOGI Please answer my question, why does moisture moderate extremes (explaining how the dryness of a desert means there is a greater temperature range)? -
Sky_Hunter at 05:05 AM on 26 February 2012Radiative Balance, Feedback, and Runaway Warming
Nice explanation. Thanks Chris. It is the exponential characteristic of the WV feedback that I find hardest to communicate to people. Your graphs, especially Figure 5, demonstrate this quite clearly. -
YOGI at 05:03 AM on 26 February 20122nd law of thermodynamics contradicts greenhouse theory
Earth`s average surface temperature is maintained by Ocean heat not 33C of back-radiation. -
Dikran Marsupial at 04:59 AM on 26 February 20122nd law of thermodynamics contradicts greenhouse theory
YOGI Perhaps it would be better if you finished discussing the previous example you raised before initiating another? So *why* does moisture moderate extremes? -
YOGI at 04:59 AM on 26 February 20122nd law of thermodynamics contradicts greenhouse theory
Dikran Marsupial moisture moderates extremes. -
David Lewis at 04:59 AM on 26 February 2012Positive feedback means runaway warming
Re: the statement in the post that it is "virtually impossible to trigger a true runaway greenhouse in the modern day by any practical means" Hansen discusses the Venus syndrome in this AGU Bjerknes lecture. I don't know why people say he thinks this is a "very remote" possibility. The words he actually uses are he thinks it is a "dead certainty" if humans are actually stupid enough to try to burn all fossil fuels they can get their hands on. He noted that "our model blows up before the oceans boil", in other words he is unable to simulate the scenario, but he says the model "suggests that perhaps runaway conditions could occur with added forcing as small as 10-20 W/m2. When discussing feedbacks he points out that what caused the last ice age, the Milankovich forcing, was very small, somewhere around 0.25 W/m2, but the eventual forcing that resulted as the ice sheet and vegetation feedback and the greenhouse gas feedback kicked in was 6.5 W/m2. -
YOGI at 04:56 AM on 26 February 20122nd law of thermodynamics contradicts greenhouse theory
Now if I had a greenhouse with glass that was coated with a highly IR reflective layer, it should heat up considerably slower than one with panes made from a material which IR can pass through, according to this flow chart: http://4.bp.blogspot.com/_nOY5jaKJXHM/TDDizFtBw0I/AAAAAAAABMI/Hl_EW6F_-og/s1600/divine.gif -
funglestrumpet at 04:53 AM on 26 February 2012Satellites find over 500 billion tons of land ice melting worldwide every year, headlines focus on Himalayas
Peter Hadfield a.k.a. Potholer 54 has a good video on this topic on YouTube: 'Himalayan glaciers -- no melt in 10 years - YouTube'.(Sorry, haven't mastered this new fangled linking process!) -
Dikran Marsupial at 04:34 AM on 26 February 20122nd law of thermodynamics contradicts greenhouse theory
YOGI Yes, but *why* does dryness mean there is a bigger temperature range? -
Chris Colose at 04:29 AM on 26 February 2012Radiative Balance, Feedback, and Runaway Warming
owl905- Actually there is background non-greenhouse gas imposing a surface pressure of modern-day 1000 millibars, with CO2 mixed into that. There is no methane, ozone, or other GHGs in these experiments. John Brookes- The adiabatic lapse rate is just the temperature structure that most of the atmosphere relaxes to (in the vertical) due to the properties of convection. chriskoz- Actually the model is quite good, but it is one-dimensional, a crude global average without cloud feedbacks, so it's not a GCM or suitable for getting a precise handle on sensitivity. Results from output of this sort have been used in the literature however, so I feel justified in using it here. -
YOGI at 04:26 AM on 26 February 20122nd law of thermodynamics contradicts greenhouse theory
"(i) Why choose a desert rather than say a rain forest?" its drier so has more temperature range. (ii)..it has considerable thermal inertia. yes, but the desert cools rapidly at night. -
muttkat at 04:20 AM on 26 February 2012Ocean acidification isn't serious
Here's statement before the Senate in 2010 about acidification of the oceans: http://climatechangefacts.info/ClimateChangeDocuments/TestimonyIndexOceanAcidificationJohnEverettUS_Senate.htmlResponse:[DB] FYI, posting of links is allowed provided you also explain the context of the link and why it matters/why it's germane to this discussion. Also, there is a robust body of evidence extant in the peer-reviewed, published literature. If you wish to be credible, please draw support from that body with links to papers supporting your position/the point you're trying to make.
Congressional testimony alone is not credible in a scientific forum such as this one.
Future comments constructed such as this one will typically be deleted.
-
Alexandre at 04:19 AM on 26 February 2012Radiative Balance, Feedback, and Runaway Warming
David Lewis Thanks for pointing it out. The link I gave above is for download of the video, which is pretty big (241MB or over 30 minutes in my not-so-great internet connection). Your link seems to be more practical, and works fine for me, with video and sound. -
Dikran Marsupial at 04:06 AM on 26 February 20122nd law of thermodynamics contradicts greenhouse theory
YOGI (i) Why choose a desert rather than say a rain forest? (ii) the sun of course, the back radiation is only there because GHGs in the atmosphere absorbs IR radiated from the surface that is heated by absorbing largely visible and UV light from the sun. N.B. the surface doesn't stop radiating IR when the sun goes down, as it has considerable thermal inertia. -
YOGI at 03:59 AM on 26 February 20122nd law of thermodynamics contradicts greenhouse theory
So what happens in a desert at night, does the CO2 back-radiation turn off when the sun goes down ? and what is warming the ground up quicker through the next morning, the Sun or the back-radiation ? -
David Lewis at 03:57 AM on 26 February 2012Radiative Balance, Feedback, and Runaway Warming
If you follow the links I gave I just discovered you get video and no sound, at least this machine doesn't. The lectures are on Youtube where they don't work as well. -
David Lewis at 03:39 AM on 26 February 2012Radiative Balance, Feedback, and Runaway Warming
9. Alexandre The David Archer video link to the individual lecture, or links to any lectures from the "comprehensive course" webpage which I can get to, that you gave in your comment don't work for me. Maybe you have access to them at those links after logging in somewhere. What does work for me here in Seattle is to go to the UChicagoNews Mindonline PHSC 13400: Global Warming page and select lectures from there. The lecture on the lapse rate you were drawing attention to is lecture 9. -
Bob Lacatena at 02:36 AM on 26 February 2012Was Greenland really green in the past?
21, muttkat, Use the search box in the upper left hand corner. Type in volcano, read and learn. All of this stuff has been covered over and over again. It only takes a moment to read and learn, rather than throwing out questions and comments and links that really just help to make other people as confused as you are. Also note that there is a strict comments policy. Comments are expected to stay on topic. If you have a comment about another topic, find a relevant thread and post your comment there. Off topic comments will be deleted. -
Bob Lacatena at 02:32 AM on 26 February 2012Was Greenland really green in the past?
20, muttkat, Big deal. It's a load of rubbish. Did you actually read the article above, and pursue scientific studies? Or do you subscribe to the theory that if you read it on the Internet, it must be true? Example... from your page:During this time, grape vineyards, which require moderate temperatures and a long growing season, were as far north as England. In comparison, today grapes vineyards are only typically as far north as France in Europe.
And yet from this page:There are nearly 400 commercial vineyards in England and Wales covering approximately 2000 acres of land in total.
So the claim that it was so warm that there were vinyards in England, but not today, is specious. Don't be so gullible. -
muttkat at 02:30 AM on 26 February 2012Was Greenland really green in the past?
Here were some observations of that area from about 1920 to 1940. http://mclean.ch/climate/Arctic_1920_40.htmBy the way, I don't seem to hear about volcanic activity in the Arctic & Antarctica areas but you won't hear about that in the mainstream green media. There was an underwater active volcano found in the Sandwich Islands near Antarctica. There was a volcano that went off in Iceland; has any of the data mentioned that? Theres bound to be some volcanic activity going on and thats usually hot. Another thing the Arctic & Antarctica use to be semi tropical. Things changeResponse:[DB] You already posted on these off-topic issues here. You were responded to immediately afterwards. Please read those responses. If you have any questions on those responses, place those questions there, not here.
Off-topic struck out.
-
YOGI at 02:23 AM on 26 February 20122nd law of thermodynamics contradicts greenhouse theory
IanC#1290 "As for your question, in the OLR (20km looking down) graph and at regions without atmospheric absoprtion, you will be seeing radiation coming from the surface, which is ~265K." But the surface is at 287.7K so must be looking at something colder further up. "The closer you get to the surface, the less temperature contrast between the surface and the air temperature near the "instrument", and so the dip will be smaller." #1301 The closer you get to the surface the less absorption there is from the 600-750 band, and the majority of the effect is above 3km. -
muttkat at 02:02 AM on 26 February 2012Was Greenland really green in the past?
I had found this article about the Vikings and crops being grown in Greenland and that there were trees growing in Greenland. http://green-agenda.com/greenland.html -
muoncounter at 01:59 AM on 26 February 2012Breaking News…The Earth Is Warming…Still!
Ken L#80: "If sea ice largely recovers in winter - then the energy absorbed in a bigger summer ice melt is largely being lost to space." Winter sea ice extent is not recovering quite so completely. But you are correct about the increasing amplitude of the annual freeze-thaw cycle. --source
The cycle has a very clear long term trend, so it is obvious it does not average around 0 from year to year.
In addition, high latitudes consistently warm faster than mid-latitudes.
--source
The cycle has a very clear long term trend, so it is obvious it does not average around 0 from year to year.
In addition, high latitudes consistently warm faster than mid-latitudes.
 -- source
This combination of amplification in ice melt cycle and warming should indicate that not all this energy is lost to space.
-- source
This combination of amplification in ice melt cycle and warming should indicate that not all this energy is lost to space.
-
Alexandre at 01:43 AM on 26 February 2012Radiative Balance, Feedback, and Runaway Warming
John Brookes at 23:20 PM on 25 February, 2012 You can also check David Archer's lecture about the lapse rate. It's part of a more comprehensive course on Global Warming for non-science undergrads. -
Bernard J. at 01:33 AM on 26 February 2012CO2 measurements are suspect
John Marshall. Take the hint from Tom Curtis and Sphaerica - you are, to put it nicely, profoundly in error. If the conversation here is too technical for you, there was a more colloquial one on Deltoid, that should make you blush with embarrassment once you've read through it. -
Ken Lambert at 01:06 AM on 26 February 2012Breaking News…The Earth Is Warming…Still!
KR #81 I said 'some' of the heat would go to ice melt at #66. That 'some' is small.Response:[DB] Rather than continuing with playing semantical games, please try supporting assertions with quantifications and references to peer-reviewed articles appearing in reputable journals that support your position.
-
Bob Lacatena at 00:50 AM on 26 February 2012Radiative Balance, Feedback, and Runaway Warming
4, chriskoz, 7, Pirate, I'll leave it to Chris to give you his answer, but just off the cuff, as he stated in his closing note he used the freely available online material that Ray Pierrehumbert provides for use with his book "Principles of Planetary Climate." Along those lines, that model is complex enough to include things you've never even considered, but still simple enough to run on your desktop in an interpreted language like Python, and for the code to be easily understood by anyone who follows his course by reading the book, doing the problems and working directly with the model. So the point is... it's a teaching model, designed to demonstrate concepts. It's accurate enough to show how the pieces fit together, but not to use as a model for getting specific values (such as "the runaway point" for our planet). -
Bob Lacatena at 00:27 AM on 26 February 2012CO2 measurements are suspect
52, John Marshall, Please note how easily and completely you fell for what is actually a well understood "lie". You read at a denial site about how CO2 levels were way higher in the 1800s and there's a paper to prove it. Except it turns out that everyone who cares to actually be skeptical and look at the science knows that's nonsense. Scientists go to great lengths to properly, accurately measure CO2, and they aren't stupid about it. At the same time, the paper cited by deniers to trumpet this issue was literally stupid about it. They know this. This information is readily available, and it's pretty obvious if you take just a little while to think about it. So why do denial sites keep feeding people this nonsense? The point is that you were tricked, and you came in here all full of anger because you thought the ones who tricked you were the scientists. But it wasn't, it was the deniers. [Fortunately, this site exists exactly because of those sorts of situations. Every time you have one of these "ah ha, got them" moments by reading something at a nonsense denier site, come here to SkS, use the search button, read and learn. After you've done it enough, you'll start to realize that there is no science or truth to the denial arguments. None.] So how do you feel now? Is your anger redirected at a more appropriate target? Or are you instead simply more firmly invested in finding something to justify your anger at "alarmists?" And if the latter is the case... doesn't that say something even more important about the "debate." -
Tom Curtis at 23:39 PM on 25 February 2012CO2 measurements are suspect
John Marshall @52, if you run your car in a closed garage and measure the CO2 concentration in the garage, it will be well above 390 ppmv. It would be obviously foolish to conclude from that that global CO2 concentrations are greater than 390 ppmv. You have a nearby source of CO2 that is contaminating the measurement. As it happens, there are many sources of CO2 contamination. Not only are there cars, factories and people in abundance in cities, all busily emitting CO2 in abundance, and consequently contaminating any measurement. Not only that, but trees and grass are net CO2 sinks in daylight, but net emitters of CO2 at night. Consequently measurements in a forest on a still night will show elevated CO2 levels, again the result of contamination. In the 1850s, and indeed, even in the 1930s this was not well known, and many measurements of CO2 concentrations were made in areas where contamination would be expected. What is worse, Beck, who should have known better compiled a list of measurements without compensating for local contamination beyond the crudest measure, and simply took an average of measurements to determine the CO2 concentration. Given that CO2 concentrations can vary by 100 ppmv or more on a daily basis due to local contamination, the result significantly overestimates background CO2 levels. To determine genuine background levels of CO2, you need to get away from local sources of CO2 emission by getting either very far away from their source vertically, as with these measurements over Colorado: Note that near ground concentrations shown can be as high as much as 50 ppmv above the upper altitude levels even at 500 meters altitude (let alone the 2 meter altitude used by Beck), but with gain in altitude, CO2 concentrations drop to background levels.
Alternatively you can rely on strong winds to dilute the contamination to determine the background by plotting CO2 levels against wind speed:
Note that near ground concentrations shown can be as high as much as 50 ppmv above the upper altitude levels even at 500 meters altitude (let alone the 2 meter altitude used by Beck), but with gain in altitude, CO2 concentrations drop to background levels.
Alternatively you can rely on strong winds to dilute the contamination to determine the background by plotting CO2 levels against wind speed:
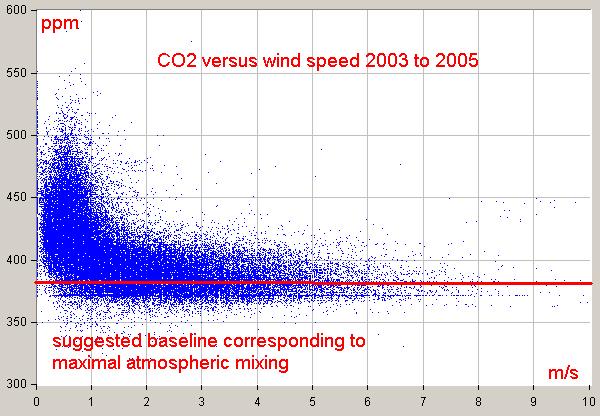 Again, notice when wind velocities are low, local contamination (mostly from forests in this case) can result in CO2 concentrations as high as 600 ppmv, but that the background level is clearly around 390 ppmv.
Or you can get as far away geographically from any contamination as you can, by going to the South Pole:
Again, notice when wind velocities are low, local contamination (mostly from forests in this case) can result in CO2 concentrations as high as 600 ppmv, but that the background level is clearly around 390 ppmv.
Or you can get as far away geographically from any contamination as you can, by going to the South Pole:
 Citing measurements that do not take these precautions to ensure they are measuring the genuine background concentrations, rather than a contaminated sample are, of course of no interest.
-
apiratelooksat50 at 23:21 PM on 25 February 2012Radiative Balance, Feedback, and Runaway Warming
Nicely done! I have the same questions as Chriskoz and look forward to seeing your answers. -
John Brookes at 23:20 PM on 25 February 2012Radiative Balance, Feedback, and Runaway Warming
Very nice thank you. I've read some stuff that mentions the adiabatic lapse rate. I suspect that this is part of the explanation above but left out for the sake of simplicity. Could you do another post where you expand on this part of the picture?
Prev 1249 1250 1251 1252 1253 1254 1255 1256 1257 1258 1259 1260 1261 1262 1263 1264 Next


