


 Arguments


Recent Comments
Prev 1322 1323 1324 1325 1326 1327 1328 1329 1330 1331 1332 1333 1334 1335 1336 1337 Next
Comments 66451 to 66500:
-
prokaryotes at 20:42 PM on 15 January 2012Arctic methane outgassing on the E Siberian Shelf part 1 - the background
So my comment in #11 relates to "The first problem is that in none of the glacial-interglacial transitions of the past 400,000 years has a sudden large methane-spike been recorded." -
prokaryotes at 18:43 PM on 15 January 2012Arctic methane outgassing on the E Siberian Shelf part 1 - the background
Pressurized laboratory experiments show no stable carbon isotope fractionation of methane during gas hydrate dissolution and dissociation ..measured δ13C-CH4 values near gas hydrates are not affected by physical processes, and can thus be interpreted to result from either the gas source or associated microbial processes http://onlinelibrary.wiley.com/doi/10.1002/rcm.5290/full -
Tealy at 17:33 PM on 15 January 2012What's Happening To Tuvalu Sea Level?
Stephen, Firstly the article says:- "It just so happens that the western Pacific and Tuvalu in particular, are one such region where there is a large rise in sea level, much greater than the global average. See figure 3." Now you can't have one part of an ocean higher than anther part of that ocean without a continuous force to hold it there. Otherwise it just flows out until it is level. It is well known that winds cause the rise during la nina when the winds increase. Wind is the only effect that can be a long term cause of a localized sea level rise. Temperature or salinity differentials across an ocean are not sustainable due to eventual mixing. Referring to the diagrams above you can sea the sea level rise is localized and is also in the area that trade winds operate and effect. Just go back to basics and contemplate what could make the sea level locally higher, and also contemplate how high it can increase in relation to the ocean average before the force to outflow is just too great. -
Rob Painting at 17:09 PM on 15 January 2012What's Happening To Tuvalu Sea Level?
Stephen - I came across one recent paper which suggests a strengthening of the easterly trade winds - which directly contradicts the Timmerman (2010) study which I cited. So future trends could see a further above-average sea level rise, or not. -
Stephen Baines at 16:05 PM on 15 January 2012What's Happening To Tuvalu Sea Level?
Tealy "A point you need to consider is that the large sea level rise around Tuvalu is mainly due to the increased strength of the trade winds." But, what is your evidence that trade winds have increased on average in such a way to cause a long term change in sea-level? You need to cite some source before making statements like that. -
Tealy at 15:02 PM on 15 January 2012What's Happening To Tuvalu Sea Level?
KR- A point you need to consider is that the large sea level rise around Tuvalu is mainly due to the increased strength of the trade winds. The trade winds bank the water up in the western Pacific. The sea level rise is localised to that part of the pacific. Water finds it's own level without the trade wind that causes a gradient of level across the pacific. To extrapolate that the rate of sea level rise over the last 60 years will continue at that rate for the next 100 to 150 years means that the trade winds would also need to dramatically increase over the next 100 to 150 years. It's simple cause and effect. It's not difficult to see that there will be a limit to the strength of the trade winds. There will be some limit as to how much the trade winds can increase by.We won't have a 24 hr/day 365 days a year hurricane for a trade wind. You need to analyse the causes before extrapolating the effect. -
eradani at 14:49 PM on 15 January 2012Arctic methane outgassing on the E Siberian Shelf part 1 - the background
I think Eric's first graph is meant to convey that there's more CH4 in the high latitudes. Since there's also more warming in the high latitudes, is the high CH4 related to this? -
eradani at 14:44 PM on 15 January 2012Arctic methane outgassing on the E Siberian Shelf part 1 - the background
@ Eric 4 : that's ppBillion for methane -
prokaryotes at 14:36 PM on 15 January 2012Arctic methane outgassing on the E Siberian Shelf part 1 - the background
More intelligence and estimates from the draft paper by Shakhova and Semiletov http://www.americanwx.com/bb/index.php/topic/30926-this-is-not-good/page__pid__1278205__st__455#entry1278205 -
Daniel Bailey at 14:09 PM on 15 January 2012Arctic methane outgassing on the E Siberian Shelf part 1 - the background
To add onto Tom's comment above, one needs to keep the current levels of atmospheric methane in perspective. The man-made hockey stick rise in methane levels is documented here: [Source]
Gives quite a different perspective than evident from Eric (skeptic)'s comment above. Shows what was missing from methane levels in earlier times: the man-made hockey stick component.
Like an ice rink without a puck...
[Source]
Gives quite a different perspective than evident from Eric (skeptic)'s comment above. Shows what was missing from methane levels in earlier times: the man-made hockey stick component.
Like an ice rink without a puck...
-
Tom Curtis at 14:00 PM on 15 January 2012Arctic methane outgassing on the E Siberian Shelf part 1 - the background
Eric (skeptic) @4, your first graph is a bit hard to read, so I thought this one might be useful for comparison (note the concentrations are in parts per billion for Methane): The formula for the radiative forcing of Methane is not as simple as that for CO2, so I shall simply consult the graph below, and inform you that the radiative forcing of Methane relative the the preindustrial era is 0.23 W/m^2, or just 13% of the equivalent forcing from CO2.
 David Archer discusses potential impacts of the release of Methane from thawing tundra. By his calculation a worst case impact would raise the radiative forcing to about 5 W/m^2 which we would expect to have a severe impact. However, in his (disputed) estimation, that worst case scenario is very unlikely, with more probably scenarios having much lower impacts.
-
prokaryotes at 13:40 PM on 15 January 2012Arctic methane outgassing on the E Siberian Shelf part 1 - the background
A bit more about the GHSZ and GG (geothermal gradient), from the permafrost wiki: At mean annual soil surface temperatures below −5 °C (23 °F) the influence of aspect can never be sufficient to thaw permafrost and a zone of continuous permafrost (abbreviated to CPZ) forms. There are also “fossil” cold anomalies in the Geothermal gradient in areas where deep permafrost developed during the Pleistocene that still persists down to several hundred metres http://en.wikipedia.org/wiki/Permafrost -
Tom Curtis at 13:14 PM on 15 January 2012Gillett et al. Estimate Human and Natural Global Warming
KevinC @31, why does the BEST data terminate in 2005 on your graphs? -
Eric (skeptic) at 13:11 PM on 15 January 2012Arctic methane outgassing on the E Siberian Shelf part 1 - the background
How much does methane contribute to excess Arctic warming (relative to global warming) considering that the concentrations are somewhat higher there (1800 vs 1600 ppm)?
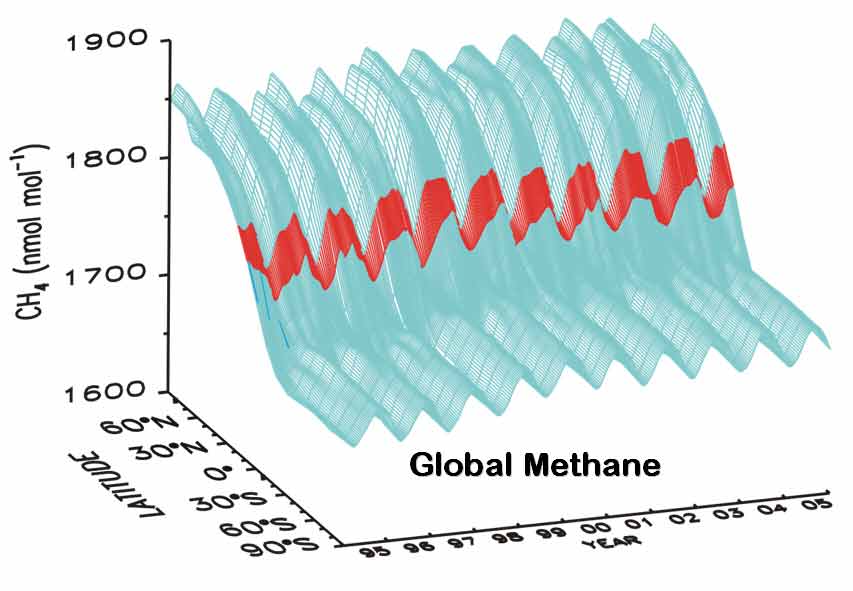
Why there is not more global warming now considering that preindustrial methane was 650 ppm? Also considering the ice core record with higher temperatures in previous interglacials, why wasn't more methane released then?

(click for larger) -
Lou Grinzo at 11:38 AM on 15 January 2012Arctic methane outgassing on the E Siberian Shelf part 1 - the background
I think the text from the post (last graf) that perfectly summarizes the situation is: "We certainly do not need any feedbacks that bring additional natural sources of powerful greenhouse gases to the table, yet that is exactly what we risk up in the Siberian Arctic. The big questions that we now need the answers to are for how long has this outgassing been going on, does it appear to be intensifying and how might a colossal and rapid outburst occur." What worries me most (aside from the obvious) is how so much of the conversation tends to pendulum between "imminent doom" and "nothing to see here, move along". We are doing such a spectacularly bad job of curtailing our GHG emissions worldwide (not to mention the plans of China and India to built a massive number of new coal plants in the next 25 years, and the US' determination to embrace yet another fossil fuel, NG), that any non-trivial feedback is very bad news. The methane hydrate and permafrost contributions don't have to be something out of a cheesy disaster movie to be alarming; if they add up to "only" one or two billion tons of CO2eq/year, that's another wedge of emissions of that size we have to find a way to cut, even though we currently can't even make worldwide emissions level off. -
KeenOn350 at 11:22 AM on 15 January 2012Arctic methane outgassing on the E Siberian Shelf part 1 - the background
Excellent summary of background to methane situation - thanks. DaveW -
Paul Magnus at 11:02 AM on 15 January 2012Gillett et al. Estimate Human and Natural Global Warming
"...the vast majority of the recent global warming to human activity" Isn't highly likely that ALL of the significant recent warming is due to human activity. Surely. Why wouldn't it be. What else would contribute to a significant warming? -
John Hartz at 10:51 AM on 15 January 2012Climate Solutions by dana1981
@Colin #114: The Kyoto Agreement does not impose any monetary penalities on countries who fail to meet their greenhouse gas reduction targets. -
Colin at 10:15 AM on 15 January 2012Climate Solutions by dana1981
…”The primary obstacle to action at the moment is misinformed denial”… I have a different “take” on this. My country, Canada, recently bailed out of the Kyoto agreement, primarily (I think) because we didn’t want to write a CDN $14b cheque for having failed to meet targets. That’s a big number, but I understand it, and I can easily calculate the cost to Canadians on a per capita basis. The much bigger question is what would be the effect on each Canadian had we managed to strictly comply with the requirements of the Kyoto agreement? Seems like a taboo question. (I tend to get criticized for asking) It looks as if this web site is based in Australia, so it wouldn’t be reasonable for your supporters to understand enough about the Canadian economy to address this, but could you explain it to your fellow Aussies? I respectfully submit that until this information can be provided, “misinformed denial” will take second place on the list of obstacles to action. After all, you can hardly expect people to buy in to the program when you won’t tell them about the price. -
Albatross at 08:51 AM on 15 January 2012Gillett et al. Estimate Human and Natural Global Warming
pauls @29, "The BEST graph shows land-only temperatures, where differences are mainly caused by spatial processing idiosyncrasies." You are of course correct. To be honest I was in a rush and grabbed the BEST graphic because it was easily accessible. The fact (and my point) remains that the uncertainties in the global surface air temperature (SAT) data increase as one goes back in time, especially prior to 1880. Here is what I should have shown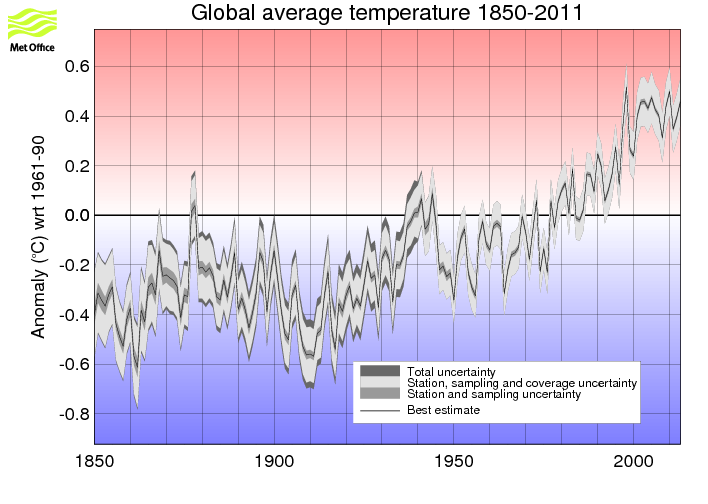 There are more colourful images here in Brohan et al. (2006).
Additionally, while land surface stations was an issue, as I noted in a post, that also applies to SST observations in the early part of the record, perhaps even more so.
Hadley has just released its SST3 product and HadCRUT4 (an update)is available (although not widely at this point). In the latest version they use SST3 and they address some of the low sampling issue at high northern latitudes where marked warming has been taking place.
Having had some experience optimizing numerical models I would every time choose a smaller but more reliable sample than a longer but less reliable sample set. That was my issue with them including data prior to 1880 to try and constrain the model. I honestly do not think one can effectively do that given the large uncertainties present in the observations back then. Also, why limit yourself to one global SAT product when there is GISTEMP and NCDC out there as well.
they did look at 1901-2010 but unfortunately did not show the results for the adjusted/scaled projections using the regression coefficients for that period, nor did they show the estimated TCR estimated for that period (IIRC).
There are more colourful images here in Brohan et al. (2006).
Additionally, while land surface stations was an issue, as I noted in a post, that also applies to SST observations in the early part of the record, perhaps even more so.
Hadley has just released its SST3 product and HadCRUT4 (an update)is available (although not widely at this point). In the latest version they use SST3 and they address some of the low sampling issue at high northern latitudes where marked warming has been taking place.
Having had some experience optimizing numerical models I would every time choose a smaller but more reliable sample than a longer but less reliable sample set. That was my issue with them including data prior to 1880 to try and constrain the model. I honestly do not think one can effectively do that given the large uncertainties present in the observations back then. Also, why limit yourself to one global SAT product when there is GISTEMP and NCDC out there as well.
they did look at 1901-2010 but unfortunately did not show the results for the adjusted/scaled projections using the regression coefficients for that period, nor did they show the estimated TCR estimated for that period (IIRC).
-
Kevin C at 08:04 AM on 15 January 2012Gillett et al. Estimate Human and Natural Global Warming
Pauls and Albatross: On the BEST-Hadcrut comparison: I've swapped a couple of emails with the BEST team on this. They did not make the mistake of using the CRUTEM3 values directly, which as Paul points out is the mean of the hemispheric averages. Rather they used 0.68*NH+0.32*SH, which is pretty close to a land-area average - you can check this and reproduce their plot down to the nearest pixel. Alternatively, you can calculate a true land-area average by simply downloading the CRUTEM3 gridded data and doing an area weighted average: This is virtually indistinguishable to the weighted hemisphere method shown in the BEST figure after about 1920. However, this is still not a valid comparison to BEST, as the BEST team and myself have independently concluded. The reason is that the large 5x5 degree cells used by CRUTEM3 include a significant number of cells with mixed land/ocean. The CRUTEM3 average gives these cells the same weight as land-only cells. If the cells are properly weighted according to the proportion of land in that cell, the coastal cells are downweighted, and the divergence between CRU and BEST is significantly reduced. Here is what the comparison with the land-masked CRU (and NOAA) looks like once this correction is made:
 CRUTEM3 still drops off after 2000, but the dramatic difference is eliminated.
-
Glenn Tamblyn at 07:56 AM on 15 January 2012U.S. 2011: The Wet Get Wetter, the Dry Get Drier
Phil @37 Yep, it is inconsistent with the claim made by skeptics. Or another way of saying it, what the skeptics claim is wrong. There are more catastrophic events, weather/climate related. And the organisation reporting it has zero reason to misrepresent or spin the results. -
Bob Lacatena at 07:38 AM on 15 January 2012U.S. 2011: The Wet Get Wetter, the Dry Get Drier
41, Martin, You are right. I appear to have misunderstood some of the Hadley Cell mechanics. I'll have to look at it more closely. Mind you, as I said before, the Hadley cell is only part of the picture. Water of course is evaporating, rising, and condensing in places other than the equator, so any wind/rain patterns that already exist (such as those relating the Pacific and the US Northwest) are likely to be amplified, unless they are also drastically changed in a way somewhat similar to Hadley Cell growth so that the location of the rainfall changes along with the amount. There are lots and lots of other mechanisms to look into. -
Vergent at 07:13 AM on 15 January 2012Arctic methane outgassing on the E Siberian Shelf part 1 - the background
What could possibly go wrong? I can't wait for part 2 -
Martin at 07:11 AM on 15 January 2012U.S. 2011: The Wet Get Wetter, the Dry Get Drier
Hi, I have found something mentioning why the dry is getting drier and the wet getting wetter here."As the planet warms, the Hadley Cell, which links together rising air near the Equator and descending air in the subtropics, expands poleward. Descending air suppresses precipitation by drying the lower atmosphere so this process expands the subtropical dry zones. At the same time, and related to this, the rain-bearing mid-latitude storm tracks also shift poleward. Both changes in atmospheric circulation, which are not fully understood, cause the poleward flanks of the subtropics to dry."
I still think that a new post giving a fuller explanation why this is happening would be great. Perhaps one of this site's regular authors could put this topic on his or her short list for 2012? -
Martin at 06:44 AM on 15 January 2012U.S. 2011: The Wet Get Wetter, the Dry Get Drier
26, Spherica you wrote"The result is that the moisture that is evaporated at the equator is carried over the the adjacent land and deposited further north."
That seems to contradict what I read about the Hadley cell at wikipedia here "Having lost most of its water vapor to condensation and rain in the upward branch of the circulation, the descending air is dry." I still haven't understood why the Northeast is becoming wetter. -
Eric (skeptic) at 06:36 AM on 15 January 2012U.S. 2011: The Wet Get Wetter, the Dry Get Drier
Muoncounter, it's generally true we won't know what will happen but it's also a fact that the skill of the forecast that you show has dropped to practically zero (coin toss) during this La Nina: text file and explanation and parent page. Those forecasts do pretty well during stable ENSO states, especially El Nino, but not as well during transitions and La Nina, probably because the position of the jet streams is more difficult to predict. -
dana1981 at 04:39 AM on 15 January 2012Gillett et al. Estimate Human and Natural Global Warming
pauls - no, I don't recall Gillett discussing HadSST3 in the paper. -
pauls at 04:24 AM on 15 January 2012Gillett et al. Estimate Human and Natural Global Warming
#6 & 7 Albatross & Dana1981 - The BEST graph shows land-only temperatures, where differences are mainly caused by spatial processing idiosyncrasies. The CRUTEM (not HadCRU) graph shown is constructed by taking the average land temperature anomaly from each hemisphere, adding them together then dividing by two. Since there is much more land in the Northern Hemisphere and there has also been more warming in the North, this technique results in an underestimation of the global land warming trend, and isn't a proper comparison with the other records. This discrepancy isn't present in the land-ocean data because the oceans plug in the gaps. The main source of the lower warming from 1851-2010 is, as Gillett states, the use of a linear regression across the period when making the calculation. The implications of this can be seen in these graphs: the 1961-2010 is well-represented by a linear trend so almost all the temperature change is captured. However, the 1851-2010 is not so well-represented. In particular, the warming over the past 20-30 years is chopped off. As a sensitivity study I did the same thing with GISS (1961-2010 and 1881-2010 - HadCRU 1881-2010 is featured in the previous image). It turns out that HadCRU produces a slightly larger amount of warming both between 1881-2010 and 1961-2010. Did Gillett et al. discuss the HadSST3 changes? Seems to me many of the figures mentioned here will be altered by it's forthcoming inclusion in a new iteration of HadCRUT. -
muoncounter at 03:03 AM on 15 January 2012U.S. 2011: The Wet Get Wetter, the Dry Get Drier
saltspringson#30: "only 23 towns in total, in the US, that experienced either drier or wetter record years" What is the significance of town by town analysis? By the map shown here, 7 states had record wettest (two more near-record wettest) and Texas as a whole (a rather large area) had its record driest during 2011. On a closer look, this map shows SPI within states for the last 12 months. --source
There are quite a few 'towns' in the black (exceptionally dry) and many more in the purple (exceptionally moist); whether they set new records or not makes little difference when your pastures are either burned up or flooded out.
--source
There are quite a few 'towns' in the black (exceptionally dry) and many more in the purple (exceptionally moist); whether they set new records or not makes little difference when your pastures are either burned up or flooded out.
-
muoncounter at 02:40 AM on 15 January 2012U.S. 2011: The Wet Get Wetter, the Dry Get Drier
Eric#34: "despite a climate factor against the remoistening of Texas (La Nina), the weather did so anyway." Not so fast. the National Weather Service issued its latest Seasonal Drought Outlook, for the period from Jan. 5 through March 31, which featured a map showing persistence of drought conditions across virtually all of Texas, with “some improvement” expected in a small sliver of the northeast corner of the state and “drought development” in four remaining and smaller areas in North Texas and the Panhandle. --source, the 5 January US Seasonal Drought Outlook
(link may point to an updating map)
As the man said, "It ain't over 'til it's over."
--source, the 5 January US Seasonal Drought Outlook
(link may point to an updating map)
As the man said, "It ain't over 'til it's over."
-
Phil at 00:52 AM on 15 January 2012U.S. 2011: The Wet Get Wetter, the Dry Get Drier
Glenn Tamblyn @35 The lack of increase in reports of Geophysical catastrophes appears to be inconsistent with the claims made by some "skeptics" that we are simply reporting more catastrophes, not that there are more. If humanity were becoming more sensitive and reporting more events as catastrophic then why hasn't the Geophysical figure increased in line with the others ? -
adelady at 23:40 PM on 14 January 2012U.S. 2011: The Wet Get Wetter, the Dry Get Drier
"You would think that they could find a way to turn their occasional biblical flood inland to turn huge areas of their desert into an inland lake and recharge their water tables." What do you think Lake Eyre and the Great Artesian Basin are? Lake Eyre has filled 3 years in a row. You might think this is entirely predictable and unremarkable. Well, you should note that in the first of those 3 years a lot of people changed all their plans and spent a lot of money to get there and see it - because they thought it was the last chance they'd get in their lifetimes. Filling at all is unusual. Filling twice is extremely unusual. 3 times in a lifetime? Probable but not to be relied on. 3 years straight - unheard of. -
MarkR at 20:44 PM on 14 January 2012Gillett et al. Estimate Human and Natural Global Warming
#27 Tristan : TCR is defined here. Feedbacks take time to 'happen' and stabilise, and this time depends on the feedback: the water cycle feedback should be reasonably quick (reacting within years), but the carbon cycle feedback and the change of albedo from retreating ice sheets should be slower. The TCR is defined as the heating if you increase CO2 through time, and then take the change in temperatures at the decades CO2 doubles. It will be bigger than the 'no feedbacks' climate sensitivity because it'll take over a hundred years to double CO2, and the feedbacks will have had time to react to the first burst of warming. But it's plenty smaller than the final equilibrium sensitivity because the Earth hasn't had time to properly react to the latest warming. -
Glenn Tamblyn at 17:57 PM on 14 January 2012U.S. 2011: The Wet Get Wetter, the Dry Get Drier
Some interesting data from Munich Re - one of the worlds major re-insurers - wrt frequency of catastrophic events: Note how its all Climate related wrt the increase. Geophysical events such as Earthquakes fluctuate but stay stable
-
Tristan at 14:30 PM on 14 January 2012Gillett et al. Estimate Human and Natural Global Warming
Is the TCR the pre-feedback climate sensitivity? How much of TCR is realised in 1 yr, 5 yrs, 10 yrs etc? -
actually thoughtful at 14:26 PM on 14 January 2012Gillett et al. Estimate Human and Natural Global Warming
Chip and Dana - thank you for an interesting discussion. I think I know more about the paper and the issues than I did before. -
Eric (skeptic) at 13:08 PM on 14 January 2012U.S. 2011: The Wet Get Wetter, the Dry Get Drier
Albatross, my point is that despite a climate factor against the remoistening of Texas (La Nina), the weather did so anyway. OTOH the map you linked above shows an eastward shift in the northern precipitation band, certainly some areas in the midwest that were wet got wetter, but areas to the east (like mine in Northern Virginia) got wetter after a dry summer. The patterns shift and what can be said about possible climate change influences is that they will exacerbate extremes especially in summer where, in particular, the hot and dry places get hotter and drier. But a blanket statement like the title of this article will almost certainly be countered with pattern changes in the coming year (like the unexpected series of upper lows in the desert SW). Climate change will not result in particular precipitation patterns as the post implies, it will have more of an amplifying effect, at least for now. -
Doug Hutcheson at 12:30 PM on 14 January 2012Climate Solutions by dana1981
skept.fr@112, you saidI don't think denialists are serious obstacle to carbon tax or climate mitigation in the immense majority of countries in the world
I agree in principle, but the issue being discussed is that climate denialism is the primary obstacle to action. Action, in this sense, can be thought of as meaningful global action. As long as the Murdoch-dominated media of the USA, UK and Australia (aided and abetted by the Lindzens, Christies etc. of this world and the fossil fuel funded think tanks) continue to promote the contrarian viewpoint and ignore the science, it will be difficult for realists in those countries to have political dominance. Australia has legislated a form of cap-and-trade which starts this year, but the right wing Opposition has sworn to repeal it when they hold power. The USA is dragging its feet, with no likelihood of meaningful action any time soon and the UK has a right wing government that is happy to maintain the status quo. Without leadership from these countries, it will be difficult to get meaningful global action. Without an informed electorate in each of these countries, it will be unlikely that sufficient political pressure can be brought to bear to demand change. Most voters in the USA, UK and Australia have their opinions massaged by the main stream media and, to a lesser extent, by the blogs they find. As long as the climate denialist view is promoted in those countries by the people with the loudest megaphones, the electorate will not demand AGW action, so I believe it is true to say that "The primary obstacle to action at the moment is misinformed denial". -
Albatross at 10:44 AM on 14 January 2012U.S. 2011: The Wet Get Wetter, the Dry Get Drier
Eric @32, "The end of 2011 was definitely not wet getting wetter and dry getting drier, but the opposite. That is not quite true, here is the PDSI for the fall (September through November 2011): Still dry in the Red River valley, still areas of drying in the southern Great plains, especially Texas. Still wet over the northeast and Ohio river valley.
Things did improve over Texas in December, but even by January 10 2012 almost all of Texas was still in drought, with large areas classified as "extreme" or "exceptional" drought.
Still dry in the Red River valley, still areas of drying in the southern Great plains, especially Texas. Still wet over the northeast and Ohio river valley.
Things did improve over Texas in December, but even by January 10 2012 almost all of Texas was still in drought, with large areas classified as "extreme" or "exceptional" drought.
-
Albatross at 10:31 AM on 14 January 2012Gillett et al. Estimate Human and Natural Global Warming
It is odd how "skeptics" regularly admonish models suddenly find favour with those modeling studies that lean towards their pre-conceived beliefs and at the same time ignore the full body of evidence about climate sensitivity. Gillett et al. like all papers does not stand alone but forms part so the larger body of evidence-- the preponderance of evidence from Multiple independent lines of evidence still point to and equilibrium climate sensitivity (EQS) near 3 C for doubling CO2. The authors of Gillett et al. (2012) also make the folllowing observations: "Our analysis also leads to a relatively low and tightly-constrained estimate of Transient Climate Response of 1.3–1.8°C, and relatively low projections of 21st-century warming under the Representative Concentration Pathways." "These estimates of TCR are consistent with previously derived ranges (grey bars) [Hegerl et al., 2007; Knutti and Tomassini, 2008; Stott et al., 2006], though our ranges are more tightly constrained, in part because they are derived from a single model with relatively low multidecadal variability and do not account for model uncertainty" So there is no serious conflict or challenge to the data reported in the IPCC's AR4. In section 10.5.2 of AR4 they state: "Fitting normal distributions to the results, the 5 to 95% uncertainty range for equilibrium climate sensitivity from the AOGCMs is approximately 2.1°C to 4.4°C and that for TCR [transient climate response] is 1.2°C to 2.4°C (using the method of Räisänen, 2005b). The mean for climate sensitivity is 3.26°C and that for TCR is 1.76°C." Now the important part, the "skeptics" are trying to suggest the range of TCR found in Gillett et al. (2012) shows that equilibrium climate sensitivity is much lower than the mean value of +3 C reported in AR4 and that consequently the expected warming for doubling CO2 will be much lower than previous estimates. However, even if one selects the lower range for TCR estimated by Gilett et al. (1.3 to 1.8) the median value for TCR for the models discussed in AR4 lies in that range at 1.65 C. Moreover, the median EQS for those models eight models having a TCR lying within Gillett et al's lower range is ~2.85 C. So mean TCR of the IPCC AR4 models lies within lower range estimated by Gilett et al. and those models predict a mean EQS of almost +3 C. Now this all assumes that we will only double CO2, if we continue with BAU as Michaels and his oil lobby friends are advocating then we could treble even quadruple CO2 by 2100, and then even using Gillett et al's most conservative estimates for TCR, the warming by 2100 (before equilibrium has been achieved) could range between about 3.1 and 4.3 C. I fail to see where the reason for optimism from the climate "skeptics" is stemming from. Gillett et al. is not a vindication of Michaels et al. (2002) and it is certainly not an excuse to advocate continuing with business as usual. -
Eric (skeptic) at 10:05 AM on 14 January 2012U.S. 2011: The Wet Get Wetter, the Dry Get Drier
I'm not sure how meaningful figure 3 in the Jeff Masters link is (from link in post 8). The red line does waver above the black line a bit more lately, but it should end in 2006 at a level less than the 30's or 50's. 2011 was certainly an interesting year weatherwise, but the climate factors were unusual (strong La Nina that weakened more rapidly than usual). The La Nina is not very strong now and some weather factors are inducing closed lows in the desert SW alleviating the Texas drought. The end of 2011 was definitely not wet getting wetter and dry getting drier, but the opposite. -
skept.fr at 09:58 AM on 14 January 2012Climate Solutions by dana1981
#111 : well, I quite agree with your post (I favour a carbon tax at any level it is possible to implement it, national if not European, European if not OECD, OECD if not global), but the original quote from you I was answering : "The primary obstacle to action at the moment is misinformed denial" . I don't think denialists are serious obstacle to carbon tax or climate mitigation in the immense majority of countries in the world, whose representatives all agree GW is human-made at UNCCC rounds. I observe that denialists have some media power and influence in the USA. But even there, fossil, libertarian and conservative lobbies have their own agenda, it is not really Lindzen or Spencer or Michaels who influences strongly the choice for Keystone XL, Alaska / GoM oil drilling, or shale gas overexploitation, for example. The real problem we must deal with is not an infime minority of scientists in the climate community, but the complexity of energy policy in developed and emerging countries. I'm far more afraid by a coming Russian or Indian clash in the post-Kyoto negotiations than by the residual and usual bla-bla of denialists' blogs. Of course, I agree that the reluctance of USA to any international and mandatory commitment is a long lasting obstacle to global climate policy, and that denialism is a (smaller and smaller) part of this attitude. But not the "primary obstacle" for now and tomorrow. -
Albatross at 09:25 AM on 14 January 2012Gillett et al. Estimate Human and Natural Global Warming
Well this thread have now evolved into disassembling and discussion of semantics. I'm going to post something that takes a look at the bigger picture soon. -
Chip Knappenberger at 09:23 AM on 14 January 2012Gillett et al. Estimate Human and Natural Global Warming
dana1981@22: Fair enough. And thanks for the discussion. -Chip -
Bob Lacatena at 09:21 AM on 14 January 2012U.S. 2011: The Wet Get Wetter, the Dry Get Drier
28, Martin, I'm unaware of any quantitative predictions (they may be there, but I don't know of them). I'm not sure I'd put much value in them anyway. As I said, there are a whole lot of factors, from Hadley Cells and the ITCZ to mountain ranges (or low-lying land), oceans, ocean currents, etc. There's just too much to ever predict with our current understanding and modeling. On the ITCZ, though... I have to look more closely at the article. The ITCZ is a part of the Hadley Cell. It's that spot where the air rises. I was aware that the Hadley Cells would grow in width, but did not realize that they were saying the center – the ITCZ – would also shift north. That's yet another wrinkle in things. I'm actually unsure why it should shift north, because it primarily tracks the spot where the sun strikes the earth directly, at 90˚ at noon, which is why it shifts north and south with the seasons. I'll have to research this some, when I have time. -
dana1981 at 09:03 AM on 14 January 2012Gillett et al. Estimate Human and Natural Global Warming
Chip @21 - right, the TCR would be similar, but a bit higher for 1901-2010 as compared to 1851-2010, but the projections of future warming (which is what your post focuses on) would be higher due to aerosol changes. How much higher, we can't say without actually running the model with those constraints. -
saltspringson at 08:57 AM on 14 January 2012U.S. 2011: The Wet Get Wetter, the Dry Get Drier
Thanks for the link to http://www.ncdc.noaa.gov/sotc/ The data supplied there indicates that out of the whole US, only 3 towns (all in Texas) had "record" driest years in 2011, and, 20 towns had "record" wettest years in 2011. The "records" of the 3 dry towns were 19-32% drier than the previous records. The records broken were all from 1970. The "records" of the 20 experiencing wettest years, were as follows: .01" - 2" above previous record - 8 towns (.02% - 3.2% over previous records). The previous records were from 1880, 1935, 1950, 1983, 1990, 1996, 1998, 2005. 2.01" - 5" above previous record - 8 towns (4.13% - 7.91% over previous records)The previous records were from 1911, 1935, 1952, 1983, 1983, 1989, 2004, 2008. 5.01" - 15" above previous record - 3 towns (10.61% - 21.34% over previous records)The previous records were from 1990, 1996, 2006 15.7" above previous record - 1 town (27.27% over previous records)The previous record was from 1990. Considering there are only 23 towns in total, in the US, that experienced either drier or wetter record years, I'm having difficulty in seeing how this data can be used to successfully predict any kind of a trend. -
Chip Knappenberger at 08:45 AM on 14 January 2012Gillett et al. Estimate Human and Natural Global Warming
Dana1981, The TCR is determined only by the GHG coefficient. The temperature changes (i.e., the “projections”) for the 21st century are dependent on the TCR and the emissions pathways (and thus both the GHG and the OTH coefficients are required). So, as I said in my last comment, we “can be pretty certain” that the value of the TCR would be similar whether calculated using the temps from 1851-2010 or 1901-2010 (since the GHG coefficients are quite similar). As to how global temperatures progress over the 21st century, it is harder to say without more digging into the details of the scenarios used by Gillett et al. coupled with the impact of the changes in the OTH coefficient. Right? -Chip -
dana1981 at 08:22 AM on 14 January 2012Gillett et al. Estimate Human and Natural Global Warming
Chip #19 - this is incorrect:"we can be pretty certain that the results from 1901-2010 would be similar to those from 1851-2010"
As I noted @16, calling the coefficients "similar" is a big stretch. The GHG coefficient is more positive and the OTH more negative for the 1901-2010 timeframe (compared to 1851-2010). That means more GHG warming and less aerosol cooling in the RCP scenarios, which means overall more warming than in the 1851-2010 timeframe. How much more we can't know. As I said, it would be somewhere in between the 1851-2010 and 1901-2000 timeframes.
Prev 1322 1323 1324 1325 1326 1327 1328 1329 1330 1331 1332 1333 1334 1335 1336 1337 Next


