


 Arguments


Recent Comments
Prev 1323 1324 1325 1326 1327 1328 1329 1330 1331 1332 1333 1334 1335 1336 1337 1338 Next
Comments 66501 to 66550:
-
Chip Knappenberger at 08:11 AM on 14 January 2012Gillett et al. Estimate Human and Natural Global Warming
Dana1981 (re:#16), You say: “We don't know what the projections would look like using the 1901-2010 coefficients, and assuming that "they get much the same answer" (which Gillett et al. do not state) just because the coefficients are "similar" is unwarranted.” Well, while we may not know quite what the projections would look like (it would probably take a bit more digging), when it comes to the TCR (a key to the magnitude of coming climate change), we can be pretty certain that the results from 1901-2010 would be similar to those from 1851-2010 because Gillett et al. indicate that the TCR is largely derivable directly from the GHG coefficient (and the size of its uncertainty…both quantities appear quite close from the 1851-2010 and the 1901-2010 time periods…see their Figure 3a): “The GHG regression coefficient may also be used to estimate the Transient Climate Response by scaling the temperature response at the time of doubling CO2 (averaged between the year 60 and 80) in a simulation with a 1% increase in CO2 per year following Stott et al. [2006].” -Chip -
Albatross at 07:58 AM on 14 January 2012Gillett et al. Estimate Human and Natural Global Warming
And if anyone had any doubts that this is an isolated incident by WCR (i.e., Michaels) they would be wrong, and it is not limited to doctoring graphs, but also ignoring or amending text from papers that does not support their narrative. Here DeepClimate shows how Michaels and Knappenberger misrepresented the work of Easterling and Wehner (2009) and Solomon et al. (2010) in a post titled "Michaels and Knappenberger’s World Climate Report: “No warming whatsoever over the past decade”" There is a very clear pattern of deliberate attempts to mislead and misinform by the WCR. well, either "deliberate" or they have no clue how to properly undertake science and report on science. -
Albatross at 07:48 AM on 14 January 2012Gillett et al. Estimate Human and Natural Global Warming
"The main point being, that data is data, and dana1981 or I, or the original authors can decide which data are important for the discussion at hand." Yes, WCR is entitled to their own opinions, but not their own facts and having their own opinions certainly does not entitle them to doctor scientists' graphics! "Dana1981 is telling a story from the Gillett et al. paper that he has in interest in (and which has a different emphasis than that of the original authors), and he providing that data which best illustrates his point." Not true, as evidenced by the OP, and a strawman to boot. Trying to equate a summary article of the entire paper with a distorted, one-sided misrepresentation of the paper which included a doctored graph is offensive not to mention [snip] -
dana1981 at 07:48 AM on 14 January 2012Gillett et al. Estimate Human and Natural Global Warming
Chip @ 15 - no. "Similar" is a subjective term (looking at 3a, I would not call the 1901-2010 regression coefficients similar to those from 1851-2010 by any stretch of the imagination. GHGs are similar, but NAT and OTH are very different). But the authors are quite clear why they used 1901-2000:"By contrast, when regression coefficients calculated over the shorter 1901–2000 period following [Stott et al., 2006] are used to scale projections..."
We don't know what the projections would look like using the 1901-2010 coefficients, and assuming that "they get much the same answer" (which Gillett et al. do not state) just because the coefficients are "similar" is unwarranted. -
Chip Knappenberger at 07:40 AM on 14 January 2012Gillett et al. Estimate Human and Natural Global Warming
Albatross: You ask "I am curious why they did not select a period from say 1900-2010, or 1950-2010 (periods when the global coverage was much more complete". From Gillett et al.:"Figure 3a shows that similar GHG regression coefficients to those derived over the period 1851–2010 are obtained either over the period 1851–2000 or 1901–2010." In other words, when they used 1901-2010 they get much the same answer when it comes to GHG as when they used 1851-2010. The odd man out was the analysis using only data from 1901-2000 (dana1981's preference). -Chip -
dana1981 at 07:40 AM on 14 January 2012Gillett et al. Estimate Human and Natural Global Warming
Chip @11, this is a false statement:"It is only when using a time period (1901-2000) that neither starts at the beginning of the record (1851) nor extends through the end of the record (2010) that a higher TCR is inferred."
We only know their results from the two timeframes plotted in Figure 4 above. They do show the regression coefficiencs for the timeframe 1901-2010 in Figure 3a, and they appear to be somewhere in between those from 1851-2010 and 1901-2000. This isn't surprising, since as mentioned above, HadCRUT is biased low over the past decade in particular. This is also a misleading statement:"its publication will probably not result in as much teeth gnashing behind the scenes as ours did (Michaels et al., 2002)—with similar results"
One possible result of one aspect of Gillett et al. is similar to Michaels et al, but for very different reasons. Michaels et al. for example did not attribute over 100% of the observed warming to anthropogenic factors. That is a very different result. And of course you continue to ignore the warming projections using other timeframes besides the convenient 1851-2010, which produce very different results than the Michaels paper. Albatross @12 - Gillett wanted to have comparable results to previous studies, so they used similar timeframes as in previous work. 1851-2010 is similar to the IPCC 2007 (but extended to more recent years), and 1901-2000 I believe is the timeframe used by Stott (2006). I wish they had shown the projection using the 1901-2010 timeframe, and I also wished they had used multiple data sets, rather than relying solely on HadCRUT, which we know has a cool bias. But that's the reasoning behind their timeframe selections. -
Albatross at 07:34 AM on 14 January 2012Gillett et al. Estimate Human and Natural Global Warming
"However, its publication will probably not result in as much teeth gnashing behind the scenes as ours did (Michaels et al., 2002)" Michaels et al. (2002) was met with skepticism b/c it was a bad paper that should not have been published, but it was given a free pass by then editor Chris de Freitas (a denier), just as was Soon and Baliunas (2003). Between 1997 and 2003, de Freitas gave 14 papers from his "skeptic" pals free pass. Most of which were so flawed that they should not have seen the light of day, including Michaels et al. (2002). You can read more about this sad saga at "Skeptics Prefer Pal Review Over Peer Review: Chris de Freitas, Pat Michaels And Their Pals, 1997-2003" It seems that the World Climate Report are now trying to invert reality. And again, Gillet et al. does not vindicate Michaels et al. (2002) and I bet that Gillett et al. would confirm that if asked. -
Albatross at 07:23 AM on 14 January 2012Gillett et al. Estimate Human and Natural Global Warming
It would be very helpful if three authors of Gillett et al. (2011) could post some comments putting an end to the speculative assertions being made here and elsewhere by the fake skeptics. If they are following this thread I encourage them to participate. I am curious why they did not select a period from say 1900-2010, or 1950-2010 (periods when the global coverage was much more complete". According to BEST (who use more data than do HadCRUT) in 1850, about 40% of the land surface was sampled, almost exclusively in the N. Hemisphere. By 1880 the coverage had increased to almost 60%, with data also available for some of the S. Hemisphere land masses too. By 1900 about 75% of the land surface was sampled. By 1955 about 90% is achieved. -
Albatross at 07:13 AM on 14 January 2012Gillett et al. Estimate Human and Natural Global Warming
Readers, Apparently Is Dr. Michaels is indeed not incapable of speaking for himself. This is usually the point (in a world where ethics and morals reign supreme) when reasonable, ethical people sincerely and humbly apologize to Gillett et al. for doctoring a figure from their paper and thus also misrepresenting the authors' work/research. But instead we have a bunch of weaseling and rationalizing and obfuscation going on. that says a lot as to their actual motives/intent. Doctoring graphs is scientific misconduct and could be actionable by the journal in question. This much is very clear, the only ones with an agenda here are World Climate Report, and it is an ideological, scientifically void agenda at that. -
william5331 at 06:56 AM on 14 January 2012U.S. 2011: The Wet Get Wetter, the Dry Get Drier
Australia seems to be an extreme case of flood and drought. You would think that they could find a way to turn their occasional biblical flood inland to turn huge areas of their desert into an inland lake and recharge their water tables. It would be no larger a project in relation to the size and wealth of their society than what the Nabateans did in the Middle East 2000 years ago. -
Chip Knappenberger at 06:35 AM on 14 January 2012Gillett et al. Estimate Human and Natural Global Warming
Dana1981, Sure, as to the science. Gillett et al. performed a sensitivity analysis to see how their results were impacted by the time period selected. What they found, and what they showed in their Figure 3a (which was not in that part of all the data that you showed) was that their results were pretty similar when the temperature record was made more complete by either extending it backwards to 1851 or forward to 2010. It is only when using a time period (1901-2000) that neither starts at the beginning of the record (1851) nor extends through the end of the record (2010) that a higher TCR is inferred. The authors clearly think that the science (i.e., the sensitivity analysis) supports their opinion that the results from the full data record provide an improvement over previous results which used the 1901-2000 period—which runs contrary to your feeling that using the latter time period provides a result that “seems more likely to be correct”. But, that said, and as you well point out, there is still much work to be done here and Gilllett et al. are the first to admit that this result is only a step along the way. However, its publication will probably not result in as much teeth gnashing behind the scenes as ours did (Michaels et al., 2002)—with similar results—a decade ago. -Chip -
scaddenp at 06:31 AM on 14 January 2012It's aerosols
Can we get this clear? Climate responded to sum of all the forcings. Graphs of just one arent useful by themselves. Volcano aerosols are also important. Please read the Lean and Rind paper. -
dr2chase at 06:29 AM on 14 January 2012Climate and Sea Level: An Emerging Hockey Stick
#20 Agnostic - as others have noted, I think you may have made a metric typo. 50mm/yr is 5m/century, which is the same as Hansen's geologic-record-says-it-could-be-faster worries, and plenty fast. It doesn't take much to cause problems -- a meter's rise starts to mess with access to barrier islands in Florida (where lots of people live in expensive waterfront homes). Drainage in all sorts of low-lying areas near the coast also gets worse -- whatever the ten-year flood is now, imagine it 3 feet higher. -
scaddenp at 06:25 AM on 14 January 2012Climate and Sea Level: An Emerging Hockey Stick
Skept.fr - this is offtopic for here. I have responded here -
scaddenp at 06:24 AM on 14 January 2012Climate Solutions by dana1981
Responding from here A democracy can only go as fast as its electorate will let them. Most countries signed up to Kyoto; many countries have carbon trading. I wasn't specifically talking about US, however, while the US procrastinates, its much harder to for other governments to take action. The US position as a consumer is important - if carbon tax was levied at border, then its a real incentives for the exporter to US to create their products with low-carbon energy to get a competitive edge. "Hansen taxes" have the advantage of being effective without needing worldwide agreement. -
Martin at 06:21 AM on 14 January 2012U.S. 2011: The Wet Get Wetter, the Dry Get Drier
Sphaerica, 26 Thanks for your detailed answer. I clicked on the links you suggested. If I have correctly understood that Scientific American article the ITCZ will move north by 5 degrees (about 550 km) by 2100. I assume northern edge of the Hadley cell will do the same? It seems to me that the drought in Texas and the additional rain in the Northeast are much stronger than anything predicted for the beginning of this century, i.e. the rain has moved far further north than I would have expected. What quantitative predictions are made with regards to Hadley cell changes and precipitation for the previous and the current decade? DSL, 27 Thanks for pointing this paper out to me. I did start to read it but it contains too many terms that I'm not familiar with. So I don't think I really understood it. Perhaps you could explain why the Hadley cell is expanding poleward and weakening(!) I would have expected it to be strengthening. Sphaerica mentions that the forces behind the Hadley cell are getting stronger. Surely this means that the HC gets stronger as well?Response:[DB] Please refrain from all-caps usage. And also please familiarize yourself with the Comments Policy of this website.
Thank you.
-
dana1981 at 06:03 AM on 14 January 2012Gillett et al. Estimate Human and Natural Global Warming
The difference Chip, is that Gillette et al. and I showed all the data, whereas you only showed some of the data, and deleted the rest. I haven't hidden or deleted anything. I also discussed the caveats in the paper, which you did not, and the attribution aspect of the paper, which you did not. You were very selective in what you found "important", for obvious reasons. But this will be a subject for Monday's post. Let's please focus on the science in Gillett et al. here. -
Chip Knappenberger at 05:42 AM on 14 January 2012Gillett et al. Estimate Human and Natural Global Warming
The main point being, that data is data, and dana1981 or I, or the original authors can decide which data are important for the discussion at hand. There exists a world of folks out there who will cry ‘foul!’ if in doing so, a great distortion of the science results (see here for example). Dana1981 is telling a story from the Gillett et al. paper that he has in interest in (and which has a different emphasis than that of the original authors), and he providing that data which best illustrates his point. Others are free to argue that other data perhaps tells a different story. In our World Climate Report story, we too, preferred to highlight some portions of the Gillett et al. work. In our case, a portion of the Gillett et al. results that was highlighted by the original authors. Dana1981 is free to argue that there are additional aspects that we did not cover. The issue I have with dana1981 is the stridency of his comments at Watts Up With That concerning our article—ironic considering the contents of his post on Gillett et al. here. -Chip Knappenberger World Climate Report -
Robert Murphy at 05:35 AM on 14 January 2012It's aerosols
JamesWilson #13: "So there the temperature went up from 1970 to 1990." No, it said "late 1970s to 1990s". You should know this because that's what you quoted from the article. That is not 1970-1990. And it didn't say that warming stopped after the 90's, btw, it said "the rate of global warming in the last decade or so has slowed." "Here it was cool and then went up in 1985." No, that is not what this article said: "The global dimming trend reversed around 1990 - 15 years after the global warming trend began around 1975. So it can't explain what began the global warming trend." See? The warming started in about 1975 in both articles. The trend that reversed in the 80's was the global dimming trend. There is no conflict. -
dana1981 at 05:23 AM on 14 January 2012Gillett et al. Estimate Human and Natural Global Warming
Interesting point by Albatross @7 - HadCRUT being biased high prior to 1900 and biased low after 2000 would both result in underestimating the net trend over that period, which Gillett et al. appear to have done. Nevertheless, even HadCRUT seems in clear agreement that there was more warming 1851-2010 than 1961-2010, contrary to Gillett et al. -
Albatross at 05:03 AM on 14 January 2012Gillett et al. Estimate Human and Natural Global Warming
MarkR, "I suspect that the choice of HadCRUT3 (which seems to lowball the warming, particularly in the decade 2000-2010) has something to do with it. Using GISSTemp, NCDC or an eventual global BEST product might bring the periods into better agreement." I agree. If one looks at the BEST data, one can see that global coverage prior to 1900 was pretty dismal, and we all know that even to this day HadCRUT has coverage issues , especially over the Arctic. It would have made more sense to use all three global surface temperature datasets from 1880, or a point in time when global coverage was deemed acceptable, especially if the purpose is to constrain the model. One cannot effectively constrain the climate model with poor data and/or for times when data coverage was poor. The above data also show HadCRUT prior to 1880 likely being on the high side, while since then it has mostly been on the cool side compared to the other records.
-
Albatross at 04:54 AM on 14 January 2012Gillett et al. Estimate Human and Natural Global Warming
Is Dr. Michaels incapable of speaking for himself? This is hilarious though, a (-snip-), Chip Knappenberger from world climate report (a PR lobby group that has doctored at least one other graph recently, on that occasion a graph by Dr. Urban and colleagues), now desperately tries to turn the tables by falsely accusing others of deception. He is trying to use a trick out of Karl Rove's playbook-- falsely accuse others of doing exactly what you are doing. That may work on the gullible and misguided folks who follow "World Climate Report" but not us. On a positive note, glad to see that Knappenberger is following SkepticalScience. I'll write more later on how only by ignoring the body of evidence (by deleting/ignoring inconvenient data) could Michaels try and use Gillett et al. (2011) to try and claim vindication of their seriously flawed paper from 2002.Response:[DB] Everyone: No accusations of deception. Any accusations of deception, fraud, dishonesty or corruption will be deleted.
This applies to all parties.
-
dana1981 at 04:07 AM on 14 January 2012Gillett et al. Estimate Human and Natural Global Warming
If Chip has accused me of deception for not including Figure 3a, that would be incredibly ironic. In his and Pat Michaels' post on the subject, not only did they exclude Figure 3a, but they only included one figure (3d, or my figure 4 above), and they deleted some of the data from it to boot. We will have a post on this subject on Monday. The post quite clearly explains the reasons why there are legitimate concerns about the 1851-2010 regression results. For one they're based on the estimate that the surface only warmed 0.6°C over that period, which I think is a clear underestimate. -
JamesWilson at 04:03 AM on 14 January 2012It's aerosols
This article conflicts with the one I was commenting on here Quoting from there "After a rapid rise in global surface air temperatures during the late 1970s to 1990s" Quoting from here "In the mid-80's, the trend reversed and radiation levels at the Earth's surface began to brighten." So there the temperature went up from 1970 to 1990. Here it was cool and then went up in 1985. Both are because of Aerosols... and proven... and conflicting... Right? Then if you go back to the temperature graph here you see that there is no cooling period pre 1985. (This is the modern temperature graph.) Conclusion: Both articles conflict. The one with a modern temperature graph conflicts with its own SO2 emissions graph. Not a very scientifically convincing solution to the 2000-2010 flat temperature problem.Response:[DB] Fixed bad html.
-
MarkR at 03:50 AM on 14 January 2012Gillett et al. Estimate Human and Natural Global Warming
...as do his other Figures. And Dana's article points out throughout the uncertainties and mentions the sensitivity to time period choice. I suspect that the choice of HadCRUT3 (which seems to lowball the warming, particularly in the decade 2000-2010) has something to do with it. Using GISSTemp, NCDC or an eventual global BEST product might bring the periods into better agreement. As would using periods of more complete global coverage (i.e. from sometime between 1870-1900 onwards) -
MarkR at 03:38 AM on 14 January 2012Gillett et al. Estimate Human and Natural Global Warming
#1 Chip Knappenberger : Is this a serious problem? Dana's figure 3 includes both the 1851-2010 and 1901-2000 results for climate sensitivity. -
Chip Knappenberger at 03:30 AM on 14 January 2012Gillett et al. Estimate Human and Natural Global Warming
Dana1981. (-Snip-). What is presented in Gillett et al. Figure 3a are the results of the sensitivity of their regression weights to the time period chosen. If you were to show Figure 3a, then your readers would see that the regression coefficient for the GHG was pretty stable across time periods, with the exception of the 1901-2000 time period. The GHG regression coefficient (and thus TCR) is higher for the period 1901-2000 than it is when a more complete time period is used by either extending the data backwards to 1851 and/or forward to 2010. It is hard to argue, as you seem to want to do, from the results of Gillett et al. Figure 3a that the results from an intermediate data period (1901-2000) are superior to results using a more complete and up-to-date period of time. (-Snip-) -Chip Knappenberger World Climate ReportResponse:[DB] Please refresh yourself with the Comments Policy.
Accusations of deception snipped.
-
Steve Case at 03:09 AM on 14 January 2012Climate and Sea Level: An Emerging Hockey Stick
50 cm/annum doesn't sound like it's that much, but it's well over a millimeter per day and over 150 times the current rate. -
CBDunkerson at 01:41 AM on 14 January 2012Satellites show no warming in the troposphere
scienceteacher, you refer to CCSP modeling being an artifact, but actually Singer's claim is that Santer et al 2008's finding of consistency between modelled and observed results is "an artifact"... CCSP 2006 is mentioned in that section only as sharing some of the same authors as the Santer study. Singer makes a number of claims about the Santer study, but the primary one is that the modeled results do not match UAH satellite observations. This is essentially the same song and dance we've been hearing from Spencer & Christy (the developers of the UAH record) and debunked here. Finally, his history should be considered. This is Fred Singer. Name a major instance of 'scientific' denial in the past 40 years and he has been part of it. Tobacco doesn't cause cancer, asbestos is safe, acid rain doesn't exist, there is no danger from ozone depletion, et cetera... he was involved in all of them. No, his track record does not prove that he is wrong about AGW too... but it certainly shouldn't inspire confidence. -
DSL at 01:31 AM on 14 January 2012U.S. 2011: The Wet Get Wetter, the Dry Get Drier
In addition to Sphaerica's response, Martin, you might try Lu, Vecchi, & Reichler (2007) for a basic physical mechanism and its relation to GCMs. A post on Hadley Cell changes, though, would be useful--and something Norman should investigate. Abstract of Lu (emphasis mine): "A consistent weakening and poleward expansion of the Hadley circulation is diagnosed in the climate change simulations of the IPCC AR4 project. Associated with this widening is a poleward expansion of the subtropical dry zone. Simple scaling analysis supports the notion that the poleward extent of the Hadley cell is set by the location where the thermally driven jet first becomes baroclinically unstable. The expansion of the Hadley cell is caused by an increase in the subtropical static stability, which pushes poleward the baroclinic instability zone and hence the outer boundary of the Hadley cell." -
Bob Lacatena at 01:25 AM on 14 January 2012U.S. 2011: The Wet Get Wetter, the Dry Get Drier
25, Martin, I don't know the answers to all of your questions, and as you say, making regional predictions is very, very tricky. But in reference to your specific question of why global warming should specifically make parts of the South more dry and areas further north more wet... as I previously commented here and here and in the rest of that thread... Very simply, the Earth has something called Hadley Cells. The sunlight strikes the earth most directly at the equator, which also is predominantly ocean. Thus the greatest, most continuous heating and evaporation occurs there.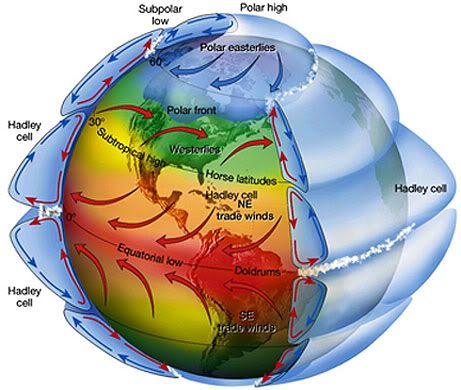 This hot air rises, carrying the moisture with it. Eventually it can't rise any further and spreads north and south (at high altitude). This continues as the air cools and eventually sinks.
The result is that the moisture that is evaporated at the equator is carried over the the adjacent land and deposited further north (or south).
If you look at a map of the Earth, you'll the the deserts predominantly occupy the same latitudes... those areas over which the Hadley Cells carry the moisture before depositing it.
How is this affected by global warming? The forces behind the Hadley Cells get stronger. There is more evaporation, and the air is warmed more and travels higher and farther. This means that the arid area within the Hadley Cell grows, and the area at the far edge of the cell with the rain – more of it – moves further north.
And, of course, the sun continues to strike that growing arid area, which coupled with the increased warmth serves to evaporate more water from that region which is also carried and deposited further north (or south).
If you look at the provided image, find the "Horse Latitudes." Look at the deserts in North America that coincide with this (rainfall north, primarily arid south). Now imagine shifting that line further north.
The predicted growth of the Hadley Cells with warming has already occurred (and we've barely experienced the warming we have already invoked and continue to invoke).
Hence... global warming will cause the cells to grow, which will cause the deserts to expand, and the wet regions beyond them to become more wet.
[Caveat: this is of course not the only mechanism in play. You can have a variations due to local geography, for example high mountain ranges like the Rockies, the Himalayas and the Andes which can block the flow of moisture or create arid conditions of their own simply with their altitude. But a simple look at a globe and the locations of the deserts demonstrates how dominant the effects of the Hadley Cells are in many regions of the earth.]
This hot air rises, carrying the moisture with it. Eventually it can't rise any further and spreads north and south (at high altitude). This continues as the air cools and eventually sinks.
The result is that the moisture that is evaporated at the equator is carried over the the adjacent land and deposited further north (or south).
If you look at a map of the Earth, you'll the the deserts predominantly occupy the same latitudes... those areas over which the Hadley Cells carry the moisture before depositing it.
How is this affected by global warming? The forces behind the Hadley Cells get stronger. There is more evaporation, and the air is warmed more and travels higher and farther. This means that the arid area within the Hadley Cell grows, and the area at the far edge of the cell with the rain – more of it – moves further north.
And, of course, the sun continues to strike that growing arid area, which coupled with the increased warmth serves to evaporate more water from that region which is also carried and deposited further north (or south).
If you look at the provided image, find the "Horse Latitudes." Look at the deserts in North America that coincide with this (rainfall north, primarily arid south). Now imagine shifting that line further north.
The predicted growth of the Hadley Cells with warming has already occurred (and we've barely experienced the warming we have already invoked and continue to invoke).
Hence... global warming will cause the cells to grow, which will cause the deserts to expand, and the wet regions beyond them to become more wet.
[Caveat: this is of course not the only mechanism in play. You can have a variations due to local geography, for example high mountain ranges like the Rockies, the Himalayas and the Andes which can block the flow of moisture or create arid conditions of their own simply with their altitude. But a simple look at a globe and the locations of the deserts demonstrates how dominant the effects of the Hadley Cells are in many regions of the earth.]
-
Martin at 23:32 PM on 13 January 2012U.S. 2011: The Wet Get Wetter, the Dry Get Drier
As I understand climate science, predicting precipitation is more difficult than temperature and regional forecasts are less certain than global forecasts. Predicting that wet areas in the US will get wetter and dry areas drier due to global warming should therefore be a lot more challenging than estimating the rise in global temperature by the end of this century. Could you provide an explanation why this regional forecast is reliable in more detail? The post states that "fast evaporation parches the South and prevailing winds blow the moisture-laden air northeastward". But why would global warming have this result. I could imagine that warmer temperatures would lead to more water evaporating off the Gulf of Mexico leading to more rain in the Southeast. The higher temperatures could mean more evaporation and less precipitation in the Northeast. I think this site needs to post something much more detailed on regional climate forecasting with regards to temperature, precipitation and prevailing winds, explaining how they work - without simply stating that that is what climate models predict. How reliable are they? What are their strengths and weaknesses? Cheers, Martin -
Daniel Bailey at 23:06 PM on 13 January 2012U.S. 2011: The Wet Get Wetter, the Dry Get Drier
@ Norman You continue to prosecute an agenda of "It's not happening" "It's natural variation" "there's not enough data" and to prop up the agenda you typically focus on short term events in local areas. Here's a global metric for you: Way back when I made this observation:"The last month with below-average temperature was February 1985. That makes 313 consecutive months with temperatures above the 20th Century average. Not that anyone expected that... Betcha that streak continues for some time."
We are now at 322 consecutive months...and still counting. Whodathunkit? Regime change, anyone? -
michael sweet at 23:01 PM on 13 January 2012U.S. 2011: The Wet Get Wetter, the Dry Get Drier
Norman, When you don't keep up with what everyone else knows you make incorrect assertions. Skeptical Science has already had a post about worldwide increase in extreme heat events. Please read Quantifing extreme heat events as several other people have referred you to. The data on the USA is important because many readers, like me, live in the USA. This post describes the annual report from the National Climate Data center. The NCDC has not released the worldwide data yet. Expect a post soon describing the world situation. Skeptical Science is a good web site, but they have to wait for the data to be released before they can write a post. -
skept.fr at 22:56 PM on 13 January 2012Climate and Sea Level: An Emerging Hockey Stick
#20 Agnostic : "few people believe that within 50 years we are likely to be looking at SLR in the order of 50cm/annum" In fact, I'm among the people who do not believe that. What is the source for this "likely" SLR? -
skept.fr at 22:53 PM on 13 January 2012Climate and Sea Level: An Emerging Hockey Stick
#17 scaddenp : The primary obstacle to action at the moment is misinformed denial Do you really think that? I suppose you speak of US "action", because the 193 other nation-states of our world do not really decide their economy and energy policy from Lindzen, Spencer, Michaels and other outsiders' views... -
skept.fr at 21:33 PM on 13 January 2012U.S. 2011: The Wet Get Wetter, the Dry Get Drier
#15-16 Norman : From the graph in #8 (Tom), it seems there is a trend even without sophisticated statistics. Since 1980, 20 yrs are above the mean (black line), and since 1910, I see no other period of 3 decades with such a 2/3 rate. Even 1931-1960 period (with the highest previous bars) had 12 yrs above the mean, so 1/3. -
adelady at 20:56 PM on 13 January 2012U.S. 2011: The Wet Get Wetter, the Dry Get Drier
Norman "From a look at Tom Smerling's graph post at 8 it would seem that to form any long term conclusions about 2011 would be premature." Have another look at that graph. In particular run your eye across the 20ish% 'mean' level. Now do it again looking for 'above the mean' and 'below the mean' on the red trendline. When I do this, I notice that before 1980 the line oscillates above and below. After 1980? It went up. And has never gone below the mean since. -
Spike25 at 20:53 PM on 13 January 2012U.S. 2011: The Wet Get Wetter, the Dry Get Drier
Scotland had its wettest year on record with 73.2in (1859.5mm) of rain, beating a previous record set in 1990. However, some parts of England have had very low levels of rainfall, according to the Met Office. East Anglia had its second driest year on record with 17.6in (449mm) of rain and the Midlands its third driest with 23in (586.5mm). I think the UK rainfall changes last year are broadly in line with what the models suggest for us. -
DrTsk at 20:39 PM on 13 January 2012Climate's changed before
Moon, it would be great if someone graphed the first derivative for illustration of the rate of change. Some people have really hard time with that concept. Thank you for the previous graphs. -
monkeyorchid at 19:21 PM on 13 January 2012Climate Change Denial and the Media - Banishment of Science Reality
Great article. When discussing the UK media, the leading denialist organ is the Daily Express - worse even than the Daily Mail. The Express ran the infamous headline "100 reasons why climate change is natural" at the time of the Copenhagen conference. I suspect that getting 100 falsehoods into a cover story is probably a world record for any newspaper. In Britain there is currently a far-reaching enquiry going on into the misbehaviour of the media, but sadly it isn't covering climate denialism. The more enlightened press does its best (see below), but needs go after these people with the same doggedness it went after illegal phone hacking by journalists (which triggered the enquiry). Then we might get somewhere. On the plus side, a recent Guardian article brings the influence of money on US politics into the open, including the following quote. "The Chamber of Commerce spent more money on the 2010 elections than the Republican and Democratic National Committees combined, and 94% of those dollars went to climate-change deniers. " http://www.guardian.co.uk/commentisfree/cifamerica/2012/jan/05/time-to-get-corporate-cash-out-of-congress -
Rob Painting at 16:23 PM on 13 January 2012U.S. 2011: The Wet Get Wetter, the Dry Get Drier
Extreme weather may not increase every year, but throughout the course of this century it is likely to. James Hansen's paper shows a marked increase in heat extremes in the last few decades, and the Rahmstorf & Coumou (2011) paper demonstrate the fundamental reasoning behind this. We also have Li (2011) who show that La Nina/El Nino seems to grow in intensity and frequency with warming of the background state of the Pacific Ocean. And a recent modeling study Seager (2011) showing not only will El Nino/La Nina intensify this century, but it should have started already. They maybe right. We humans are just going to have to get used to increasingly more wicked weather, and suffer the consequences. Of course, rapidly phasing out fossil fuels would stop things from becoming even worse. Just a thought. -
skywatcher at 16:18 PM on 13 January 2012U.S. 2011: The Wet Get Wetter, the Dry Get Drier
Norman, I really think you need to read the SkS article Quantifying Extreme Heat Events and the linked paper by Hansen et al. There, you will see graphically how extremes of heat are on the rise, not only in the US, but all around the globe, just as predicted. with 10% of the globe now experiencing "extremely hot" conditions compared to <1% 50 years ago. The US is merely reflecting this global pattern; indeed in recent years the US has been quite lucky to avoid most of the great extremes until the Texas drought brought 3-sigma heat to US shores. 3-sigma heat is on the rise and is now a 1-in-10 chance for any given location and rising. -
bill4344 at 14:59 PM on 13 January 2012U.S. 2011: The Wet Get Wetter, the Dry Get Drier
Norman, SkS is simply saying this is indicative both of what has been predicted for AGW conditions, and what we can expect more of in the future. But you knew that already. You might have noticed there were just a few other droughts and - particularly - floods in other areas around the globe in the course of the last year or so. Along with the wombat I can also easily imagine an 'extreme weather events have been declining since 2011' meme arising, at least until the next major El Nino or La Nina. Then the decline will reset from that date. -
muoncounter at 14:47 PM on 13 January 2012Climate's changed before
Dr T, Here's the stock version. --source
I plotted Vostok temperature anomalies along with the Moberg et al 2005 reconstruction's low frequency (LF) component, a smoothed version (LOESS) and GISS temps:
--source
I plotted Vostok temperature anomalies along with the Moberg et al 2005 reconstruction's low frequency (LF) component, a smoothed version (LOESS) and GISS temps:
 The time scale is calendar year rather than 'years BP.' So the jump up at circa 8000 BP appears at -6000 on the bottom graph. It certainly looks like 8000 years of relatively slow, small temperature variation is over. Anyone who says 'the modern warming is nothing new' clearly doesn't understand the concept of 'rate of change.'
Exit Holocene, enter Anthropocene.
The time scale is calendar year rather than 'years BP.' So the jump up at circa 8000 BP appears at -6000 on the bottom graph. It certainly looks like 8000 years of relatively slow, small temperature variation is over. Anyone who says 'the modern warming is nothing new' clearly doesn't understand the concept of 'rate of change.'
Exit Holocene, enter Anthropocene.
-
Norman at 14:39 PM on 13 January 2012U.S. 2011: The Wet Get Wetter, the Dry Get Drier
My question is why would one extreme year in an area that covers a small part of the globe mean anything or give any indication of potential change in the future? I have brought up short term changes on other threads. Here is the response. or this. SKS seems very critical of forming conclusion based upon very short times spans or relatively small areas. -
Norman at 14:26 PM on 13 January 2012U.S. 2011: The Wet Get Wetter, the Dry Get Drier
From a look at Tom Smerling's graph post at 8 it would seem that to form any long term conclusions about 2011 would be premature. There were only two year's in the 100 time span that had more than 50% of the United States in either a severe drought or too wet. And looking at the years before 2011 it certainly does not indicate any upward motion. -
skywatcher at 12:56 PM on 13 January 2012Climate and Sea Level: An Emerging Hockey Stick
#20 Agnostic - am not sure if 50cm/annum is reasonable - even in Meltwater Pulse 1A it was most likely up to ~50mm/yr, maybe a bit higher, which is quite enough to be going on with... -
DrTsk at 12:51 PM on 13 January 2012Climate's changed before
muoncounter, could you provide the above graphic in a normal scale for reference? -
stressedchef at 12:33 PM on 13 January 2012CO2 limits will make little difference
Without wanting to overcomplicate the point, I would say that: a) it's overstating things to say that CO2 limits by all countries are needed; a large number of countries emit very little due to small size, poverty or both. A suitable agreement between the top 20 emitters would cover most global emissions and most of world trade. Adding further parties is useful for reducing trade distortions and adding a bit more abatement potential, but balanced against this is the difficulty of making progress in full multilateral forums with 190+ parties. b) An agreement/set of agreements need not be through the current UN process; while this is looking healthier post-Cancun and post-Durban than just after Copenhagen, it remains a very difficult process. Other tracks can be (and to a significant extent are being) pursued as well, including unilateral national/regional policies (California, Australia, EU), bilateral agreements (Australia/Indonesia discussions for example) and smaller multilateral groupings (Major Economies Forum eg). The 'success' or 'failure' of a particular UNFCCC conference/process remains important, but it is far from the whole story.
Prev 1323 1324 1325 1326 1327 1328 1329 1330 1331 1332 1333 1334 1335 1336 1337 1338 Next


