


 Arguments


Recent Comments
Prev 1329 1330 1331 1332 1333 1334 1335 1336 1337 1338 1339 1340 1341 1342 1343 1344 Next
Comments 66801 to 66850:
-
adelady at 01:16 AM on 3 February 2012Check With Climate Scientists for Views on Climate
For anyone who thinks that the IPCC has been exaggerating the possible impacts of warming, I suggest a long hard look at this collection of graphs showing Arctic sea ice extent, area and volume. In particular, look at the fifth line of graphs. Comparing actual measurements of ice extent against a background of the modelled projections. Anyone who wants to accuse modellers of having overstated expected impacts of warming must qualify their statements or accusations with a standard rider "Well, of course, except for Arctic ice." -
victull at 01:12 AM on 3 February 2012Measurements show Earth heating up, think tanks & newspapers disagree
Kevin C @30 The issue is the real magnitude of the warming imbalance and at what equilibrium temperature it will close. CERES gives a positive imbalance but what is its magnitude? CO2 effect is logarithmic and other feedbacks have unknown trajectories. Heat loss via Stefan Boltzmann is exponential (with absolute Temperature to the fourth power). -
muoncounter at 01:11 AM on 3 February 2012Check With Climate Scientists for Views on Climate
elsa#14: "The facts that seem under debate here are whether or not there has been warming in the last 10 years or so." Debate? One side has a full record of evidence, the other side has a cherry-picked few years. One side has a trend lasting many years, the other side has 'if we connect these two points, the trend is down.' One side has measures with statistical significance, the other has 'because we say so.' That's not a debate, its an avalanche. "That is something on which it would be interesting to see some real data" Try the 'most used climate myths' on this website. There are a number of 'warming stopped in ___ ' threads. Or look at the BEST threads. All are just rife with real data. While you're at it, consider Arctic ice melt and world glacier mass loss; explain how these symptoms can possibly be happening if there's been no warming. -
Dennis at 01:05 AM on 3 February 2012Check With Climate Scientists for Views on Climate
A couple things. First, my understanding is that this letter was not "printed" but only appeared on-line. The original denier piece was actually printed. WSJ is one of the few papers left where the print version actually is widely read. Perhaps someone with access to the printed copy can verify this. Second, skept.fr @16 wrote "Op-eds in WSJ are not a scientific debate." This is 100 percent true, but we all know that the original op-ed will be endlessly quoted and cited by deniers in the coming months if not years for consumption by the general public and policy elites as "evidence." -
Bernard J. at 00:29 AM on 3 February 2012Measurements show Earth heating up, think tanks & newspapers disagree
Composer99 and Daniel Bailey. Human-caused climate change denialists are using the latest generation of the technology - the Koch-eyecrometer. It has negative resolution, but that doesn't matter... it's associated wet-wear has less computational capacity than a Commodore 64, so the requirement for discrimination has always been moot. -
Kevin C at 00:02 AM on 3 February 2012Measurements show Earth heating up, think tanks & newspapers disagree
Elsa: The reason for not just looking at temperature is that temperature is only a very crude measure of energy. The same amount of energy required to raise the temperature of the whole of the Earth's oceans by 0.1 degree, would raise the temperature of the Earth's atmosphere by 100 degrees, because the heat capacity of water is so much greater than that of air. The problem we are facing is that we have changed the earth's energy balance - more energy is coming in than going out. The size of that change is the critical factor. The energy balance at the top of the atmosphere has remained positive over the whole of the last decade, as evidenced by both the CERES satellite data and the rising total heat content of the Earth system. In other words the earth is still accumulating energy. (The commonly used term is 'warming' - if you think that term is misleading, feel free to stick to energy.) In the short term, depending on where the energy goes, it can have very different effects in terms of temperatures, but over the long term the extra energy will permeate the whole system (or worse, slosh about). So the energy is the more fundamental measure. -
oneiota at 23:55 PM on 2 February 2012Check With Climate Scientists for Views on Climate
elsa@14 A view is a perspective. The broader one's view the better the perspective. So how does one broaden the view? Read the published scientific literature...most of it is accessible if not easily understood. And if not places like this will give a "heads up" as to to what is happening with regards to our current understanding rather that what we knew 10 years ago. Reality unfolds much faster than we can grasp let alone manage. A letter to WJS from "either side" cannot begin to touch the reality of the situation. With regards to the IPCC report of 2007 I am pessimistic and skeptical. I hope to be proven wrong...after all a pessimist is never disappointed..either I was right or if I was wrong all the better. -
GreenCooling at 23:47 PM on 2 February 2012Check With Climate Scientists for Views on Climate
Chriskoz@6 Andrew Bolt's primary affiliation is with Rupert Murdoch (is that the truth or was your news limited?), and has distinguished himself as a purveyor of far right propaganda and a convicted rascist. He's very well known for these views here, yet sadly does appear on the ABC Insiders show, and with Australia's richest person, mining magnate and Monckton fan Gina Reinhart, increasing her stake in Fairfax (publishers of the Sydney Morning Herald and The Age) this week, progressive commentators are very concerned she is doing this precisely in order to have the likes of Bolt given a broader audience.... Gina also owns a big slice of channel 10 TV on which Andrew consequently hosts the "Bolt Report", but fortunately few Aussies are stupid enough to watch this and it does poorly in the ratings... Completely agree Bolt is paid to promote these views, and we should all be worried about the depth of the pockets that feed him and his ilk, but having truth on our side is needless to say a significant advantage. -
SoundOff at 23:44 PM on 2 February 20122012 SkS Weekly Digest #4
How long have you been a reader of SkS? Since September 2009. How did you become aware of its existence? Not sure but probably from a link within someone’s comment on another website, maybe at RealClimate. How many times a week do you visit the site? Daily, or sometimes more often on weekends. What issues would you like to discuss in future editions of the Weekly Digest? I spend a fair amount of my time countering anti-science arguments made by the Denialati on my national news site and occasionally elsewhere. What I look for here is concise arguments that I can use against their usual rhetoric. For example, your “Escalator” (SkepticsvRealistsv3.gif) has been immensely useful in this respect. I also appreciate your educational articles with links to peer-reviewed papers. I have invested 3000+ hours reading published climate literature and serious blogs such as this one over the past few years. I’ve also taken a physics, chemistry & climate course to help me understand this area of interest (it’s not my profession), but I still learn from SkS articles, especially those by Dana. I like the weekly “new research” article. I’ve found commenters’ links to various studies over the years very helpful too (my thx to them). -
JMykos at 23:40 PM on 2 February 2012Those who contribute the least greenhouse gases will be most impacted by climate change
Comparisons of greenhouse gas per capita plays down the total greenhouse gas emissions of a country. It allows a high population growth as long as greenhouse gas per capita reduces, even if total greenhouse gasses increase considerably. Why is the comparison per capita and not per square kilometer? A country is responsible for managing all of its square kilometers in terms of sustainable population and greenhouse emissions. I know I am talking population levels and controls, but it needs to be done sometime. In 88 years Australia is projected to have 100 million people, and even with a small carbon footprint that is still a lot of emissions. If highly populated countries lncrease the carbon footprint , the total emissions are frightening. -
skept.fr at 23:40 PM on 2 February 2012Check With Climate Scientists for Views on Climate
#14 elsa : "Without an explanation all that we get is a sort of “’tis, ‘tisn’t” argument that is not really a debate." Op-eds in WSJ are not a scientific debate. Scientific debate occurs in scientific publications and workshops. For a recent example, Dessler 2011 have answered to Spencer and Braswell 2011 and Lindzen and Choi 2011. So, you must read these papers (with replies) and conclude which is the more convincing from a scientific point of view. Same is true for all domains of the climate observation and modelization. -
elsa at 23:32 PM on 2 February 2012Measurements show Earth heating up, think tanks & newspapers disagree
I am not sure why Biophilia asks "how appalling that people still don't realize temperature is a measure of energy within a given system or defined space" but he will doubtless explain further. It is good to see that he thinks the trend line in the graph has been arrived at by a means "having, showing, or done with good judgment or sense." Presumably this means he also accepts the implication of this line, which shows a far slower rate of warming than he has probably thought had been happening until now. -
oneiota at 23:18 PM on 2 February 2012Check With Climate Scientists for Views on Climate
GreenCooling @3 Andrew Bolt and his ilk are paid to have an opinion and are not required to justify it...unlike those who are paid less than he and are required to publish theirs in a forum that demands rigour and takes no prisoners...peer review or op-ed? -
elsa at 23:18 PM on 2 February 2012Check With Climate Scientists for Views on Climate
I don't want to split hairs but what I criticised was repetition of views, not facts. The facts that seem under debate here are whether or not there has been warming in the last 10 years or so. That is something on which it would be interesting to see some real data (and I have put together some comments set out in the earlier section of this website that deals with this debate) rather than repetition of two points of view. The qualifications point I accept, although it seems to me that many of the supposed "climate scientists" do not have anything like as much in the way of qualifications as they claim. Phil Jones is one I have looked at in particular and it seems to me he has very little in the way of a proper scientific background and certainly his approach to science with regard to data sharing (the withholding of underlying data without which his work cannot be meaningfully reviewed) is most unscientific. Motives are interesting and possibly helpful but I am afraid that quite often these days it is motives, rather than the underlying arguments, that get criticised in many debates, not just ones about global warming. Whatever one's opponents motivations one needs to answer their points rather than question their motives. I would completely agree with your comment about evidence, unfortunately there is none in this letter. That is one of the reasons that I am critical of it. I am not sure why you think the IPCC may underestimate the situation. Clearly one of the signatories to this letter - whom you presumably think is properly qualified - thinks quite the opposite. -
oneiota at 22:51 PM on 2 February 2012Check With Climate Scientists for Views on Climate
Elsa, Have you considered that if the facts are "merely" repeated by those who are qualified to repeat them then maybe there is a strong chance that it is the reality? Check the qualifications and motivations of those who are sceptical. However claims can only be supported by evidence and not by letters to the editor. The really scarey bit is what if the IPCC report underestimated the situation...they may have! -
elsa at 22:23 PM on 2 February 2012Check With Climate Scientists for Views on Climate
It is sad that this letter does not really tell us anything new but merely repeats several parts of the standard IPCC type view and states things that disagree with the earlier letter without providing any explanation for how the differences of opinion come about. We are told that the long-term warming trend has not abated but what the interested outsider needs to know is why they hold this view and the earlier letter’s authors seem to hold an opposite one. Without an explanation all that we get is a sort of “’tis, ‘tisn’t” argument that is not really a debate. The piece on computer modelling is particularly bizarre. These apparently show “that during periods when there is a smaller increase of surface temperatures, warming is occurring elsewhere in the climate system, typically in the deep ocean”. Now it may well be that measurement of temperatures in the deep ocean could show such a thing, but no explanation at all is offered about how a computer model could do so. It is also sad to see some of the less doctrinaire members of the global warming community joining in on this. One of the signatories of the letter, Robert Watson, has in the past been rather critical of the IPCC overstatement of the seriousness of climate change and has stated that his side’s view should always be challenged by sceptics. What a pity that he has chosen not to rebut the sceptic’s letter in any detail at all but has joined in on the repetition of claims thus taking the rest of us no further at all. -
oneiota at 22:20 PM on 2 February 2012Check With Climate Scientists for Views on Climate
Thank you Dibble for the link to Derry's concise,informed and incisive response. -
skept.fr at 21:43 PM on 2 February 2012Climate change policy: Oil's tipping point has passed
It must be noted that Murray and King are also skeptic about the coal ultimate reserves in their Nature's paper, they emphasis that China and India are net importers, US production is peaking, geological estimates from the 80s or 90s have not been recently updated, etc. If the pessimistic estimates of total fossil reserves are correct, we will never reach during the second part of this century the carbon emission rates of IPCC RCP 8.5 (this RCP is equivalent to the old SRES most fossil intensive variations of A1-A2 families). We've add approx. 120 ppmv CO2 atm since the pre-industrial period, we're pretty sure that we can add the same quantity with "reasonable" market prices for fossil fuels, but beyond that, it's quite speculative. Price is not just determined by extraction capacity, but also supply/demand ratio and EROEI, as noted in #30. The more energy you need to extract and refine an energy source, the less you leave for its final (eg socio-economical) use. -
elsa at 21:17 PM on 2 February 2012Measurements show Earth heating up, think tanks & newspapers disagree
Paul D is right in saying that many have responded to me and I am grateful to him for a polite and reasoned reply, in contrast to one or two of the others. I would agree with him entirely that temperature must include as many places as is practical. I could not agree more that we should not cherry pick the places, yet that is exactly what is being done when we look at ice cover in the Arctic, when we know that the climate in the poles is often completely unrepresentative of what goes on elsewhere. CBDunkerson adopts a different approach. He does not answer the criticism that if you are arguing about whether the world is getting warmer you should look at temperature but instead asks if “they” are making more water out of thin air. Since he has not understood the point that I made above I will try to put it in simpler terms for him. You can only use changes in the sea level as a proxy for changes in temperature if you think that temperature is the sole factor that alters the sea level. Is that what he thinks? He does not go anywhere near the obvious question “if you have a good temperature record, why would you use some other far less reliable means of looking for warming?” Composer99 claims I am “trying to dispute the reality of human-induced rapid global overheating by reference solely to a few graphs on a website”. Actually my point here was to point out the flaws in this particular article using only the graphs provided with in it, not ones picked by me. He then says that to use your eyes to assess one of those graphs is the use of a very poor scientific instrument. However he does not answer the criticism I made of the graph using the author’s statistical analysis, which shows a much much slower rate of warming than is generally put about by the (-snip-). Is he saying that the author got this wrong and, if so, what does he think the underlying trend is for the period? KR makes a polite comment but I am not really sure what it trying to say. I have said that if you want to show that the climate is warming there is one thing that you need to do and that is look at the temperature. Ice cover and sea level can change for reasons other than a general rise in temperature and so are of little or no help in establishing whether or not global warming is taking place. DSL claims I cherry picked the figures. What I did was to look at the graph provided in the article. What is clear is that temperature in 2008 is no higher than the starting point (it is considerably lower than 1998) some 10 to 11 years earlier. But we have no need to argue about reading the graph. The (-snip-) author of the article has provided a trend line for us. I rather doubt it is meaningful but what it shows, as I have set out above, is a level of warming far below the normal (-snip-) claims. Does DSL dispute that and, if so, what does he think was the trend in the period shown by the graph? In contrast to DSL, MarkR is friendly and polite. Unfortunately I do not agree with him. If you are looking for global warming I would say the primary, probably only, thing that you need to look at is the temperature. If you had no instruments for measuring temperature you could well be justified in using another indicator. But we do have such instruments and can use them. In such circumstances it may be unhelpful or even misleading to use something such as sea level, where clearly other factors can play their part in changes. (-snip-).Response:[DB] Multiple instances of ideology/inflammatory tone snipped. Future comments constructed thusly will be simply deleted.
-
Dibble at 20:16 PM on 2 February 2012Check With Climate Scientists for Views on Climate
Another splendid comment from Louis A. Derry, assistant professor of geological sciences at Cornell University here. Thanks to link from M Mann's twitter, via (bizarrely) a certain weatherman's blog. -
Doug Hutcheson at 16:46 PM on 2 February 2012Oceans are cooling
This interesting article in Australian Geographic reports that the CSIRO has found the Tasman Sea is warming faster than most of the ocean and ascribes the cause to AGW. -
Phila at 15:02 PM on 2 February 2012The Latest Denialist Plea for Climate Change Inaction
Bob: That's fascinating! It does seem like a very similar tactic. Which makes sense, considering that the average "skeptic" is in the market for a personal identity rather than an actual understanding of science. So instead of cigarette brands, we've got a bunch of different theories tailored to individual pretensions. There are relatively sophisticated discussions of tree rings for the more educated "skeptics," and there's footage of snowbound American cities in winter for the illiterati. The product's basically the same...it's just packaged for upscale and downscale markets. What a way to earn a living. -
owl905 at 14:47 PM on 2 February 2012Check With Climate Scientists for Views on Climate
Every once in a while, something comes along that gets the batteries, depleted by frustration and setback, a recharge. This made warm winter day a little easier on the nerves. Thumbs up to the Wall Street Journal for printing it. Maybe some of their constituency in harms way with this pollution can get some attention. I'd go and check up, but the last round of comments there pushed Vogon poetry into fourth place. -
actually thoughtful at 14:09 PM on 2 February 2012Check With Climate Scientists for Views on Climate
Will this "letter" from the experts get equal billing to the shrill denial of the opinion/editorial? Or will it be put down in the letters from mere mortals section? -
MattJ at 13:39 PM on 2 February 2012Climate change policy: Oil's tipping point has passed
@J. Bob, #36: True, but not helpful. Fracking is already under much-deserved harsh criticism for causing earthquakes and poisoning ground water. These are not the products of overactive imaginations of environmentalist, they are real and unacceptable externalities. If the externalities were truly taken into account, the oil from fracking would be considered unacceptably high priced. Also, oil industry apologists have a bad reputation for inflating their estimates of how much oil they can get for how long out of any new reserve or technology. Why would fracking be any exception? I doubt it will be. Finally, storage mechanisms are getting better. We are nowhere near the thermodynamic limits of storage efficiency with today's technologies, a decent new "smart grid" will open up possibilities for much more efficient technologies at much lower costs. -
MattJ at 13:33 PM on 2 February 2012Climate change policy: Oil's tipping point has passed
The authors say, plausibly: "the point needs to be lodged more firmly in the minds of policy makers." But there is an important point they still don't get: it has to start with the voters, since the policy makers are too beholden to monied interests to make such a decision without strong voter support. So first, it is the voters who need to get the point " lodged more firmly in their minds" -
Tom Curtis at 13:13 PM on 2 February 2012Check With Climate Scientists for Views on Climate
Simon Donner, one of the signatories of the above letter, has further commented on the issue here. -
Bob Loblaw at 13:11 PM on 2 February 2012The Latest Denialist Plea for Climate Change Inaction
Phila @ 29:In articles like these, it's not just acceptable but also beneficial to present a mishmash of contradictory arguments; the more excuses for disbelief you can provide, the more readers you can reassure. Different claims appeal to different readers, so toss 'em all in! It's not like they're gonna compare notes.
Reading this reminds me of something my high school economics teacher said about cigarette brands and marketing. The question was, why do cigarette companies have so many brands? Aren't they competing with themselves? The answer is yes, but the marketing strategy was that many cigarette smokers change brands fairly frequently. If they change brands at random, and you have 20 brands and your competitor has 10, then you have twice the likelihood of having the switched smoker pick up another of your brands. Brand loyalty is a good thing, but this strategy helps keep the non-loyal smoker in the fold, so to speak. Bring that strategy forward 40 years, and the deniers are aided by having a huge stock of talking points (since it doesn't matter if they are incorrect and mutually contradictory), while the poor scientists (bounded by reality) have relatively few. For the mind that wants to glom onto a few points that confirm their bias, they are more likely to glom onto one of the many false denier memes. -
chriskoz at 13:07 PM on 2 February 2012Check With Climate Scientists for Views on Climate
GreenCooling @3, I don't know whom this Andrew Bolt fellow is affiliated with. But I did find cases of racial discrimination, e.g. here which undermine his quality as journalist and his integrity. Skimming through the claptrap you're pointing at, confirmed my opinion about Andrew. It suffice to quote him as saying "Arctic ice has not retreated since 2007" which is the old monckton myth disproved last year and abandoned by Monckton himself. But Andrew is still clinging to it on February 01, 2012: unbelievable, a rare case of 100% head in sand! What world is Andrew living on? I found that OZ media that are part of Murdoch empire (like Daily Telegraph tabloid we are talking about here) tend to provide a workplace for individuals such as Andrew Bolt. Other media, i.e. smh.com.au or abc.net.au do not. I read/watch the latter regularly and I am confident such incoherent rambling would not be published there. -
From Peru at 12:58 PM on 2 February 2012Climate change policy: Oil's tipping point has passed
Oil production since 1970: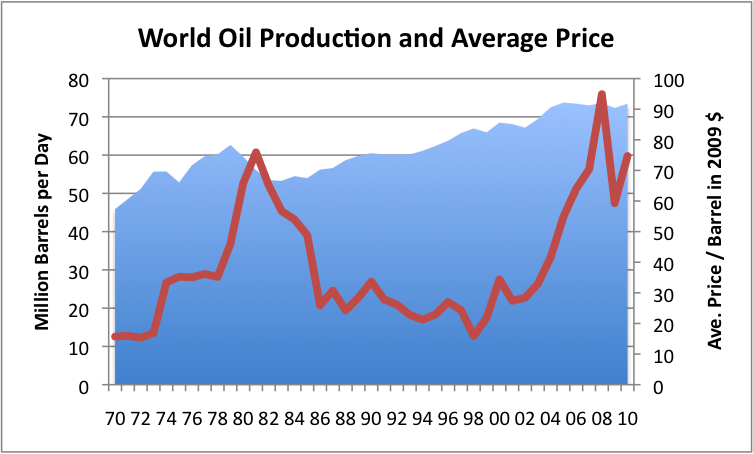 [source]
Last time production dropped was after the Iranian Revolution and the following Iran-Iraq War.
[source]
Last time production dropped was after the Iranian Revolution and the following Iran-Iraq War.
-
John Hartz at 12:51 PM on 2 February 2012Check With Climate Scientists for Views on Climate
Talk about serendipity! Suggested reading: “Climate scientists not cowed by relentless climate change deniers” by Tony Feder, page 22 of Physics Today, Feb, 2012 To access this timely, in-depth article, click here. -
NewYorkJ at 12:49 PM on 2 February 2012Check With Climate Scientists for Views on Climate
Good letter, but it would be nice if they had extensive references in their discussion, or at least links to them. I understand "skeptics" couldn't care less about supporting their statements, and in their case they're better off without them, but scientists should do better. Is there a WSJ restriction, related to a restriction in the print version? -
scaddenp at 12:25 PM on 2 February 2012Climate change policy: Oil's tipping point has passed
Hmm, except that tell story of how many new coal plants are coming on line. Coal is fastest growing fuel worldwide. -
GreenCooling at 12:23 PM on 2 February 2012Check With Climate Scientists for Views on Climate
It is indeed a remarkable thing that that the WSJ is prepared to publish this letter, and congratulations to all signatories. I just wish the Australian Daily Telegraph and Herald Sun would give Tim Flannery, Ove Hoegh-Guldberg, Naomi Oreskes and David Marr a similar right of reply to the highly offensive and arguably defamatory claptrap published yesterday by Andrew Bolt. The denier campaign is alive and well here and will only grow louder as the introduction of carbon pricing on 1 July approaches. The efforts and contributions of SkS will play a vital role in this debate, and I'd like to offer my most profound and sincere thanks for all that you do. -
Chappo at 12:22 PM on 2 February 2012Measurements show Earth heating up, think tanks & newspapers disagree
Nice article. -
muoncounter at 12:15 PM on 2 February 2012Check With Climate Scientists for Views on Climate
It would be nice to see how many other actual climate scientists could be interested to add their names to a virtual version of this letter. Perhaps hosted here? -
John Hartz at 11:50 AM on 2 February 2012Check With Climate Scientists for Views on Climate
Kudos to all of the scientists who signed this letter! -
Pete Dunkelberg at 11:22 AM on 2 February 2012Climate change policy: Oil's tipping point has passed
scaddenp, coal is losing ground too. -
Chris Snow at 07:40 AM on 2 February 2012The Latest Denialist Plea for Climate Change Inaction
I’m not surprised that it’s a small and dwindling number of fake skeptics – if the demographics are anything to go by, they must be dying off. I went through the biographical details as best as I was able to and as far as I can tell, Shaviv is the only one under 60. Are there any psychological studies to show why males of retirement age and beyond find it so hard to accept AGW? This is one reason why I think that climate change skepticism still has a few years run, but in the end it will just die of natural causes. As Max Planck said, “Science advances one funeral at a time.” -
scaddenp at 07:12 AM on 2 February 2012Climate change policy: Oil's tipping point has passed
If the only coal mined was for steel production, then I would doubt it would present much of a threat to climate. Mostly coal is used for fuel. The rising price of coking coal should also surely spur more recycling and substitution. You can use charcoal as a reducing agent but not with current furnace design. you need the coke to be strong enough to support the weight of material above and retain gas flow. The big threat that I can see is that rising oil prices will lead to a shift to coal-powered (via electricity) cars instead with significantly higher emissions. I'm with Hansen - we need a ban on new coal-powered stations and let market force sort out a better energy system. -
dana1981 at 07:08 AM on 2 February 2012Measurements show Earth heating up, think tanks & newspapers disagree
Most IPCC scenarios project an acceleration in global warming because unless we take action to prevent it, GHG emissions are expected to accelerate (and aerosol emissions expected to decline). It's very simple, if you want to stay in the IPCC 'low' scenarios, CO2 emissions must be cut in comparison to business as usual. Because right now, the IPCC projections are running almost spot-on, so there's no reason to doubt that global warming will accelerate if we continue with business as usual. -
John Hartz at 06:44 AM on 2 February 2012Climate change policy: Oil's tipping point has passed
Twenty-two high level representatives have just released their report – Resilient People, Resilient Planet: A Future Worth Choosing - which sets out specific recommendations to “put sustainable development into practice and to mainstream it into economic policy as quickly as possible.” The report reinforces the push to phase-out inefficient fossil fuel subsidies, speed up the deployment of renewable energy, and accelerate energy efficiency efforts. When world leaders meet several times this year – culminating at the Earth Summit 2012 in Rio – they must finally follow through on the commitment to phase-down these subsidies and help unleash even greater low-carbon energy action. Source: “UN panel urges phase-out of fossil fuel subsidies” by Jake Schmidt, The energy Collective, Jan 31, 2012 -
John Hartz at 06:33 AM on 2 February 2012Climate change policy: Oil's tipping point has passed
Suggested reading: “Scrapping fossil-fuel subsidies would get us halfway there on climate change” by Brad Plumer, Ezra Klein’s Wonkblog, Washington Post, Jan 20, 2012 Click here to access this timely and thought-provoking article. -
Eyal Morag at 06:26 AM on 2 February 20122011 Hottest La Niña Year on Record, 11th-Hottest Overall
Simple "back of the envelope calculation" give 2011 as the ~ 2nd warmest year. 1 I made correction only for ENSO using Multivariate ENSO Index (MEI) 2 With Excel I got the best fit linear to 1990-2011 yearly ( GISS ) 3 year tamp' - the correction from the line 4 Average MEI for 14 months Nov Dec Jan-Dec. Because it take some months to the ENSO to spread its influence. 5 Plot a graph Average MEI to the result from 3 6 Take out 4 years 3 after Pinatubo + 1 that looks of line 7 With Excel I got the best fit [PEARSON=0.88] 8 Use the slope* Average MEI to correct the themp 9 plot the result . Red , original blue, top red the same little up for clarity , yellow Average MEI All the data + calculations at this spreadsheet
-
scaddenp at 06:22 AM on 2 February 2012The Latest Denialist Plea for Climate Change Inaction
Adam, CAGW is a very poorly defined term. If you mean, "climate sensitivity is lower than current IPCC predictions", then please present some science to support that. (and in an appropriate thread). If you mean, "wont personally effect me, so I dont care" then dont expect respect. Since you seem to be against any legislation that would mitigate emissions, perhaps then you could take the hypothetical challenge here to assure us that your skepticism is based on informed evaluation of the science and not simply ideology-driven. -
funglestrumpet at 05:54 AM on 2 February 2012Climate change policy: Oil's tipping point has passed
It is amazing just how many comments show surprise at this issue. Peak Oil has been around as a topic in the public domain for years. I think I first read about it some 15 years ago at least. While it is quite possible that alternatives can substitute for fossil fuels, it is going to take years to convert the current infrastructure. For instance it has to be remembered that there are a lot of people who might love to have a new electric car, but will have to make do with their old fossil fuel banger until it eventually collapses and even then second hand electric cars might still be too expensive. Peak oil might be a very good thing as far as climate change is concerned as it is generally agreed that post peak oil means very limited growth at best and probably economic decline will be more the order of the day. This will obviously lead to reduced production and thus reduced emissions. It won't be a particularly nice experience and could easily lead to many countries going into depression with the attendant danger of public unrest. I recommend Oil, Smoke and Mirrors (Full length) on YouTube (beware the credits roll while there is still half of it left to watch). -
Esop at 05:28 AM on 2 February 2012Measurements show Earth heating up, think tanks & newspapers disagree
A large portion of the "missing" heat is kicking around in the Arctic, as evidenced by the extremely rapid loss of Arctic sea ice volume. Conveniently for the deniers, large portions of the Arctic are still being ignored by the datasets. Over the past few years, we have seen cold Arctic air spill onto the continents where its effect on temperature is being measured. However, at the same time there is warm air going the opposite direction, to where its effect on the temperature is not being measured. The result is a cool bias in the global average temperature measurements. Most visible in the HadCRUT data. -
Paul D at 05:22 AM on 2 February 2012Measurements show Earth heating up, think tanks & newspapers disagree
I think many have responded to elsa. But an obvious point is that temperature is a measurement of energy, as has been pointed out, measuring it in one place may not account for all the energy, which is why cherry picking is so, so wrong. An example analogy. You have a machine that has to locations that produce heat (it may have a transformer in one location and a motor in another), if you only measure the temperature at the motor, then you will not account for the total heat losses of the machine which must include the transformer and other components. Elsa stated "If we are looking for evidence of temperature changes then surely it is temperature that we should look at." But the point Mark has made is that the 'temperature' measurements must include as many places as is practical to assess where energy is going or leaving. -
Biophilia at 04:46 AM on 2 February 2012Measurements show Earth heating up, think tanks & newspapers disagree
@elsa, How appalling that people still don't realize temperature is a measure of energy within a given system or defined space. "Temperature is a physical property of matter that quantitatively expresses the common notions of hot and cold." Also, if you're going to insult scientists, I wouldn't recommend accusing them of "judicious use of maths" Judicious: Having, showing, or done with good judgment or sense. -
chudiburg at 04:22 AM on 2 February 2012It's cooling
Climate Change Theory...There is an evident 1000 year cycle in glacial advance and retreat in the data from several locations around the world. This data also shows a net positive trend in glacial mass (two steps forward and one step back sort-of)over the last 8000 years or so. However, most of the 8000 years worth of slow glacial advance that has occurred has been erased in just a few decades. Something (aka anthropogenic CO2) is working against the natural forcing and winning. It appears that your 1000 year cycle has been supercharged. I would post charts and links, but I am not sure how to do this with my limited computer skills.
Prev 1329 1330 1331 1332 1333 1334 1335 1336 1337 1338 1339 1340 1341 1342 1343 1344 Next


