


 Arguments


Recent Comments
Prev 1332 1333 1334 1335 1336 1337 1338 1339 1340 1341 1342 1343 1344 1345 1346 1347 Next
Comments 66951 to 67000:
-
chek at 21:20 PM on 31 January 2012Bilal Bomani, Cutting Edge Biofuels from NASA
It often gets depressing that most articles on most climate science blogs tend to be about countering denialist drivel. This article however is the polar opposite and actively raises hopes for the future that talented people are addressing the multiple problems we face with innovative research leading to practical solutions. Thanks Dr. Bomani for brightening my week. -
JMykos at 19:13 PM on 31 January 2012The Latest Denialist Plea for Climate Change Inaction
It's fairly obvious that many global warming deniers should know better. There is only one conclusion. They are being paid off or have special interests. Would love to be able to rummage through their bank accounts. That would be real transparency. Another csuse for the Wall St occupiers? -
Fran Barlow2 at 17:12 PM on 31 January 2012Public talk: Global Warming - The Full Picture
Interesting point re carbon being in CO2 and CH4. If I'd thought of that, I would've mentioned it :-)
I've lost track of the number of times I've wandered away from a conversation or presentation and thought of something I should have said. ;-) I might have added that even CO, which is not a GHG, does indirectly force climate change, through its interaction with CH4 and Ozone via the scavenging of the hydroxyl radical. Eventually, it oxidises to CO2. There are also some other less well known carbon-based GHGs (eg CFCm, HCFC, CF4, C2F6; More broadly though, the precise nomenclature of GHG-abatement CO2e with the "e" standing for "equivalent". So even non-carbon-based anthropogenic GHGs (such as Ozone, N2O, NF3) are expressed in terms of "carbon" equivalent. In some ways, the objection is a little like someone who claims that the tomato is not a fruit but a vegetable. From a botanical point of view, the tomato is the fruiting part of the tomato plant, but from a culinary point of view, it is a vegetable. So too, "carbon" here doesn't refer simply to the fact that most of the drivers of anthropogenic warming are carbon-based, but that carbon equivalents is the measure used by policy for reconciling these matters. -
New research from last week 4/2012
Thank you, Ari - this is a fantastic resource. Look - squirrel! Now if I could just somehow generate more time to read all the papers... -
Doug Hutcheson at 15:35 PM on 31 January 2012Ice isn't melting
Got it now. Moderators, the problem is the source for the second Lindzen myth, which points to: http://www.skepticalscience.com/redirect.php?u=http://www.2gb.com/index2.php?option=com_newsmanager&task=view&id=8613 As Trent1492 says, it comes up with "Media Player You are not authorized to view this resource." I am running Linux/Firefox 9.0.1, if that makes any difference. Looks as though the resource has been secured, or moved IMHO. -
sauerj at 14:37 PM on 31 January 20122012 SkS Weekly Digest #4
Issue of the week (2012-01-30): 1) Member for 1month ... Amazing site. Great articles! Emphasis on clear/critical thinking so refreshing; fair to all; extremely professional/civil commentaries compared to typical internet. Before, I was very frustrated, groping for positive civility; this site is a gold mine! I'm still extremely frustrated with our public attitudes, so just knowing this site actually exists gives me some newfound hope. 2) (like @1) found via happen-stance google search this last New Year's weekend (2012); also like @1 mistook the name for a denier's blog. 3) Read daily, no doubt! Look forward to every article! 4) Desired articles: 4a) I really like @1's tipping point suggestion. This moves toward putting deniers in a corner and seeing if they are so deluded to actually annihilate their own future children. The next hurdle is getting deniers to believe these tipping-point dates. 4b) Zoom in on the Vermeer, 2009 Figure 6 chart between years 1990-2040; show grid lines. Determine what year (looks like it would be somewhere between 2020 - 2030) when the Vermeer model (Eq#2, which accounts for ice sheet degradation) separates enough away from the thermal-expansion-only projections (roughly the linear extrapolation of the past data, i.e. the red line) to clearly demonstrate that with 95% confidence that the 75cm model projection in 2100 (least offensive boundary limit) will in fact really occur or be exceeded. When this year comes (say its 2025), and sea level is in fact at or above this level, then the demonstrated sustained success of the model (thereby promoting it to high confidence, 95%, of projecting future levels) might actually sway some real public opinion and force some real non-greenwash political change (though I know I'm being optimistically naïve by this last statement). 4c) Recommendations on best AGW 101 educational video. John Overpeck's video is best I've found so far, but he mishap's on one point (putting the avg temp rise for the whole globe in the same apples-to-apples comparison plane with the 2x temp rise for the higher northern latitudes) and, in addition, I'm looking for something a lot more polished. I want a 60min video that 1) succinctly explains the science (with top-notch computer graphics) and with 100% accuracy and exactness so to shutdown any denialist fodder, 2) dispels the major denial myths, and 3) projects future climate consequences if we follow BAU. Are there any such videos out there? 4d) Like to see articles that dig into understanding public opinion so to determine what it is really going to take to move people and ultimately society from 1) Denial, to 2) Apathy, to 3) Willing to listen (mildly interested), to 4) Interested in learning, to 5) Versed on the subject, to 6) Vocal activist. I work as a chemical engineer at a corn wetmilling company in Indiana. The sad reality in my local world is that 25% of the people are vocal deniers, 60% are apathetic about it, 10% are mildly interested, 4% are interested in learning and maybe 1% is versed on the subject (these being my educated guesses). And, those that might be sustained vocal activists, in technical position, would, no doubt, be quickly shown the door. Even the timid 'versed' are quickly ridiculed and put in their place if they dare say anything that marginally leans toward AGW. The published 50-60% of the people believe in AGW is certainly from a completely different planet. I'm very serious when I say that I think the 50-60% figure (for people who really fit in categories #4-#6 above) is completely delusional. For a poll that would ask the RIGHT questions, I'd put this figure at 5% (not 50-60%). The ONLY way something real (other than greenwashing) is going to happen is for >25% of the US population to feel some REAL SUSTAINED PAIN or be bowled-over by some biblical event that they witness with their own eyes & therefore come to stark realization what is in store for them in the future. Sadly, I predict that this sort of radical event(s) and subsequent transformation won't happen until 2035-2040 (requiring two more solar cycles and two more presidential cycles: Dem4yrs / Rep8yrs / Dem8yrs / Rep8yrs). Only then will enough real accumulated mass US pain reach its own tipping point, or else the scales will finally start to come off our eyes as we look upon biblically-scaled global events. Even then, like the Civil Rights movement, it will still take unprecedented marches and hunger strikes before finally the lies and greenwashing really stop, and people, governments & corporations fundamentally accept that they ALL have to change. To this end, I'd like to see an in-depth sociological study on this phenomenon titled something like "What is it really going to take before the US public really changes concerning AGW?" played out in various optional scenarios. Not only would this be an extremely interesting read, but it would help give some light to those of us who are so frustrated by the slow-death that is playing out before us. -
pbjamm at 14:22 PM on 31 January 2012The Latest Denialist Plea for Climate Change Inaction
@Dana69 was an obvious troll comment meant to distract from the subject at hand. It has no merit at all since the SkS 'staff' is is in the business of presenting and explaining what the research of expert scientists says, not doing research themselves. The WSJ op-ed was a just 16 ill-informed non-experts saying "nuh-uh" to the scientists and for some reason being given space in a major news paper to say it. -
JoeTheScientist at 14:13 PM on 31 January 20122011 Hottest La Niña Year on Record, 11th-Hottest Overall
Thanks Tom C@15. I was trying to find that, without success. -
owl905 at 13:55 PM on 31 January 2012The Latest Denialist Plea for Climate Change Inaction
@Dana69 - None of those names who hold up ever over-reached themselves to phony up a joint statement published in the Wall Street Journal. Your comparison of the two groups is a disgrace. You owe each of them an apology for the implication that any of them misled or misrepresented their credentials the way the '16 scientists' did in the WSJ. It comes across like the little child going "Well, he did it too." -
pbjamm at 13:46 PM on 31 January 2012It hasn't warmed since 1998
Tom Curtis@166 Saturday Morning Breakfast Cereal is my favorite web comic. Lots of sciencey comedy. -
Tom Curtis at 13:26 PM on 31 January 2012It hasn't warmed since 1998
SirNubWub @162, if you are going to show they article as an example of poor journalism, you should highlight the following poor journalistic practices: 1) Failure to report the consensus scientific opinion. In journalism, assuming the truth of political far from consensus opinions, such as, for example, those held by the communist party, is considered bad journalistic practice. In science this attitude is well and truly justified in that theories reach consensus support based on overwhelming empirical success relative to other candidate theories. 2) False balance. In journalism, balance is assumed to require giving equal voice to opposing political opinions, but only opinions held within mainstream political parties are sort out. This can be justified on the basis that balance should be proportionate to the relative support of the opinions. In science, however, the relative support must be the relative support among scientists expert in the field. "Balance", therefore would require reporting of opinions in proportion to their relative support (in this case) among climate scientists. 3) Failure to report a balance of veiws at all. Indeed, rather than simply falsely balancing scientific opinions, the paper reports the views of five climate change deniers, but fails to report the views of mainstream climate scientists (even though we now know that they were provided by the Met Office). 4) Failure to report the provenance of opinions reported. The climate change deniers whose opinions where sort where not identified as climate change deniers in the article. By doing so the author has taken away from the reader the right of judging the trustworthiness of his sources by depriving them of obviously relevant information. 5) Cherry Picking of Data Obviously. You could also point out that Rose has a track record of writing propaganda in preference to pursuing journalism, as reported by George Monbiot and Tim Lambert. Tim Lambert shows a cartoon that adequately encapsulates Roses' approach to science reporting:
-
Trent1492 at 13:22 PM on 31 January 2012Ice isn't melting
Correction! I meant to say the broken link is in the climate myth column second myth in the column about Arctic Sea Ice. Sorry about that. -
Trent1492 at 13:20 PM on 31 January 2012Ice isn't melting
Hello Doug, The broken link is in the What the Science Says column, second response to Lindzen's assertions regarding Arctic Sea Ice. -
John Hartz at 12:50 PM on 31 January 2012The Latest Denialist Plea for Climate Change Inaction
Another absurd statement in the WSJ letter is thoroughly dissected by Chris Mooney in his DeSmog blog post, “In Which Climate ‘Skeptics’ Drop the Lysenko Bomb. No, I’m Not Kidding….” Click here to access this article. -
tonydunc at 12:38 PM on 31 January 20122012 SkS Weekly Digest #4
Around 2 years. Since before climategate 1 broke. Think I just found it noodling around. maybe form Realclimate. maybe from Real Science - Steve Goddard's blog. I Look at the site at least whenever something is posted on it. Often when mentioned in other blogs. Does listening to John on "the Climate SHow" podcast count? What I would like to see discussed is how to mobilize more people to engage in analysis of as many skeptic articles on various blogs as possible. I read many, and while I have a foundation in principles of physics and vaguely chemistry, many arguments (outside things like logical inconsistency) are over my head. There are enough people interested in the reality to work on cataloguing and getting expert help on the validity of the facts used by skeptics. Sometimes SKs posts numerous skeptic articles that are never dealt with, and there are literally dozens of denier sites spouting "proofs" of the demise of ACC. -
Trent1492 at 11:05 AM on 31 January 201210 Indicators of a Human Fingerprint on Climate Change
Got a question. Can some one point to me a peer reviewed publication/s that gives the exact percentage of atmospheric CO2 is from anthropogenic sources? What I would most like is a paper that spelled it out in percent. I have always understood this to be about 39% from looking at the Keeling Curve but I need a source for the exact number. Thank You. -
Doug Hutcheson at 10:56 AM on 31 January 2012Ice isn't melting
Trent1492@3 Can you be more specific? The page you link to has a large number of links to other resources. Can you help identify the specific link you are having trouble with? -
muoncounter at 08:40 AM on 31 January 2012The Latest Denialist Plea for Climate Change Inaction
CoalGeol#18/David Lewis#19: Look at who owns the WSJ (one R. Murdoch). Criminal? likely. Prosecutable? Not hardly. -
John Hartz at 08:24 AM on 31 January 2012New temperature record for the Arctic in 2011
Recommended reading: “Climate Change in Arctic could Trigger Domino Effect Around the World,” International Business Times, Jan 30, 2011 Click here to access. This in-depth article is based on a recently published paper by Professor Carlos Duarte, a leading scientist from The University of Western Australia. -
John Hartz at 07:59 AM on 31 January 2012The Latest Denialist Plea for Climate Change Inaction
Pete @20: I forgot to menation that Pat Michaels is also a weekly op-ed contributor at Forbes. BTW, I greatly admire Peter Gleick for playing the role of Daniel in the lion's den at Forbes. He posts there on a weekly basis as well. -
Pete Dunkelberg at 07:58 AM on 31 January 2012The Latest Denialist Plea for Climate Change Inaction
Agreeing with Coal Geologist @ 18 Yes, these aren't just some poor mixed up boys on the street. The WSJ/Exxon 16 are grownup men well familiar with the scientific research and publishing process. Unlike street level deniers the 16 know that if they had something scientific to say they could and quickly would say it in a peer reviewed journal. They do what they do instead because it's all they have. -
Pete Dunkelberg at 07:46 AM on 31 January 2012The Latest Denialist Plea for Climate Change Inaction
Yes I know Forbes is not all sugar and spice, but calling out the Journal by name is still a noteworthy dog bite dog story. ;) Re "...a large and growing number of distinguished scientists...." are /are becoming deniers - Claiming growing numbers (especially when false) is a well know tactic of creationism. Exxon/WSJ only got 16 "distinguished" (but don't ask how) signatories and it took bottom feeding plus a lot of Exxon dependence to get that many. The supporting argument that 1 (one) old physicist resigned from the API to show off his denial is an own goal. -
David Lewis at 07:44 AM on 31 January 2012The Latest Denialist Plea for Climate Change Inaction
I think Naomi Oreskes is on the right track when she talks about the criminal convictions that resulted in the past when people used the tactics the Wall Street Journal is using. She reiterated her point when she was interviewed on NPR recently. http://www.npr.org/2012/01/24/145732719/op-ed-the-verdict-is-in-on-climate-change She said: " ...the American tobacco industry was in fact found guilty by the U.S. Department of Justice, charged under the RICO statute with criminal conspiracy to defraud the American people. And one of the things we were able to show in the book [ Merchants of Doubt ] is that some of the exact same people, not just the same tactics, but actually the same individuals who had worked in the tobacco industry and developed the strategy, for which they were convicted of criminal conspiracy by the U.S. Department of Justice, those same people have been involved in some of the attempts to undermine and challenge the scientific evidence of human-caused climate change". Hansen used to say he expected to be called to testify at the trials, for crimes against humanity, of some of the CEOs of the fossil fuel companies, over the long standing campaign they have conducted to confuse the public about what is known about climate change. I'd add: and some publishers and editors. -
CoalGeologist at 07:19 AM on 31 January 2012The Latest Denialist Plea for Climate Change Inaction
I started compiling a line-by-line annotation of The Wall Street Journal op/ed , but quickly became weary of the task, as virtually every sentence contained one or more distortion of reality, beginning with the sanctimonious headline "No Need to Panic...", which characterizes their opponents as irrational and hysterical. If the signees of this letter have legitimate criticisms of AGW, then: a) Why do they not pursue these criticisms through legitimate avenues of scientific discourse, rather than in a politically and ideologically biased source such as The Wall Street Journal? and b) Why do they employ fallacies, misrepresentations, and distortions to support their position, rather than defensible, factual evidence. The answer to both of these questions is the same: This is their only option. -
EliRabett at 07:16 AM on 31 January 2012The Latest Denialist Plea for Climate Change Inaction
Technically Virginia Polytechnic Institute and State University, but otherwise known as Virginia Tech -
funglestrumpet at 06:40 AM on 31 January 20122012 SkS Weekly Digest #4
Issue of the week 1 About 18 months since I began 2 Just happened on it while trying to improve my knowledge of the subject. (Almost didn't bother because I thought it was a sceptical site - the term 'fake sceptic' being unknown to me at the time.) 3 Daily while dealing with my post 4 Issues I would like to see: Tipping points with months to go before we pass them, or months since we passed them and what is their importance i.e. implications of ignoring them. -
michael sweet at 06:14 AM on 31 January 2012New temperature record for the Arctic in 2011
Peter, The reduced albiedo of the water is another issue that contributes to Arctic amplification. Scientists are aware of the albeido change and it is considered in climate models. (I think the models have some trouble with this effect since they underestimate ice and snow loss). Keep reading and after a while it starts to fit together. Of course once all the Arctic ice is gone all that energy goes into the permafrost and Greenland. -
WheelsOC at 05:56 AM on 31 January 2012David Archibald Exaggerates the Solar Influence on Future Climate Change
@ferox Their misinformation is certainly despicable, irresponsible, and dangerous. I'm not sure I'd say they're committing "crimes against humanity," but it's definitely an affront to honesty, definitely destroys their credibility, and it's a shame that anybody listens to them at this point. I came across the Daily Mail post yesterday and immediately went to Woodfortrees to see just how much of a cherry pick 1997 was. As I suspected, you can extend the record back by a single year and the trend is dramatically different. The same is true for any of the previous five years. 1997 is the absolute earliest year in which you can get an almost-flat trend line. It's hard to avoid concluding that Rose knew exactly what he was doing. It's possible he saw that 1997 and 2011 were almost identical and didn't think any further than this, but "he didn't think much before writing a story about it" is not exactly an excuse. -
CBDunkerson at 05:55 AM on 31 January 2012David Archibald Exaggerates the Solar Influence on Future Climate Change
DaneelOlivaw, yeah... but the people doing it 40 years ago had reasonable basis for thinking so. Heck, if deniers were to take that 40 year old science and present it today as evidence of imminent cooling... despite being long since disproven it'd still be a better case than the one they are actually presenting. -
dana1981 at 05:51 AM on 31 January 2012The Latest Denialist Plea for Climate Change Inaction
I also added the quote provided by grypo from Revkin's Nordhaus interview to the OP. -
dana1981 at 05:47 AM on 31 January 2012The Latest Denialist Plea for Climate Change Inaction
grypo @14 - thanks, that confirms my comment in the post that Nordhaus"would likely not appreciate his name being invoked to justify foolish calls for climate inaction."
-
DaneelOlivaw at 05:33 AM on 31 January 2012David Archibald Exaggerates the Solar Influence on Future Climate Change
It just occurred to me. The fake skeptics often claim that in the 70s scientists were predicting an ice age... but now THEY are the ones predicting global cooling. -
grypo at 05:28 AM on 31 January 2012The Latest Denialist Plea for Climate Change Inaction
****** As an important add-on to this post, Revkin has emailed Nordhaus to get his take on how the "scientists" (mis)represented his work. What the 'scientists' said:A recent study of a wide variety of policy options by Yale economist William Nordhaus showed that nearly the highest benefit-to-cost ratio is achieved for a policy that allows 50 more years of economic growth unimpeded by greenhouse gas controls. This would be especially beneficial to the less-developed parts of the world that would like to share some of the same advantages of material well-being, health and life expectancy that the fully developed parts of the world enjoy now. Many other policy responses would have a negative return on investment. And it is likely that more CO2 and the modest warming that may come with it will be an overall benefit to the planet.
Nordhous' response:The piece completely misrepresented my work. My work has long taken the view that policies to slow global warming would have net economic benefits, in the trillion of dollars of present value. This is true going back to work in the early 1990s (MIT Press, Yale Press, Science, PNAS, among others). I have advocated a carbon tax for many years as the best way to attack the issue. I can only assume they either completely ignorant of the economics on the issue or are willfully misstating my findings.
-
Trent1492 at 05:24 AM on 31 January 2012Ice isn't melting
In your Lindzen Illusions that deals the Arctic Sea Ice with you quote Lindzen and give a source but when I click on the link to the Lindzen quote I receive the following message:Media Player You are not authorized to view this resource.
-
John Hartz at 05:15 AM on 31 January 2012The Latest Denialist Plea for Climate Change Inaction
Pete@10: As to be expected, the comment thread to Gleick's op-ed, "Remarkable Editorial Bias on Climate Science at the Wall Street Journal" posted on Forbes, Jan 27, 2012, has drawn climate denier drones like flies to honey. They consider Forbes to be their sandbox. Also, before anyone gets too enamored with Forbes, you need to know that professional climate deniers like James Taylor of the Heritage Institute, are also regular contributors. In addition, Forbes staff writers take their cues from the likes of Taylor. Click here to access Gleick’s op-ed. -
SirNubwub at 05:02 AM on 31 January 2012It hasn't warmed since 1998
OK...I found a response from the Met office. They say its lousy journalism. http://metofficenews.wordpress.com/2012/01/29/met-office-in-the-media-29-january-2012/ I will be moving on now to other things in life. -
JMurphy at 04:56 AM on 31 January 2012It hasn't warmed since 1998
With regard to press releases, etc., this is the original Met Office Press Release (supposedly sneaked out, according to Rose of the Mail), about the paper in question (which was also sneakily referred to here by the Met. The abstract of the paper itself is available here. No doubt Rose would reckon that was sneakily published too. The Met Office's correction to the Mail is available here. Shame not too many Mail readers will get to see it, though... -
jmsully at 04:45 AM on 31 January 2012The Latest Denialist Plea for Climate Change Inaction
Regarding Allegre, Eli is reporting on an unfolding scandal involving him... -
Albatross at 04:45 AM on 31 January 2012It hasn't warmed since 1998
Hi SirNub, The Met Office's reply can be found here. -
dana1981 at 04:27 AM on 31 January 2012The Latest Denialist Plea for Climate Change Inaction
Pete @10 - yes, an excellent piece by Gleick. Forbes mostly publishes utter garbage when it comes to the climate, but they also publish good articles from Gleick, presumably so they can maintain the semblace of "balance". -
Pete Dunkelberg at 04:24 AM on 31 January 2012The Latest Denialist Plea for Climate Change Inaction
Remarkable Editorial! An editorial in Forbes actually criticizes the WSJ by name! The Forbes article by Peter Gleick makes many of the same points made here, but less graphically. Gleick particularly stress that the WSJ declined to print the science affirming letter from the NAS, suggesting a bit of bias. Criticism of the Journal in another conservative publication is unusual. Watch for the pushback. Joe Romm stresses everything. -
SirNubwub at 04:09 AM on 31 January 2012It hasn't warmed since 1998
Tom Curtis: Thank you for your reply. I have not seen the press release. Do you have a link to it? I suspected that something like this would be the answer. If it is the case that the newspaper cherry-picked one data set, I would be satisfied with your answer. But do you have a link? I would love to show it to my school classes as an example of bad journalism. -
Tom Curtis at 04:02 AM on 31 January 2012It hasn't warmed since 1998
Albatross's comment here is also relevant. -
Albatross at 03:57 AM on 31 January 2012David Archibald Exaggerates the Solar Influence on Future Climate Change
John @28, Thanks for the link. The Met Office are not pleased by Rose's distortions and misrepresentations: "Today the Mail on Sunday published a story written by David Rose entitled “Forget global warming – it’s Cycle 25 we need to worry about”. This article includes numerous errors in the reporting of published peer reviewed science undertaken by the Met Office Hadley Centre and for Mr. Rose to suggest that the latest global temperatures available show no warming in the last 15 years is entirely misleading. Despite the Met Office having spoken to David Rose ahead of the publication of the story, he has chosen to not fully include the answers we gave him to questions around decadal projections produced by the Met Office or his belief that we have seen no warming since 1997." And "Furthermore despite criticism of a paper published by the Met Office he chose not to ask us to respond to his misconceptions." Rose has a long history or misrepresenting scientists' research, distorting and cherry picking. He is a a poor excuse for a journalist. See here and here. -
Dikran Marsupial at 03:54 AM on 31 January 2012It hasn't warmed since 1998
Yes, it does show a certain bias in that direction! -
Tom Curtis at 03:52 AM on 31 January 2012It hasn't warmed since 1998
Dikran, the nature of David Rose's opus is clearly revealed by the fact that he found the time to interview 5 AGW deniers, but not one mainstream climate scientist. Nor did he find the time to interview any of the authors of paper on which he supposedly based his article, and which his article directly contradicts. That is not journalism, except in that very broad sense in which Pravda practiced journalism, and Madison Avenue is the center of Journalism in the USA. -
Dikran Marsupial at 03:49 AM on 31 January 2012It hasn't warmed since 1998
Tom, I wouldn't use the temperature of the start and end point as a reliable indicator of the trend. An OLS trend can show warming even when the start point is warmer than the end point, because individual years are sensitive to ENSO etc. -
Esop at 03:49 AM on 31 January 2012The Latest Denialist Plea for Climate Change Inaction
So the WSJ rejected the letter from the NAS urging for climate action but prints this long debunked drivel? Mindblowing, but not surprising. The deniers have free access to the press all over the world, it seems, while the real science is being ignored. Still, the anti-science disinformers claim that the press is "warmist" and won't let them voice their opinion? Amazing. -
Tom Curtis at 03:44 AM on 31 January 2012It hasn't warmed since 1998
Dikran Marsupial @153, in this case it is no warming. The 1997 and 2011 figures are identical in the press release, and 2011 is actually colder than 1997 in the actual data. More importantly the HadCRUT3v trend from 1997 to 2011 inclusive is 0.01 degrees C per decade. Of course, as shown by Foster and Rahmstorf, once short term independent factors such as volcanoes, the El Nino Southern Oscillation and the Solar Cycle are accounted for, the HadCRU trend from 1997 is > 0.1 C per decade, and is statistically indistinguishable from the long term trend of 0.17 C per decade: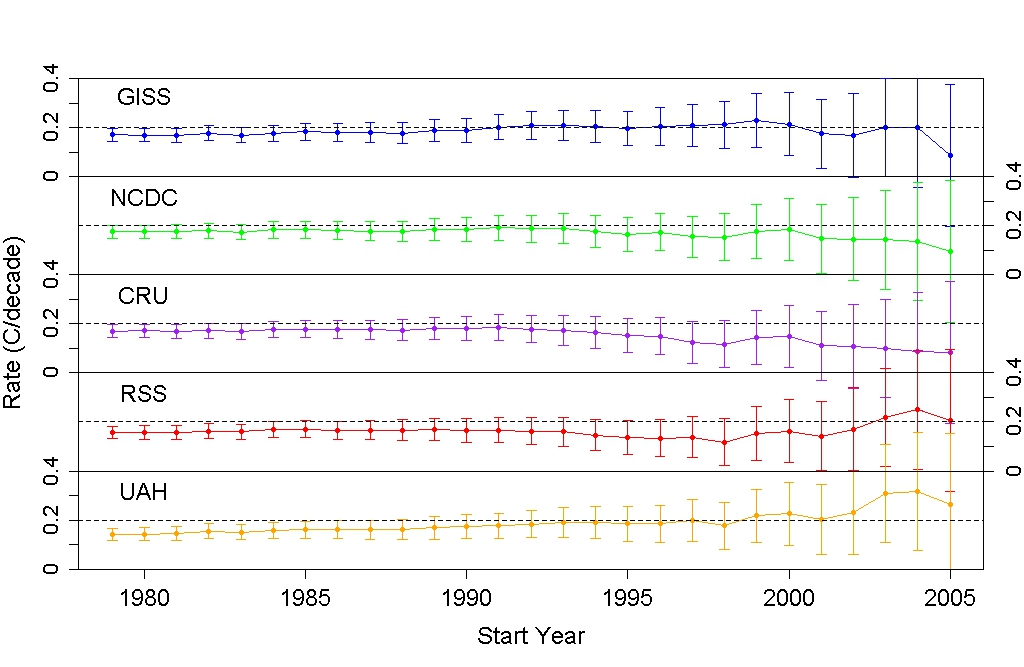
-
CBDunkerson at 03:35 AM on 31 January 2012It hasn't warmed since 1998
SirNubwub, actually that is rather the point. There isn't any 'original paper/press release'. The Daily Mail took the latest updates of the CRU temperature data and NASA solar readings as 'foundation', but all the 'conclusions' they draw came from other sources entirely. DB, the only way to provide "definitive proof" for my position (i.e. that no such statements from CRU/NASA exist) would be to review all statements from those organizations. However, given that we have seen the 'no warming since XYZ' and 'it is the Sun' nonsense over and over and over and over again it doesn't really seem like a stretch to say, 'no, that tripe did not come from NASA or the CRU' without extensive documentation of all NASA/CRU statements. In truth, if you read very carefully, The Daily Mail does an adequate job of differentiating between the data from CRU and NASA and the 'conclusions' deniers outside those organizations draw from them.... except for the claim in the article title that, "if NASA scientists are right the Thames will be freezing over again". NASA didn't say anything about the Thames... that's all Rose. Also, SirNubwub's statement that, "NASA and CRU have stated that there has been no significant warming in the last 15 years", demonstrates how easy it is to miss the transitions in Rose's article from things said by NASA and CRU sources and those said by deniers.
Prev 1332 1333 1334 1335 1336 1337 1338 1339 1340 1341 1342 1343 1344 1345 1346 1347 Next


