


 Arguments


Recent Comments
Prev 1349 1350 1351 1352 1353 1354 1355 1356 1357 1358 1359 1360 1361 1362 1363 1364 Next
Comments 67801 to 67850:
-
MarkR at 03:50 AM on 14 January 2012Gillett et al. Estimate Human and Natural Global Warming
...as do his other Figures. And Dana's article points out throughout the uncertainties and mentions the sensitivity to time period choice. I suspect that the choice of HadCRUT3 (which seems to lowball the warming, particularly in the decade 2000-2010) has something to do with it. Using GISSTemp, NCDC or an eventual global BEST product might bring the periods into better agreement. As would using periods of more complete global coverage (i.e. from sometime between 1870-1900 onwards) -
MarkR at 03:38 AM on 14 January 2012Gillett et al. Estimate Human and Natural Global Warming
#1 Chip Knappenberger : Is this a serious problem? Dana's figure 3 includes both the 1851-2010 and 1901-2000 results for climate sensitivity. -
Chip Knappenberger at 03:30 AM on 14 January 2012Gillett et al. Estimate Human and Natural Global Warming
Dana1981. (-Snip-). What is presented in Gillett et al. Figure 3a are the results of the sensitivity of their regression weights to the time period chosen. If you were to show Figure 3a, then your readers would see that the regression coefficient for the GHG was pretty stable across time periods, with the exception of the 1901-2000 time period. The GHG regression coefficient (and thus TCR) is higher for the period 1901-2000 than it is when a more complete time period is used by either extending the data backwards to 1851 and/or forward to 2010. It is hard to argue, as you seem to want to do, from the results of Gillett et al. Figure 3a that the results from an intermediate data period (1901-2000) are superior to results using a more complete and up-to-date period of time. (-Snip-) -Chip Knappenberger World Climate ReportResponse:[DB] Please refresh yourself with the Comments Policy.
Accusations of deception snipped.
-
Steve Case at 03:09 AM on 14 January 2012Climate and Sea Level: An Emerging Hockey Stick
50 cm/annum doesn't sound like it's that much, but it's well over a millimeter per day and over 150 times the current rate. -
CBDunkerson at 01:41 AM on 14 January 2012Satellites show no warming in the troposphere
scienceteacher, you refer to CCSP modeling being an artifact, but actually Singer's claim is that Santer et al 2008's finding of consistency between modelled and observed results is "an artifact"... CCSP 2006 is mentioned in that section only as sharing some of the same authors as the Santer study. Singer makes a number of claims about the Santer study, but the primary one is that the modeled results do not match UAH satellite observations. This is essentially the same song and dance we've been hearing from Spencer & Christy (the developers of the UAH record) and debunked here. Finally, his history should be considered. This is Fred Singer. Name a major instance of 'scientific' denial in the past 40 years and he has been part of it. Tobacco doesn't cause cancer, asbestos is safe, acid rain doesn't exist, there is no danger from ozone depletion, et cetera... he was involved in all of them. No, his track record does not prove that he is wrong about AGW too... but it certainly shouldn't inspire confidence. -
DSL at 01:31 AM on 14 January 2012U.S. 2011: The Wet Get Wetter, the Dry Get Drier
In addition to Sphaerica's response, Martin, you might try Lu, Vecchi, & Reichler (2007) for a basic physical mechanism and its relation to GCMs. A post on Hadley Cell changes, though, would be useful--and something Norman should investigate. Abstract of Lu (emphasis mine): "A consistent weakening and poleward expansion of the Hadley circulation is diagnosed in the climate change simulations of the IPCC AR4 project. Associated with this widening is a poleward expansion of the subtropical dry zone. Simple scaling analysis supports the notion that the poleward extent of the Hadley cell is set by the location where the thermally driven jet first becomes baroclinically unstable. The expansion of the Hadley cell is caused by an increase in the subtropical static stability, which pushes poleward the baroclinic instability zone and hence the outer boundary of the Hadley cell." -
Bob Lacatena at 01:25 AM on 14 January 2012U.S. 2011: The Wet Get Wetter, the Dry Get Drier
25, Martin, I don't know the answers to all of your questions, and as you say, making regional predictions is very, very tricky. But in reference to your specific question of why global warming should specifically make parts of the South more dry and areas further north more wet... as I previously commented here and here and in the rest of that thread... Very simply, the Earth has something called Hadley Cells. The sunlight strikes the earth most directly at the equator, which also is predominantly ocean. Thus the greatest, most continuous heating and evaporation occurs there.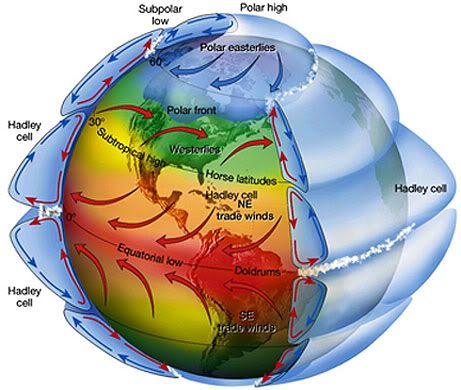 This hot air rises, carrying the moisture with it. Eventually it can't rise any further and spreads north and south (at high altitude). This continues as the air cools and eventually sinks.
The result is that the moisture that is evaporated at the equator is carried over the the adjacent land and deposited further north (or south).
If you look at a map of the Earth, you'll the the deserts predominantly occupy the same latitudes... those areas over which the Hadley Cells carry the moisture before depositing it.
How is this affected by global warming? The forces behind the Hadley Cells get stronger. There is more evaporation, and the air is warmed more and travels higher and farther. This means that the arid area within the Hadley Cell grows, and the area at the far edge of the cell with the rain – more of it – moves further north.
And, of course, the sun continues to strike that growing arid area, which coupled with the increased warmth serves to evaporate more water from that region which is also carried and deposited further north (or south).
If you look at the provided image, find the "Horse Latitudes." Look at the deserts in North America that coincide with this (rainfall north, primarily arid south). Now imagine shifting that line further north.
The predicted growth of the Hadley Cells with warming has already occurred (and we've barely experienced the warming we have already invoked and continue to invoke).
Hence... global warming will cause the cells to grow, which will cause the deserts to expand, and the wet regions beyond them to become more wet.
[Caveat: this is of course not the only mechanism in play. You can have a variations due to local geography, for example high mountain ranges like the Rockies, the Himalayas and the Andes which can block the flow of moisture or create arid conditions of their own simply with their altitude. But a simple look at a globe and the locations of the deserts demonstrates how dominant the effects of the Hadley Cells are in many regions of the earth.]
This hot air rises, carrying the moisture with it. Eventually it can't rise any further and spreads north and south (at high altitude). This continues as the air cools and eventually sinks.
The result is that the moisture that is evaporated at the equator is carried over the the adjacent land and deposited further north (or south).
If you look at a map of the Earth, you'll the the deserts predominantly occupy the same latitudes... those areas over which the Hadley Cells carry the moisture before depositing it.
How is this affected by global warming? The forces behind the Hadley Cells get stronger. There is more evaporation, and the air is warmed more and travels higher and farther. This means that the arid area within the Hadley Cell grows, and the area at the far edge of the cell with the rain – more of it – moves further north.
And, of course, the sun continues to strike that growing arid area, which coupled with the increased warmth serves to evaporate more water from that region which is also carried and deposited further north (or south).
If you look at the provided image, find the "Horse Latitudes." Look at the deserts in North America that coincide with this (rainfall north, primarily arid south). Now imagine shifting that line further north.
The predicted growth of the Hadley Cells with warming has already occurred (and we've barely experienced the warming we have already invoked and continue to invoke).
Hence... global warming will cause the cells to grow, which will cause the deserts to expand, and the wet regions beyond them to become more wet.
[Caveat: this is of course not the only mechanism in play. You can have a variations due to local geography, for example high mountain ranges like the Rockies, the Himalayas and the Andes which can block the flow of moisture or create arid conditions of their own simply with their altitude. But a simple look at a globe and the locations of the deserts demonstrates how dominant the effects of the Hadley Cells are in many regions of the earth.]
-
Martin at 23:32 PM on 13 January 2012U.S. 2011: The Wet Get Wetter, the Dry Get Drier
As I understand climate science, predicting precipitation is more difficult than temperature and regional forecasts are less certain than global forecasts. Predicting that wet areas in the US will get wetter and dry areas drier due to global warming should therefore be a lot more challenging than estimating the rise in global temperature by the end of this century. Could you provide an explanation why this regional forecast is reliable in more detail? The post states that "fast evaporation parches the South and prevailing winds blow the moisture-laden air northeastward". But why would global warming have this result. I could imagine that warmer temperatures would lead to more water evaporating off the Gulf of Mexico leading to more rain in the Southeast. The higher temperatures could mean more evaporation and less precipitation in the Northeast. I think this site needs to post something much more detailed on regional climate forecasting with regards to temperature, precipitation and prevailing winds, explaining how they work - without simply stating that that is what climate models predict. How reliable are they? What are their strengths and weaknesses? Cheers, Martin -
Daniel Bailey at 23:06 PM on 13 January 2012U.S. 2011: The Wet Get Wetter, the Dry Get Drier
@ Norman You continue to prosecute an agenda of "It's not happening" "It's natural variation" "there's not enough data" and to prop up the agenda you typically focus on short term events in local areas. Here's a global metric for you: Way back when I made this observation:"The last month with below-average temperature was February 1985. That makes 313 consecutive months with temperatures above the 20th Century average. Not that anyone expected that... Betcha that streak continues for some time."
We are now at 322 consecutive months...and still counting. Whodathunkit? Regime change, anyone? -
michael sweet at 23:01 PM on 13 January 2012U.S. 2011: The Wet Get Wetter, the Dry Get Drier
Norman, When you don't keep up with what everyone else knows you make incorrect assertions. Skeptical Science has already had a post about worldwide increase in extreme heat events. Please read Quantifing extreme heat events as several other people have referred you to. The data on the USA is important because many readers, like me, live in the USA. This post describes the annual report from the National Climate Data center. The NCDC has not released the worldwide data yet. Expect a post soon describing the world situation. Skeptical Science is a good web site, but they have to wait for the data to be released before they can write a post. -
skept.fr at 22:56 PM on 13 January 2012Climate and Sea Level: An Emerging Hockey Stick
#20 Agnostic : "few people believe that within 50 years we are likely to be looking at SLR in the order of 50cm/annum" In fact, I'm among the people who do not believe that. What is the source for this "likely" SLR? -
skept.fr at 22:53 PM on 13 January 2012Climate and Sea Level: An Emerging Hockey Stick
#17 scaddenp : The primary obstacle to action at the moment is misinformed denial Do you really think that? I suppose you speak of US "action", because the 193 other nation-states of our world do not really decide their economy and energy policy from Lindzen, Spencer, Michaels and other outsiders' views... -
skept.fr at 21:33 PM on 13 January 2012U.S. 2011: The Wet Get Wetter, the Dry Get Drier
#15-16 Norman : From the graph in #8 (Tom), it seems there is a trend even without sophisticated statistics. Since 1980, 20 yrs are above the mean (black line), and since 1910, I see no other period of 3 decades with such a 2/3 rate. Even 1931-1960 period (with the highest previous bars) had 12 yrs above the mean, so 1/3. -
adelady at 20:56 PM on 13 January 2012U.S. 2011: The Wet Get Wetter, the Dry Get Drier
Norman "From a look at Tom Smerling's graph post at 8 it would seem that to form any long term conclusions about 2011 would be premature." Have another look at that graph. In particular run your eye across the 20ish% 'mean' level. Now do it again looking for 'above the mean' and 'below the mean' on the red trendline. When I do this, I notice that before 1980 the line oscillates above and below. After 1980? It went up. And has never gone below the mean since. -
Spike25 at 20:53 PM on 13 January 2012U.S. 2011: The Wet Get Wetter, the Dry Get Drier
Scotland had its wettest year on record with 73.2in (1859.5mm) of rain, beating a previous record set in 1990. However, some parts of England have had very low levels of rainfall, according to the Met Office. East Anglia had its second driest year on record with 17.6in (449mm) of rain and the Midlands its third driest with 23in (586.5mm). I think the UK rainfall changes last year are broadly in line with what the models suggest for us. -
DrTsk at 20:39 PM on 13 January 2012Climate's changed before
Moon, it would be great if someone graphed the first derivative for illustration of the rate of change. Some people have really hard time with that concept. Thank you for the previous graphs. -
monkeyorchid at 19:21 PM on 13 January 2012Climate Change Denial and the Media - Banishment of Science Reality
Great article. When discussing the UK media, the leading denialist organ is the Daily Express - worse even than the Daily Mail. The Express ran the infamous headline "100 reasons why climate change is natural" at the time of the Copenhagen conference. I suspect that getting 100 falsehoods into a cover story is probably a world record for any newspaper. In Britain there is currently a far-reaching enquiry going on into the misbehaviour of the media, but sadly it isn't covering climate denialism. The more enlightened press does its best (see below), but needs go after these people with the same doggedness it went after illegal phone hacking by journalists (which triggered the enquiry). Then we might get somewhere. On the plus side, a recent Guardian article brings the influence of money on US politics into the open, including the following quote. "The Chamber of Commerce spent more money on the 2010 elections than the Republican and Democratic National Committees combined, and 94% of those dollars went to climate-change deniers. " http://www.guardian.co.uk/commentisfree/cifamerica/2012/jan/05/time-to-get-corporate-cash-out-of-congress -
Rob Painting at 16:23 PM on 13 January 2012U.S. 2011: The Wet Get Wetter, the Dry Get Drier
Extreme weather may not increase every year, but throughout the course of this century it is likely to. James Hansen's paper shows a marked increase in heat extremes in the last few decades, and the Rahmstorf & Coumou (2011) paper demonstrate the fundamental reasoning behind this. We also have Li (2011) who show that La Nina/El Nino seems to grow in intensity and frequency with warming of the background state of the Pacific Ocean. And a recent modeling study Seager (2011) showing not only will El Nino/La Nina intensify this century, but it should have started already. They maybe right. We humans are just going to have to get used to increasingly more wicked weather, and suffer the consequences. Of course, rapidly phasing out fossil fuels would stop things from becoming even worse. Just a thought. -
skywatcher at 16:18 PM on 13 January 2012U.S. 2011: The Wet Get Wetter, the Dry Get Drier
Norman, I really think you need to read the SkS article Quantifying Extreme Heat Events and the linked paper by Hansen et al. There, you will see graphically how extremes of heat are on the rise, not only in the US, but all around the globe, just as predicted. with 10% of the globe now experiencing "extremely hot" conditions compared to <1% 50 years ago. The US is merely reflecting this global pattern; indeed in recent years the US has been quite lucky to avoid most of the great extremes until the Texas drought brought 3-sigma heat to US shores. 3-sigma heat is on the rise and is now a 1-in-10 chance for any given location and rising. -
bill4344 at 14:59 PM on 13 January 2012U.S. 2011: The Wet Get Wetter, the Dry Get Drier
Norman, SkS is simply saying this is indicative both of what has been predicted for AGW conditions, and what we can expect more of in the future. But you knew that already. You might have noticed there were just a few other droughts and - particularly - floods in other areas around the globe in the course of the last year or so. Along with the wombat I can also easily imagine an 'extreme weather events have been declining since 2011' meme arising, at least until the next major El Nino or La Nina. Then the decline will reset from that date. -
muoncounter at 14:47 PM on 13 January 2012Climate's changed before
Dr T, Here's the stock version. --source
I plotted Vostok temperature anomalies along with the Moberg et al 2005 reconstruction's low frequency (LF) component, a smoothed version (LOESS) and GISS temps:
--source
I plotted Vostok temperature anomalies along with the Moberg et al 2005 reconstruction's low frequency (LF) component, a smoothed version (LOESS) and GISS temps:
 The time scale is calendar year rather than 'years BP.' So the jump up at circa 8000 BP appears at -6000 on the bottom graph. It certainly looks like 8000 years of relatively slow, small temperature variation is over. Anyone who says 'the modern warming is nothing new' clearly doesn't understand the concept of 'rate of change.'
Exit Holocene, enter Anthropocene.
The time scale is calendar year rather than 'years BP.' So the jump up at circa 8000 BP appears at -6000 on the bottom graph. It certainly looks like 8000 years of relatively slow, small temperature variation is over. Anyone who says 'the modern warming is nothing new' clearly doesn't understand the concept of 'rate of change.'
Exit Holocene, enter Anthropocene.
-
Norman at 14:39 PM on 13 January 2012U.S. 2011: The Wet Get Wetter, the Dry Get Drier
My question is why would one extreme year in an area that covers a small part of the globe mean anything or give any indication of potential change in the future? I have brought up short term changes on other threads. Here is the response. or this. SKS seems very critical of forming conclusion based upon very short times spans or relatively small areas. -
Norman at 14:26 PM on 13 January 2012U.S. 2011: The Wet Get Wetter, the Dry Get Drier
From a look at Tom Smerling's graph post at 8 it would seem that to form any long term conclusions about 2011 would be premature. There were only two year's in the 100 time span that had more than 50% of the United States in either a severe drought or too wet. And looking at the years before 2011 it certainly does not indicate any upward motion. -
skywatcher at 12:56 PM on 13 January 2012Climate and Sea Level: An Emerging Hockey Stick
#20 Agnostic - am not sure if 50cm/annum is reasonable - even in Meltwater Pulse 1A it was most likely up to ~50mm/yr, maybe a bit higher, which is quite enough to be going on with... -
DrTsk at 12:51 PM on 13 January 2012Climate's changed before
muoncounter, could you provide the above graphic in a normal scale for reference? -
stressedchef at 12:33 PM on 13 January 2012CO2 limits will make little difference
Without wanting to overcomplicate the point, I would say that: a) it's overstating things to say that CO2 limits by all countries are needed; a large number of countries emit very little due to small size, poverty or both. A suitable agreement between the top 20 emitters would cover most global emissions and most of world trade. Adding further parties is useful for reducing trade distortions and adding a bit more abatement potential, but balanced against this is the difficulty of making progress in full multilateral forums with 190+ parties. b) An agreement/set of agreements need not be through the current UN process; while this is looking healthier post-Cancun and post-Durban than just after Copenhagen, it remains a very difficult process. Other tracks can be (and to a significant extent are being) pursued as well, including unilateral national/regional policies (California, Australia, EU), bilateral agreements (Australia/Indonesia discussions for example) and smaller multilateral groupings (Major Economies Forum eg). The 'success' or 'failure' of a particular UNFCCC conference/process remains important, but it is far from the whole story. -
Tom Smerling at 12:23 PM on 13 January 2012U.S. 2011: The Wet Get Wetter, the Dry Get Drier
#12 @Sceptical Wombat I agree. That's why I posed it as a question -- Is there a trend? -- rather than a statement. I'd like to hear from some other statistics folks about this... -
Sceptical Wombat at 12:15 PM on 13 January 2012U.S. 2011: The Wet Get Wetter, the Dry Get Drier
It is not strictly true that wet states get wetter and dry ones get drier. For instance Louisiana shows up as much below normal but this was the state that got dumped on by Catrina. What does appear to happen is that the wet extremes get wetter and the dry extremes get drier sometimes in the same place in different years. Given that I come from "a place of droughts and flooding rains" this does not augur well for me. -
scaddenp at 12:08 PM on 13 January 2012Climate and Sea Level: An Emerging Hockey Stick
Also William, you came here saying that you wanted to find the truth. Good for you, so do I. However, dont let that turn into a search for reasons for doing nothing. First you find out what the science actually says, then you do a risk assessment to determine action. -
Sceptical Wombat at 12:06 PM on 13 January 2012U.S. 2011: The Wet Get Wetter, the Dry Get Drier
Tom I would not put too much reliance on the trend line until we have a few more high years - at the moment it appears to be pushed up by one year's data. I can see a certain peer in a few years telling everyone that extreme weather events have been declining since 2011. -
Steve Metzler at 11:37 AM on 13 January 2012Climate Change Denial and the Media - Banishment of Science Reality
@Doug H "...I am surprised that I ended up as, I hope, a true sceptic... It also might have something to do with my training in analysis, in that I like to start with the data when framing a software design. OTOH, it might just be chance." Programming computers since 1974, and a skeptic of the Randi school for at least 10 years. No, it's not chance, and it has a name: it's called "critical thinking". -
Tony O at 11:21 AM on 13 January 2012U.S. 2011: The Wet Get Wetter, the Dry Get Drier
Oregon is looking better and better -
Riduna at 11:20 AM on 13 January 2012Climate and Sea Level: An Emerging Hockey Stick
Philippe Chantreau @ 10 A further problem is that SLR is as non linear as melting of ice sheets. Present rate of increase, a mere 3.2mm/annum worries no one and, based on that rate, few people believe that within 50 years we are likely to be looking at SLR in the order of 50cm/annum. And when that point is reached it will be far too late to "adapt" to the coming threat to major coastal cities. Move cities and their 3-4 billion inhabitants to higher ground. No problemo! Really? -
skywatcher at 11:17 AM on 13 January 2012U.S. 2011: The Wet Get Wetter, the Dry Get Drier
#9: Which situation do you think is most stressful for plants, animals, people on flood plains, or people relying on limited water supplies? 1: Really average conditions, everywhere gets just about the amount of rain they typically expect. 2: Extremes of wet and dry with associated extreme drought and flood? -
skywatcher at 11:09 AM on 13 January 2012Climate and Sea Level: An Emerging Hockey Stick
Sea levels have been changing for billions of years
Yes, they have, and always in response to some kind of forcing. Ditto climate change. They never change without a forcing of some sort. We are providing a very large forcing by altering the planet's radiative energy balance with all our FF-derived CO2. Uniquely in geological history, we are aware of this issue. We are a step ahead of orbital forcing or plate tectonic forcing that has altered sea levels in the past. We are, unlike the continets and the Earth's orbit, able to see what we are doing, see that it is altering sea levels (among many other things), and do something about it, say... by substantially reducing our CO2 emissions. -
Riduna at 11:08 AM on 13 January 2012Climate and Sea Level: An Emerging Hockey Stick
Rob @ 5 "it'll take about a thousand years to get there ....." 500 years according to Hansen. He talks of a 5 metre SLR by 2100, My estimate based on decadel doubling of land-based ice loss is 4 metres. But 4 metres or 5 metres - who's quibbling? -
ClimateWatcher at 10:57 AM on 13 January 2012U.S. 2011: The Wet Get Wetter, the Dry Get Drier
So, do you suppose that in 1970, when the wet-or-dry number was about 2%, that people were concerned that 'every where is just about average'? -
scaddenp at 10:57 AM on 13 January 2012Climate and Sea Level: An Emerging Hockey Stick
So William, you dont think removal of FF subsidies, "Hansen tax" etc can change FF use? The primary obstacle to action at the moment is misinformed denial. Climate (and sea level) has changed in the past but mostly slowly and before we had settled agriculture, but AGW forcing are causing climate change at rates normally associated with large mass-extinction events. The good news is that we can solve this problem, unlike say an asteroid strike. Perhaps you might like to take the challenge here. If you are entertaining the idea that its not bad, then please see Its not bad -
Doug Hutcheson at 10:40 AM on 13 January 2012Satellites show no warming in the troposphere
Sorry, meant to add this link to Sks debunking Singer: Fred Singer Denies Global Warming -
Doug Hutcheson at 10:33 AM on 13 January 2012Satellites show no warming in the troposphere
It is not within my sphere of expertise to post a formal rebuttal, but I note two telling points: 1) It is an opinion piece, an article, not a peer-reviewed scientific paper; 2) Note the provenance: it was published in ENERGY & ENVIRONMENT VOLUME 22 No. 4 2011, which is an organ of the fossil fuel industry, not a scientific journal. So, the article fails the test of credibility right at the outset. Prudence dictates it should be regarded as a suspect source unless and until it is published in the formal scientific manner. I note that Singer has authored work which has been debunked here and elsewhere, but I am not dismissing this article on that ground. -
William Haas at 10:27 AM on 13 January 2012Climate and Sea Level: An Emerging Hockey Stick
If human caused CO2 is really the cause of all of this then I think that there is little that is going to be done that will actually reduce CO2 levels and with it sea levels. If CO2 levels are not the cause than what will be will be. Sea levels have been changing for billions of years and I doubt that we are ever going to be able to change that. Very low level property close to the sea has always had a certain risk associated with it. -
Doug Hutcheson at 10:19 AM on 13 January 2012Climate and Sea Level: An Emerging Hockey Stick
Mal @ 13: Just proves the old saying that failing to plan is planning to fail. If I were one of those residents living in a future flood zone (declared or not), I would quietly and quickly put my home on the market, hoping to attract a buyer from the deniersphere. My brother in law recently purchased a property in a canal estate, not ten feet above the high tide mark. I had to bite my tongue when he told me how cheaply he had bought it. Sigh. -
Doug Hutcheson at 09:56 AM on 13 January 2012Sea level rise predictions are exaggerated
Mods: Rob Painting's graphic @ 5 must have been moved. When I try to display it, I see "The requested URL /files/current/sl_global.jpg was not found on this server." On topic, am I right in thinking that the rate of melt of the ice sheets will increase as they lose mass: ie the more they melt, the faster they melt? Something about mass relative to surface area, if I recall my high-school physics from 45 years ago.Response:[DB] Graphic updated.
-
John Hartz at 09:50 AM on 13 January 2012Lean and Rind Estimate Human and Natural Global Warming
Zachary Shahan at PlanetSave has reposted the article with the following introduction: "The folks over at Skeptical Science recently put together a great summary post of a Lean and Rind paper on human and natural factors influencing global warming. The obvious conclusion was that humans are driving global warming. In particular, there’s no way solar activity, volcanic activity, and the El Niño Southern Oscillation are causing the warming. The first chart below says it all. But, for those who want more than a chart, I’m just going to repost the whole piece (click to enlarge any of the images or charts). Thanks to Skeptical Science for the great work they do on this front!" Source: Planetsave (http://s.tt/15cER) -
Rob Painting at 09:44 AM on 13 January 2012It's not bad
Edit: Debunked Saleska paper removed from the positive column - the Amazon did not green up during the exceptional 2005 drought - see:Samanta (2010) Nemani (2003) also excised. It does not imply enhanced forest growth with future global warming. A further reduction in cloud cover over the Amazon will lead to more warming of the forest canopy and, possibly, exceeding a heat tolerance threshold. See SkS post: Amazon Drought: Heat Stress Linked To Mass Tree Die Off In 2005 and 2010 -
dr2chase at 09:13 AM on 13 January 2012Climate and Sea Level: An Emerging Hockey Stick
Regarding change required in coastal cities, I think there might be more than one way to look at it. Consider Florida. in 1912, what was in Florida? Not much. Says Wikipedia, "In 1900 its population was only 528,542". Humans are well-known for their loss/gain asymmetry, so we may see the flow of millions of people out of (coastal) Florida in the space of a century as something catastrophic, but in terms of new construction and infrastructure required somewhere, it's no different from the century we just had. One difference is that all the wealth that people perceive they may own in Florida real estate will evaporate, and it will evaporate well ahead of the rise in sea level (once it becomes widely believed that the sea level is rising and will continue to rise). But it was pretty well worthless (to "civilized" people) 100 years ago (swamps, alligators, mosquitos, snakes, malaria, yellow fever), so really, no change there, either. So if you take that view, and it's not that hard a view to take, climate change in the US will just be a matter of moving people around. And taking that point of view, I do wonder, how will people behave if we start to see centimeters-per-year in sea level rise? Where will they move? -
jabarnard at 09:02 AM on 13 January 2012CO2 is not a pollutant
I think the question hangs on whether you believe global warming is on net harmful at the levels predicted. If you don't believe that the net effects of a 2 degree temperature rise are harmful then it's hard to get to the point of calling CO2 a pollutant. While there have been many dire predictions based on the 2 degree theory I have yet to see a well reasoned quantification of the relative benefits versus harms. Where can I find that?Response:[DB] Try here:
http://www.skepticalscience.com/global-warming-positives-negatives-intermediate.htm
-
Tom Smerling at 08:56 AM on 13 January 2012U.S. 2011: The Wet Get Wetter, the Dry Get Drier
Jeff Masters again: Percentage of the U.S. in extreme droughts or extremely wet, 1910-2011 Notice the red trendline, relative to the black horizontal mean for the period. A trend? Figure 3. Percentage of the contiguous U.S. either in severe or greater drought (top 10% dryness) or extremely wet (top 10% wetness) during 2011, as computed using NOAA's Climate Extremes Index. Remarkably, more than half of the country (58%) experienced either a top-ten driest or top-ten wettest year, a new record. Image credit: NOAA/NCDC.
Moderator Response: [RH] Fixed image width.
Figure 3. Percentage of the contiguous U.S. either in severe or greater drought (top 10% dryness) or extremely wet (top 10% wetness) during 2011, as computed using NOAA's Climate Extremes Index. Remarkably, more than half of the country (58%) experienced either a top-ten driest or top-ten wettest year, a new record. Image credit: NOAA/NCDC.
Moderator Response: [RH] Fixed image width. -
scaddenp at 08:54 AM on 13 January 2012Global Warming: Trend and Variation
And please tell us the physical basis for this proposed longer variation. -
John Hartz at 08:53 AM on 13 January 2012Climate Change Denial and the Media - Banishment of Science Reality
@Brian Purdue: Kuddos on an excellent article. One issue that you did not explicitly deal with is the power of the fossil fuel industry to affect how the mass media deals with climate change by virtue of purchasing megabucks worth of advertising. Perhaps a follow-up article is in order.
Prev 1349 1350 1351 1352 1353 1354 1355 1356 1357 1358 1359 1360 1361 1362 1363 1364 Next


