


 Arguments


Recent Comments
Prev 1351 1352 1353 1354 1355 1356 1357 1358 1359 1360 1361 1362 1363 1364 1365 1366 Next
Comments 67901 to 67950:
-
chirhophoros at 12:22 PM on 12 January 20122012 SkS Weekly Digest #1
Thank you Tom Curtis. I am actually a regular visitor and have been so for some years. I used to post frequently under another name but have not contributed a comment for well over a year (I think). The moderation policy at SkS has been a source of concern to me for a long time. My last contribution to SkS under my former nom de plume comprised an expression of concern about moderation standards (as best as I recall). I decided to write under another name as an experiment. The null hypothesis comprised: SkS would willingly accept a criticism made in good faith in response to a specific invitation to discuss the moderation policy. Following deletion of my comment, I responded to the effect that SkS had confirmed my hypothesis (or strictly speaking, strongly undermined the null hypothesis). As of today, I think the null hypothesis is decidedly strengthened. I'm pleased with the outcome. I should add that I have no huge personal stake in the matter. I don't get a major buzz out of seeing my comments on a blog. These days, I contribute very rarely to any blog because of sheer lack of time. The actual science on SkS is often very thought provoking and challenging - hence, I do check it out at least a couple of times a week if not more. I see myself as a "lukewarmer" and thus quite interested in all aspects of the science. Unfortunately, you run the risk of "preaching to the choir" if you don't maintain a consistently high standard of moderation. My comments were made in good faith - I really don't have the time or inclination to "troll." With best wishes to all for 2012 chirhophorus (formerly chris1204 and chriscanaris) -
Tom Curtis at 11:52 AM on 12 January 20122012 SkS Weekly Digest #1
I'ld like to thank Daniel Bailey (moderator) for restoring chirhophoros' original post. I certainly understand his concern about the use of the discussion of moderation policy as an excuse for trolling. I also understand why he thinks chirhophoros's original post went to far. Never-the-less, his consideration in the interests of discussion on this thread is appreciated. -
Tom Curtis at 11:45 AM on 12 January 2012Skepticism About Lower Atmosphere Temperature Data
Fred Staples @18: 1) The satellite data only has near global coverage, being very restricted in its coverage of the poles. UAH does publish polar data, but RSS does not because the imprecision (error bars) of the data are too large relative to the rest of the globe. 2) The Temperature Middle Troposphere (TMT) channel is poorly named as it includes significant data from the lower stratosphere and the surface (see figure below). As the lower stratosphere is cooling and the surface may not be warming as fast as the middle troposphere, that under reports middle to upper troposphere temperature trends and makes direct comparisons the model predictions of a tropospheric hotspot difficult. Such comparisons require construction of an explicitly weighted function of temperature to match the signal strengths in the TMT channel which you have neither done nor cited. Therefore absent such a weighted model prediction, the TMT comparison is irrelevant. 3) For the Temperature Lower Troposphere (TLT) channel, UAH understates the HADAT radiosonde trend by 10%, the RAOBCORE radiosonde trends by 5%, the RICH radiosonde data by 8%, but overstates the IUK radiosonde trend by 6%. The IUK radiosonde trend is a clear outlier among the radiosonde data sets understating the average trend of the other three sets by 12%. The RSS trend is lower than the UAH trend when compared to the first three radiosonde data sets, but (illustrating the idiosyncracies that can arise with small data sets) overstates it compared the UAH in the IUK comparison.
Based on this, satellite data understates the TLT trend by at least 4%, and probably closer to 10% when compared to radiosondes. Given that the TLT channel still includes surface data, biasing it low, that means the satellited data from RSS is entirely consistent with a tropospheric hotspot. Once adjusted for endogenous factors as per Foster and Rahmstorf 2011, that means the long term trend in tropospheric temperatures is at least equal to the surface trends, and probably greater. The same adjustment for endogenous factors clearly illustrates that UAH is a low outrider, with an adjusted trend of 0.14 C/decade compared to the RSS trend of 0.16 C/decade.
3) For the Temperature Lower Troposphere (TLT) channel, UAH understates the HADAT radiosonde trend by 10%, the RAOBCORE radiosonde trends by 5%, the RICH radiosonde data by 8%, but overstates the IUK radiosonde trend by 6%. The IUK radiosonde trend is a clear outlier among the radiosonde data sets understating the average trend of the other three sets by 12%. The RSS trend is lower than the UAH trend when compared to the first three radiosonde data sets, but (illustrating the idiosyncracies that can arise with small data sets) overstates it compared the UAH in the IUK comparison.
Based on this, satellite data understates the TLT trend by at least 4%, and probably closer to 10% when compared to radiosondes. Given that the TLT channel still includes surface data, biasing it low, that means the satellited data from RSS is entirely consistent with a tropospheric hotspot. Once adjusted for endogenous factors as per Foster and Rahmstorf 2011, that means the long term trend in tropospheric temperatures is at least equal to the surface trends, and probably greater. The same adjustment for endogenous factors clearly illustrates that UAH is a low outrider, with an adjusted trend of 0.14 C/decade compared to the RSS trend of 0.16 C/decade.
-
DSL at 11:40 AM on 12 January 2012Global Warming: Trend and Variation
Did I misread QE? I thought s/he was poking fun at the whole "it's a natural cycle" crowd. -
ms2et at 11:33 AM on 12 January 2012Lean and Rind Estimate Human and Natural Global Warming
Thanks, guys. I now understand why my analogy was a very poor one: TSI correlates well with the other solar variables that I was curious about, so it's appropriate to use it in the regression. -
Daniel Bailey at 11:30 AM on 12 January 2012Why does CO2 lag temperature?
"every time you leave something not explicitly explained, a skeptic will use this as a point of attack against the entire concept"
Those aren't skeptics. Those are fake-skeptics. -
Tom Curtis at 11:09 AM on 12 January 2012Climate Change Denial and the Media - Banishment of Science Reality
A transcript of the podcast can be found by following the link to the ABC at the podcast site. -
exp137 at 11:05 AM on 12 January 2012Why does CO2 lag temperature?
Thanks for the responses everyone. This was seriously informative, and needed. I agree with Rob Painting here, that it would be great to put this together into a post to fill the gap left by focusing mainly on the lag on the warming end of the cycle. From what I've seen, every time you leave something not explicitly explained, a skeptic will use this as a point of attack against the entire concept. Again, thank you very much for your quick and detailed responses. -
Doug Hutcheson at 10:54 AM on 12 January 2012Climate Change Denial and the Media - Banishment of Science Reality
Given the media bias and the fact that I am not a scientist of any flavour (my career was computer programming), I am surprised that I ended up as, I hope, a true sceptic. The processes by which people like me come to understand the science, in spite of the smoke and mirrors, might be interesting to investigate. I guess I have always been truly sceptical of advertising, therefore of much in the commercial MSM, making it easier for me to say 'show me the data'. It also might have something to do with my training in analysis, in that I like to start with the data when framing a software design. OTOH, it might just be chance. -
Albatross at 10:50 AM on 12 January 2012Skepticism About Lower Atmosphere Temperature Data
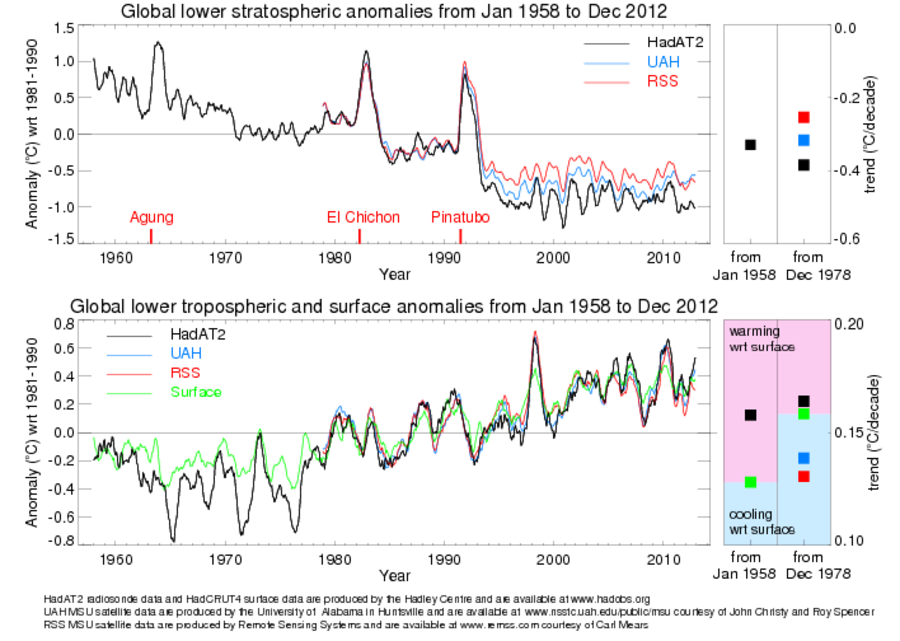
"However, the most likely explanation for UAH showing less warming than models and atmospheric physics predict is that UAH is biased low" This is a legitimate possibility that is supported by the data. A 2006 report on which John Christy (developer of the UAH product) was a lead author concluded that: "These results could arise either because [1]“real world” amplification effects on short and long time scales are controlled by different physical mechanisms, and models fail to capture such behavior; or [2] because non-climatic influences remaining in some or all of the observed tropospheric data sets lead to biased long-term trends; or [3] a combination of these factors. The new evidence in this Report favors the second [2] explanation." [I added the numbering for clarity] This figure from the UK Met office shows UAH (blue square) to be biased low: Caption: HadAT2 radiosonde data (black) vs. UAH (blue) and RSS (red) lower troposphere temperatures, and HadCRUT3 surface temperatures (green) [Source]
Note that the surface rates of warming compare well with RSS and HadAT and RATPAC.
The point was that the satellite data, in particular the UAH data are biased low is a very real possibility that should not be ignored. Yet, Taylor did just that. Satellite data are not the gold standard that "skeptics' imagine them to be, corrections to the satellite data have been numerous and are ongoing. Mears et al. (2011) note that there are still outstanding issues:
"This further confirms our finding for our data set that unambiguously resolving the diurnal drift effect correction and its impacts is likely to be a key determinant in reducing the uncertainty in long term tropospheric temperature changes from MSU/AMSU records."
Also, something else Mr. Taylor and Dr. Michaels decided to not share with their readers is that other satellite products that use different techniques to correct for stratospheric contamination obtain much higher rates of warming in the mid troposphere than do UAH, see here.
Caption: HadAT2 radiosonde data (black) vs. UAH (blue) and RSS (red) lower troposphere temperatures, and HadCRUT3 surface temperatures (green) [Source]
Note that the surface rates of warming compare well with RSS and HadAT and RATPAC.
The point was that the satellite data, in particular the UAH data are biased low is a very real possibility that should not be ignored. Yet, Taylor did just that. Satellite data are not the gold standard that "skeptics' imagine them to be, corrections to the satellite data have been numerous and are ongoing. Mears et al. (2011) note that there are still outstanding issues:
"This further confirms our finding for our data set that unambiguously resolving the diurnal drift effect correction and its impacts is likely to be a key determinant in reducing the uncertainty in long term tropospheric temperature changes from MSU/AMSU records."
Also, something else Mr. Taylor and Dr. Michaels decided to not share with their readers is that other satellite products that use different techniques to correct for stratospheric contamination obtain much higher rates of warming in the mid troposphere than do UAH, see here.
-
Rob Painting at 10:30 AM on 12 January 2012Why does CO2 lag temperature?
Sphaerica - You have the makings of a post/rebuttal there. Maybe a few graphics to explain how it fits together. I only mention this because it is a legitimate area of confusion, and perhaps we haven't adequately explained the process. -
Tom Curtis at 10:13 AM on 12 January 2012Lean and Rind Estimate Human and Natural Global Warming
skept.fr @14, so long as the change in relative strengths in different bands is consistent across all solar cycles, it will correlate with TSI, and its effect on temperature will be included in the regression. That effect may have the same sign as the effect of change in TSI, and hence strengthen the TSI signal. Alternatively it may be of opposite sign, and weaken the signal. It will still be incorporated in the regression. It is only if the effect is largely random with respect to the strength of TSI that the regression will not include it as either a strengthening or weakening effect on the TSI, but I am unaware of any suggested solar mechanism effecting climate that is not correlated with TSI. -
Bob Lacatena at 09:49 AM on 12 January 2012Why does CO2 lag temperature?
exp137, Okay, one more point. I'm actually really glad that you brought this up, because it highlights a very, very important aspect of CO2, and that is that because of the logarithmic nature (i.e. double CO2 to get the same incremental increase in temperature, so 2x = 1, 4x = 2, 8x = 3, and so on) the effects of increasing CO2 are more evident when you raise it from a low value, and less evident when you first drop it from a high value. This has huge implications on the idea of adding it, and somehow later trying to reduce it and return temperatures to normal. What this inevitably means is that it is easier to raise temperatures by increasing CO2 than it is to drop them by decreasing CO2. As such, the impact of CO2 at the start of a glaciation is far less evident than the impact on the start of a glacial termination. Also... it is going to be a whole lot easier for man to raise temperatures by increasing CO2 than to draw them down by extracting it. The bang from the first X gigatons added to the atmosphere is far greater than the bang from the first X gigatons somehow subtracted (assuming we can come up with a cost effective way of doing so). -
Brian Purdue at 09:37 AM on 12 January 2012Climate Change Denial and the Media - Banishment of Science Reality
tmac57 – The Young Australian Skeptics are doing some really good work too. They carried this review of John Cook and Haydn Washington’s book http://www.youngausskeptics.com/2011/12/climate-change-denial-book-review/ -
Bob Lacatena at 09:36 AM on 12 January 2012Why does CO2 lag temperature?
exp137, I should clarify something. I rather inadvisedly said "fighting against rather than in concert with CO2 changes." That didn't come out as I intended, and is incorrect. CO2 is a feedback that enhances the temperature drop. The point I intended to make was rather that because CO2 levels are high, the high temperatures that result help to hold back the expansion of the ice sheets. At the same time, because of the logarithmic nature of CO2, a "draw down" of CO2 levels and temperatures is much harder to enact than an increase. One must get more CO2 out of the atmosphere, at the start of glaciation, to get the same change in temperature. As such the effects of CO2 changes at the initial stages of glaciation are small/sluggish, the opposite of the result of changes in CO2 at the start of a glacial termination. This makes it look like CO2 provides a bigger "kick" to a glacial termination (it does, at the start, as opposed to glaciation where that kick is harder at the end). -
scaddenp at 09:14 AM on 12 January 2012Why does CO2 lag temperature?
My understanding of the role of CO2 in Pleistocene glaciations is twofold. 1/ One it is a slow feedback amplifying effect of solar (which would be too weak for the scale of temperature change by itself). 2/ It is part of the mechanism by which changes in NH also causes warming/cooling in the SH. Note that albedo is also major player in the feedback the amplifies the solar change. The relative importance of the forcings are discussed in Ch 6 of the IPCC WG1 report. -
tmac57 at 09:12 AM on 12 January 2012Climate Change Denial and the Media - Banishment of Science Reality
Nice to see some recognition of some legitimate Skeptics.Eran Segev and The Australian Skeptics do some really good work. -
John Cook at 08:56 AM on 12 January 2012Just Science app shows climate change is happening in pictures anyone can understand
No Android version?? Sniff, whimper?? Nick, welcome to my world :-) -
Bob Lacatena at 08:42 AM on 12 January 2012Why does CO2 lag temperature?
exp137,...in which CO2 does appear to drive temperature...
This is a bad way to look at things. Talk of a "driver" is a trap, or rather a denier's canard. In a natural climate there are very few true forcings. Orbital forcings are one. Change in solar output is another. A massive injection of CO2 due to, for example, volcanic or anthropogenic activity are also true forcings. A massive injection of dimming aerosols due to volcanic activity or a huge asteroid strike is yet another. These can be true "drivers." Outside of that, almost all of the possible influencing factors are interlocked. Atmospheric H2O rises/falls quickly with temperature changes, and drags temperatures further up/down. CO2 rises/falls similarly but less quickly, also dragging temperatures further up/down. Changes in temperatures can contract/expand ice sheets, which reduce/expand albedo, which drag temperatures further up/down. Virtually everything in the normal ebb and flow of climate is an interlinked feedback. Actual drivers vary, but the definition of the "driver" is more complex than simply "is this a driver?" The true "driver" somehow changed due do an event outside of the normal climate system... a quirk in the slow change in orbit, a massive flurry of volcanic activity, who-knows-what in the sun, or... a fossil-fuel based civilization. Albedo (snow/ice) is never a "driver"... orbital forcings cause that change, although orbital forcings don't themselves directly influence temperature, but rather the effects on snow/ice extent do so. CO2 is a "driver" only when it is "un-naturally" changed (volcanoes, humans). Otherwise it is a feedback. But the reason for the change in no way changes the efficacy of the forcing. If a car runs you over, it doesn't matter if someone was behind the wheel driving it or not, it still has the same effect. -
skept.fr at 08:42 AM on 12 January 2012Lean and Rind Estimate Human and Natural Global Warming
#11 : I think my point was clear, but whatever the (non) influence of spectral / total solar irradiance on Earth climate, you've not to say that TSI variance is correlated to UV-EUV variance if it is not in reality or if scientists debate about the nature and scale of this correlation (see also Lockwood et al 2010, Lukianova et Mursula 2011 ). There's no reason to doubt that GHGs are the main driver of T for the past 50 yrs, but also no reason to overestimate our level of confidence in solar physics understanding, still low to medium. They are many debates in solar physics community but 99% of solar specialists interested in climate do not think the TSI could have a warming influence on Earth for cycle 21-23 (I think the 1% is Scafetta alone :-)). So, LR08 and FR11 are not in question for their major conclusion. #12 Who is "clinging to UV as a significant cause of global warming"? Certainly not me, you should not be so "warming-centered" in your interpretations. I think the following sentence in the article "Any solar effect (either direct or indirect) which is correlated to solar activity (i.e. solar irradiance, solar magnetic field [and thus galactic cosmic rays], ultraviolet [UV] radiation, etc.) is accounted for in the linear regression" is not enough precise. If you look for example at Harder et al 2009 , figure 1, giving results for the SIM-SORCE instrument (=measurement of spectral irradiance), you observe that changes in the different bands are sometimes orthogonal (200-400 nm bands = UV are down whereas others in visible or near IR are up). So I think the linear regression used by LR08 informs us about TSI (what is de facto linearily regressed in regards of T), but not specially about particular components of this total irradiance. Maybe I'm wrong, I'm not familiar with statistics (nor solar physics by the way). If you agree with me (with the papers I linked) that spectral and total irradiance are not necesseraily correlated in a cycle (or in trend of cycles), this is just a suggestion for a more precise formulation. Feel free to ignore it if unsound. -
Bob Lacatena at 08:28 AM on 12 January 2012Why does CO2 lag temperature?
exp137,...there doesn't appear to be much input from CO2 at all.
No? What about the fact that the glacial onset takes tens of thousands of years longer than a termination, because the orbital forcings/change in albedo are fighting against rather than in concert with CO2 changes? Another factor, of course, is one of pure area... on a sphere (the earth), there is more area at a latitude closer to the equator than a pole, and the sunlight is more direct and seasonally constant towards the equator, with the upshot that albedo changes are stronger when the ice sheet is further south. This in turn means that when the ice begins to retreat (during a termination), the strength of change in albedo is greater and faster at the beginning of the change than at the end as compared to the reverse, the growth of ice from the pole southward, when the growth (in area) is slow at first with a greater affect near the end. A model for the relative influences cannot possibly be as simple as you'd like, but one problem is exactly that you are eyeballing graphs and using a rule-of-thumb approach to the problem. It's easy to come up with any inference that appeals to you with that approach. To go over the glacial onset... orbital forcings cause summers to be shorter and cooler. This leads to a very, very slow build up of the snow and ice extent in the northern hemisphere. Each year, the snow melts not quite as far back as it did the winter before. Each time this happens, the total amount of sunlight reflected back to space without warming the planet is greater. At first, the difference is small, because the change happens at a high latitude. The total change in area is small, and the angle of incidence and W/m2 is less because of how the light strikes the earth at the poles. As the ice sheets extend further south, the effect becomes more and more severe. As temperatures drop due to this forcing, the amount of CO2 (and H2O) in the atmosphere falls, which causes temperatures to drop even further. There is no inconsistency in this. -
exp137 at 07:41 AM on 12 January 2012Why does CO2 lag temperature?
scaddenp: I don't expect the temperatures to not drop at all, it's just that in the case of glacial cycles there doesn't appear to be much input from CO2 at all. This is a frequently used case by climate change skeptics that CO2 is not a climatic driver (or a very weak one at best) but instead simply follows temperature. I'm familiar with other cases in which CO2 does appear to drive temperature, such as the PETM and the Ordovician glaciation, but I just would like to understand this case better. I guess what I'm really looking for is a model that shows the relative influences of both insolation and CO2 during the Pleistocene glaciations. Because in this case, at least, it's obvious that changing solar input is the primary driver, but the role of CO2 isn't very clear. -
scaddenp at 07:31 AM on 12 January 2012Myth of the Mini Ice Age
James, I think moderator patience with off-topic posts (nothing to do with the topic of this post). I suggest that you make any further response here - its aerosols. A few seconds with the search function on top left is best way to find appropriate threads. -
Riccardo at 07:22 AM on 12 January 2012Positive feedback means runaway warming
William Haas in climatology by runaway warming (or cooling) one does not mean an endless warming (cooling) like what you get mathematically from the feedback factor f=1/(1-g) for g~1. Usually it indicates that above a certain threshold the process will not end untill the system finds a new equilibrium in a radically different state. The feedback factor quoted above is just a first order aproximation which has, by definition, limited validity. When the response becomes large, higher order terms need to be taken into account. More details here. -
Rob Honeycutt at 07:20 AM on 12 January 2012Human CO2 is a tiny % of CO2 emissions
pbjamm... WOW! I was trying to find a link to Norville Barnes in the Hudsucker Proxy saying "WOW!" but alas... -
pbjamm at 06:52 AM on 12 January 2012Human CO2 is a tiny % of CO2 emissions
Was not sure where else to post this. The (evil/job destroying) EPA has a GHG Data Page. Pretty nifty. If this has made an appearance on SkS before I have missed it. -
scaddenp at 06:15 AM on 12 January 2012Global Warming: Trend and Variation
QE - even natural variations must still obey the laws of physics. If you think current warming is natural, then where is the extra heat coming from? If the heat is from ocean, then why is ocean heat content increasing? If you wish to discuss further, then please go to Its a natural cycle. -
scaddenp at 06:09 AM on 12 January 2012Why does CO2 lag temperature?
exp137 - if two of the forcings go negative while GHG remain stable, then why would you expect temperature not to drop? Explicitly, when onset occurs, direct insolation from sun is dropping in NH (cooling), while CO2 concentration are possibly still rising - but very slowly as there is a considerable lag. On the other hand, ice albedo is a rapid feedback and the two together drop NH temperatures, freeze the methane sources, cool northern oceans which in turn leads eventually to lower CO2 and SH cooling as well. -
muoncounter at 05:42 AM on 12 January 2012Global Warming: Trend and Variation
QE#64: Yes, the tide is a natural variation. The point here is that the trend (analogous to the rising tide) may sometimes be obscured by the noise (individual waves). If, after seeing a particularly strong wave reaching far up the beach, subsequent waves are smaller, it would be a grave mistake to say 'the tide isn't rising any more.' Another mistake is choosing to look only at the retreating waves and conclude 'its not rising.' Or look at the rising tide and say 'its cosmic rays' or some other such nonsense. End of analogy. What was your question? -
Global Warming: Trend and Variation
QuestionEverything, the example has nothing to do with distinguishing natural vs. man made. What it's illustrating is that you have to pay attention to timescales when claiming whether something is a long-term trend. On the scale of seconds, the waves can be considered a trend. On the scale of hours, the tide is a trend and waves are just short-term fluctuations. On the scale of days, the tide becomes short term variation. None of this tells us whether tides are natural or not. We know they are because we understand the physics behind tides, not because they happen to be periodic. There is no law that states that natural variations must be periodic or vice versa. The point is that we need to look at the appropriate timescale. When it comes to human well-being, that timescale is on the order of a human lifetime, i.e. multiple decades. On that scale, the data is clear: the earth is warming. -
exp137 at 05:38 AM on 12 January 2012Why does CO2 lag temperature?
muoncounter#52: I've read the article, but it focuses exclusively on the timing of the termination as opposed to the onset. I'm very comfortable with the reasoning behind the lag at the termination, but still curious about the lag at the onset. If you look at the last interglacial period (before the current one) in Fig. 1, the temperature has dropped rather significantly while the CO2 concentrations are still largely above 270ppm. While the cause of the glacial onset may indeed be orbital forcings, does this really mean that the imfluence of CO2 on the glacial-inerglacial cycle is essentially neglegible? Or is it that the high levels of CO2 essentially "soften the blow" of the orbital forcings, by slowing the onset of the next glacial period? Please don't assume I'm a skeptic or unfamiliar with the basics just because I'm asking questions, as I am currently a graduate student studying paleontology. This is an argument I've heard from skeptics in the past and I'd like to find a solid explanation, if one is known. -
DSL at 05:36 AM on 12 January 2012Global Warming: Trend and Variation
QE: snort! If we push the analogy, we'll have to introduce something large gradually forcing a the water line to trend upward even as the tides cycle. Perhaps the underwater growth of the Kraken or a v e r y s l o w m o v i n g a s t e r o i d. Perhaps the displacement of the growing billions of boats on the water, all rising with the unlimited bounty of capitalism. -
QuestionEverything at 05:03 AM on 12 January 2012Global Warming: Trend and Variation
So if the observer stayed on the beach for several days, he would eventually realize that what he had mistaken for a trend was actually a natural variation, i.e. the tide. -
keithpickering at 04:53 AM on 12 January 2012Climate Change Denial and the Media - Banishment of Science Reality
TYPO: Linked article s.b. "How to assess evidence ..."Response:[dana1981] Corrected, thanks.
-
Fred Staples at 04:30 AM on 12 January 2012Skepticism About Lower Atmosphere Temperature Data
“However, the most likely explanation for UAH showing less warming than models and atmospheric physics predict is that UAH is biased low? ”. Really? If we go to the Met Office HADAT site we will find a detailed comparison of MSU and HADAT data by RSS. Their figures are interesting because they compare mid-troposphere radio-sonde data with satellite data from 1978. The perturbation of the lapse rate on which AGW depends must start in the mid troposphere, where additional CO2 can make its presence felt. Satellite data is global, whereas the radio-sonde is not, and it is particularly sparse in the Southern hemisphere. To compensate, RSS sampled the satellite data to match the radio-sonde locations, and calculated matched data trends as follows: Mid-troposhere: HADAT 1.08 degrees per century RSS 1.35 degrees per century UAH 0.95 degrees per century But what about the lower troposphere? HADAT 1.95 degrees per century RSS 1.7 degrees per century UAH 1.76 degrees per century. So the satellites are not significantly lower than the radio-sondes, and their global figures should be respected as the best available. The crucial data is for the global mid-troposhere, where UAH quotes 0.5 degrees per century. For the lower troposphere the UAH trend is 1.4 degrees per century. These figures neatly reverse all the model data for mid versus lower troposphere trendsStill, if the facts do not agree with the theories, so much the worse for the facts.Response:[DB] "These figures neatly reverse all the model data for mid versus lower troposphere trends"
Please provide a source citation for this assertion.
Inflammatory/trolling struck out.
-
Gestur at 04:07 AM on 12 January 2012Lean and Rind Estimate Human and Natural Global Warming
dana1981 @ 5: Re your point about the model’s estimated changes, according to the data provided by LR08 (Table 1), the model over-estimates the actual temp change by 16% for the 25 year period, over-estimates it by 20% for the 50 year period and under-estimates it by 11% for the 100 year period. Given the considerable uncertainty in the temperature change itself, not to mention in some of these components other than athro forcing, maybe taking the point estimates of each and using them to express model variable impacts as a percent of actual temperature change, as you have done, causes more confusion than it provides insights. Of course, you hear this same thing in effect done fairly frequently and I’d personally say to good rhetorical effect. But for a more rigorous summary, maybe the way to go would be to use some bootstrapping of the model—including these post-estimation calculations—to show the full uncertainties in these percentage attributions. Thanks for another good post, though. -
muoncounter at 03:05 AM on 12 January 2012Why does CO2 lag temperature?
exp137#51: Read through the original post, especially the mechanism given after Figure 2. The temperature change is initiated by orbital variation and reinforced by atmospheric gas concentrations. It's important to understand the time frame when you say "temperature starting to fall very abruptly". That is really not the case: glacial onsets are typically much slower than terminations (see Figure 1 and note the time scale). Terminations can take 100s-1000s of years; cooling to full glacial is much slower. The temperature graphs take on a 'sawtooth' shape. --source
-
dana1981 at 02:55 AM on 12 January 2012Lean and Rind Estimate Human and Natural Global Warming
I have to say, clinging to UV as a significant cause of global warming at this point isn't skepticism, it's desperation. There's just no evidence for it. -
JamesWilson at 02:40 AM on 12 January 2012It's aerosols
Rob Painting you got the right graph from here(http://www.skepticalscience.com/Why-The-Hottest-Decade-Was-Not-Hotter-.html). Quoting "After a rapid rise in global surface air temperatures during the late 1970s to 1990s" Notice that the Sulfur emissions are higher in 1980 than they are today. ie if Sulfur emissions reflect sunlight then we should have been freezing in 1980 and cold today. Not the other way around. ie that graph blows the premise of the article. As for CFC thing it had the other forcing value in 2007 according the IPPC however it has been scrubbed apparently. I'll see if I can find a link on it to show it. Until then I won't discuss it further. I did find this link which claims CFC cools in the upper atmosphere. http://www2.ucar.edu/climate/faq under Ozone. As a side note in the same section they claim that that "This paradox occurs because the atmosphere thins with height, changing the way carbon dioxide molecules absorb and release heat." I have never seen a physics experiment that shows that temperature and/or pressure effects the way CO2 absorbs and releases heat. Nor CFCs for that matter. A plausible claim again with no proof I've seen. I like your links scaddenp. The Aerosol one doesn't clearly prove that aerosols actually reflect any light from a physics perspective. The crux sentence seems to be here "Here we use state-of-the-art satellite-based measurements of aerosols6, 7, 8 and surface wind speed9 to estimate the clear-sky direct radiative forcing for 2002, incorporating measurements over land and ocean" The satellites are used to measure the amount of aerosols *not* the amount of reflection by them. Notice the word "estimate." It doesn't mean Aerosols don't reflect light. Just that article doesn't prove that property. Not wrong just not proof. To give an analogy. Measuring forcing from the quantity of aerosols present and known atmospheric behavior would be like trying to figure out the speed of a bus by knowing the velocities and locations of the air molecules around it. You might get an reasonable result, but it probably would be a lot more accurate to measure the speed of the bus itself.Response:[DB] Note: This comment was moved from the Myth of the Mini Ice Age thread to this one, where it is much more on-topic.
-
Lean and Rind Estimate Human and Natural Global Warming
skept.fr - "...this point of TSI-UV-EUV correlation, albeit probably marginal or null in terrestrial temperature trend, is still in debate among solar scientists." (emphasis added) That, the emphasized portion, is a critical point - the largest part of solar variance seems correlated with TSI (or sunspots - Foster and Rahmstorf 2011 found no significant difference when substituting sunspot number for a TSI index). And once the major contributors to temperature change are identified we gain a better understanding of climate - some ability to predict future temperature evolution. The results in Lean and Rind 2008/2009, Foster and Rahmstorf 2011, and others - these all indicate that we have a pretty good grip on the major influences behind climate change. Other influences are certainly there, with varying degrees of uncertainty - but they appear quite small. While small changes around the edges are interesting, and quite worthy of research effort, we really do know what the elephant in the room is - anthropogenic greenhouse gases. -
DSL at 01:27 AM on 12 January 2012Ten temperature records in a single graphic
Retro, it was difficult for me because it's the kind of disaster that doesn't develop at "human speed." The boiling frog analogy applies to a certain extent. The average world citizen non-scientist has to take it on faith that the consequences are serious or spend a lot of time becoming familiar with the basics (which requires retirement, unemployment, being single, owning the means of production, or having a certain type of job). It's hard to take it on faith or even understand the basics with mass media trying to turn it into a commodity by making a debate out of it--and institutions like Heartland that are openly dedicated to creating unskeptical doubt. -
DSL at 01:07 AM on 12 January 2012There is no consensus
The Bulletin of Atomic Scientists just moved the Doomsday Clock one minute closer to midnight (11:55). Meaningless to the science, but something worth noting anyway within the domain of climate science communication. From the report in the Guardian: "A number of the scientists who took part in the deliberations said they were also dismayed by a growing trend to disregard science." "On climate change, the scientists warned the global community may be reaching a point of no-return unless there is a push to begin building alternatives to carbon-heavy technologies within the next five years." -
exp137 at 01:00 AM on 12 January 2012Why does CO2 lag temperature?
Not sure if I'm too late to get a response, but I have another question regarding the lag. I understand that cause for the lag at the initiation of warming, but it appears that in every case, as the climate shifts back to a glacial period, the temperature drops while the CO2 is still near it's peak concentration, with the temperature starting to fall very abruptly before the CO2 even begins to decline. Is there any explanation for that? -
catamon at 00:53 AM on 12 January 2012Just Science app shows climate change is happening in pictures anyone can understand
No Android version?? Sniff, whimper?? -
skept.fr at 23:24 PM on 11 January 2012Lean and Rind Estimate Human and Natural Global Warming
#6, 8, 9 : this point of TSI-UV-EUV correlation, albeit probably marginal or null in terrestrial temperature trend, is still in debate among solar scientists. For example, see Frölhich 2009 : long term trends of TSI and UV seem to differ, the minimum of TSI for 2008 did not produce a similar minimum in UV irradiance. -
MarkR at 23:13 PM on 11 January 2012Water vapor is the most powerful greenhouse gas
119. William Haas; Air temperatures are linked to sea surface temperatures pretty strongly, and higher temperatures mean a higher water vapour content in the atmosphere. Satellites measure a pretty constant relative humidity, so it suggests this is true. You asked in another thread about the GWP of water vapour. Global Warming Potential is defined as the integrated heating caused by a molecule over some time: typically 100 years after you've added it to the atmosphere. Water vapour's mean life is about 10 days in the atmosphere. Iirc, on a molecule-per-molecule basis, largely due to saturation, water vapour is weaker than CO2 by an order of magnitude or two. So the GWP of a water vapour molecule could be estimated as between 0.00003 and 0.000003 relative to CO2. However, this is an overestimate because water vapour evaporates and condenses. It will condense in the upper atmosphere, releasing heat which 'short circuits' a chunk of the greenhouse effect. The water vapour feedback is reduced by about half by this, so you're more likely looking at water vapour molecule = 0.000001 CO2 molecule. That's only water added by combustion and volcanoes etc: water vapour from the ocean is constrained by temperatures and can't act as a long term forcing. -
RetroC927 at 21:44 PM on 11 January 2012Ten temperature records in a single graphic
I still struggle and fight with myself about global warming and the science behind it. It's hard to argue with the science and impact though. Theoretically it is very simple what is happening and what our actions are causing. The question, the debate, the argument is how much this is exacerbating this or conversely how much this would naturally occur and happen anyway without us.Moderator Response: See the Skeptical Science posts "It’s not us" and "It’s a natural cycle." -
Paul D at 21:39 PM on 11 January 2012Just Science app shows climate change is happening in pictures anyone can understand
Would be interesting to incorporate the Skeptical Science 'Interactive History of Climate Science' app (or a variation of it) with this one. Maybe as a visual that is shown in a box at the same time or can pop up on demand. -
Rob Painting at 21:28 PM on 11 January 2012Just Science app shows climate change is happening in pictures anyone can understand
Is it intentional that the narrator sounds like Stephen Hawking's computer voice? Great work on the app though. -
Tom Curtis at 20:26 PM on 11 January 20122012 SkS Weekly Digest #1
I note that chirhophoros recent post has been deleted for moderation complaints, as had a previous comment. In light of the requested discussion of the comments policy above, I believe his comments where on topic on this thread, and that deleting comments critical of the comments policy or its administration on this thread is counterproductive to the aim of gathering a proper range of feedback. I understand that moderators are rightly cautious against the possibility that the aim of legitimate discussion of the comments policy may be used as an excuse for straightforward trolling. Never-the-less I believe it would be better if chirhophoros posts where restored. Regardless of the moderators decision, I should note that chirhophoros' examples where noted, and that several moderators have expressed a desire for more impartial administration of the comments policy in private conversation, thereby correcting any slippage from the normally very high standards of SkS moderation. chirhophoros and other readers should certainly not read into the enforcement of the comments policy on this thread any idea that his criticisms have simply been swept under the carpet. They have not been.
Prev 1351 1352 1353 1354 1355 1356 1357 1358 1359 1360 1361 1362 1363 1364 1365 1366 Next


