


 Arguments


Recent Comments
Prev 1383 1384 1385 1386 1387 1388 1389 1390 1391 1392 1393 1394 1395 1396 1397 1398 Next
Comments 69501 to 69550:
-
AnotherBee at 23:14 PM on 24 November 2011Arctic Sea Ice Hockey Stick: Melt Unprecedented in Last 1,450 years
Kevin C - I suspect that your recollection is wrong, or, at least, misleading. The narrative we remember for the Viking Greenland settlements goes "The Vikings farmed Greenland, therefore it must have been much warmer. Later the settlements got buried under glaciers." The first part of that is correct, but the rest of the narrative is wrong. They did farm, but they farmed in two settlements in limited coastal fringes, and it was worse-than-subsistence farming (because the farming and building eroded the fragile top-soil). The same sort of farming seems to have been possible for much of the intervening time, therefore the farming cannot be taken as direct evidence of warmer conditions. The Viking settlements did not get buried under glaciers (google Hvalsey Church). One got burried under wind-blown sand. Thus the failure of the settlements cannot be taken as direct evidence of cooler conditions. -
adelady at 22:56 PM on 24 November 2011Economic Growth and Climate Change Part 1 - Factors Influencing CO2 Emissions
perseus, one of the main reasons for the disproportion in male/female births is selective terminations. One of the main objectives of a focus on later family formation is that it actually requires a higher valuation of women's work and worth before general social and economic improvements. So instead of sitting back and waiting for better health and increasing prosperity to advance the causes of lower birth rates and improving women's status, you do the status and education first. And this always leads to better health for children and the community at large. Hey presto. Fewer children born further apart and all much healthier than before. There's at least one program working very well in Africa where the focus is on education for girls and later marriage for both men and women. One surprising outcome of this, then not so surprising when you think about it again, is that the boys are tremendously relieved that they don't have to take on the burdens of providing for a family as soon as they leave school. Everyone wins. -
Arkadiusz Semczyszak at 22:48 PM on 24 November 2011Arctic Sea Ice Hockey Stick: Melt Unprecedented in Last 1,450 years
As usual: "shortcuts" (even for the post - definitely “too big”). If the authors in the abstract of their work they put such a statement : „... although extensive uncertainties remain, especially before the sixteenth century ...” It is worth mentioning … although. Of course, the authors mainly say that: „...both the duration and magnitude of the current decline in sea ice seem to be unprecedented for the past 1,450 years.” but they add that there are doubts - the margin of error. “... and may result from nonlinear feedbacks between sea ice and the Atlantic meridional overturning circulation. These results reinforce the assertion that sea ice is an active component of Arctic climate variability and that the recent decrease in summer Arctic sea ice is consistent with anthropogenically forced warming.” - write Kinnard et al. 2011. Granted, with the addition that this is not limited to: „recent decrease” and „anthropogenically forced warming.” Kaufman et al., 2009 argued that: in the period between 5600 and 3600 years BP (0 BP = calendar year 1950) energy flows in summer (JJA) at 65°N was reduced by 7.1 W • m-2 - demonstrating the fundamental role orbital factor in creating the natural decreasing trend in Arctic temperatures. The Earth now began to "orbit" closest to the Sun during the year in January - instead of in September as it did 7 thousand. years ago ... So for the past thousands of years in the summer months, gradually decreased the intensity of sunlight “arriving” at the Arctic. Summer Arctic became cooler at a rate of 0.2°C per thousand years. It should be noted however that this trend was many times interrupted for 200 years and even 400 years (by the trend positive) just through: „... nonlinear feedbacks between sea ice and the Atlantic meridional overturning circulation ...” - changes in amount of heat transported to the Arctic along Atlantic waters. We do not know precisely reasons for these historic natural disturbances. Spielhagen et al., 2011.: “Northward-flowing Atlantic Water is the major means of heat advection toward the Arctic and strongly affects the sea ice distribution. Records of its natural variability are critical for the understanding of feedback mechanisms and the future of the Arctic climate system, but continuous historical records reach back only ~150 years.” "Disturbances" trend can be so natural, and the current unprecedented "disturbance" questionable. The Kaufman “unprecedented” - it was one of the biggest disputes in science in recent years.Response:[DB] The prudent reader will note that in this discussion of Arctic Sea Ice (being by definition at sea level) Arkadiusz introduces a common "skeptic trick"/technique of introducing data from a local ice core in Greenland to "muddy the waters". The issue, beyond the core data representing but a single geospacial location and thus by itself not representative of the whole (and much larger) region in which it resides, is that the core is near the Greenland summit (in order to get the deepest profile of the ice possible) and therefore at an elevation of over 2 miles above sea level.
Permissum lector caveo (let the reader beware)...
-
Rob Painting at 22:24 PM on 24 November 2011Arctic Sea Ice Hockey Stick: Melt Unprecedented in Last 1,450 years
Kevin C - This global map is from Mann (2009) and is compared to a 1961-1990 baseline. Much of the present summer sea ice retreat seems to be from warm Atlantic water moving into the Arctic and getting at the ice from below. There's simply much, much more warm water available in the Atlantic today. Both Kinnard (2011) and Spielhagen (2011) show this anomalous ocean warming.
-
Kevin C at 22:01 PM on 24 November 2011Arctic Sea Ice Hockey Stick: Melt Unprecedented in Last 1,450 years
Yes, I was surprised. I had it in my head that there was real evidence of Greenland being significantly warmer at some point during the MCA, although the effect was localised. Does this mean that it was sufficiently localised not to cover the arctic too, or is my recollection wrong? -
perseus at 21:51 PM on 24 November 2011Economic Growth and Climate Change Part 1 - Factors Influencing CO2 Emissions
Kevin I doubt a 'zero' carbon economy will be as easy as you suggest. It will get progressively more difficult and expensive as renewable penetrations become higher, 'carbon leakage' becomes significant and we obtain diminishing returns from improving thermodynamic efficiencies further. I fear that in placing all our eggs in the same environmental technology basket we risk the same over optimism as when we predicted 'cheap' nuclear energy, routine space flight and artificial intelligence. I'm not saying these won't happen eventually but we need to combat AGW now to avoid tipping points, and our best chance is to tackle it on several fronts. Good points in posts 4 and 5. However, austerity tends to be relative not absolute. We already have more than enough in the developed world. It is hardly unreasonable to expect people to avoid waste and excess and a great deal of our GDP is just that, it adds little of true value but creates environmental problems. Even the so called green technologies can generate pollution especially if it is done on the cheap: pollution casts shadow over Chinese solar rare earth metals technology boom Yes carbon is not the only issue, we live on a finite earth with limited resources and sinks, perhaps we also have a responsibility to other species as well and the more we consume the greater stress we place on these habitats. -
chriskoz at 21:50 PM on 24 November 2011Arctic Sea Ice Hockey Stick: Melt Unprecedented in Last 1,450 years
WUWT claims that "during the peak of MWP glaciers were smaller than today" found here does not apply to arctic with very high certainty. Interesting to note, that on the graph above, arctic ice looks on average larger during peak WMP (1000-1300AD) rather than for LIA (1550-1850AD), although probably not statistically signifficant. Still, from that observation with counter-intuitive outcome, we can say that both MWP and LIA were local events while arctic ice could have enjoyed different conditions. -
bill4344 at 21:18 PM on 24 November 2011Arctic Sea Ice Hockey Stick: Melt Unprecedented in Last 1,450 years
The BEST confirmations, Climategate 2.0 looking like a squib, and now yet another bloody Hockey Stick! Not looking to be such a festive season for some, is it? ;-) -
MA Rodger at 21:00 PM on 24 November 2011Arctic Sea Ice Hockey Stick: Melt Unprecedented in Last 1,450 years
The "Ice Hockey Stick." Startling stuff but are we truly surprised? -
CBDunkerson at 20:49 PM on 24 November 2011The Debunking Handbook Part 4: The Worldview Backfire Effect
Shibui, 'skeptics' seem to be able to believe just about any nonsensical thing... so sure, I suppose they could see the hockey stick as 'confirmation bias'. It just wouldn't make any sense given that it has been replicated by numerous studies, analyzed and confirmed by the NAS, and even matched by a few 'skeptic' analyses that set out to disprove it. All of which demonstrates the very opposite of confirmation bias, but that isn't going to stop 'skeptics' believing otherwise. -
Rob Painting at 20:00 PM on 24 November 2011Climategate 2.0: Denialists Serve Up Two-Year-Old Turkey
Tom Curtis @ 12 - that brings back memories. Is that now a "skeptic" training video? -
perseus at 19:25 PM on 24 November 2011Economic Growth and Climate Change Part 1 - Factors Influencing CO2 Emissions
Yes perhaps we should stick closer to the topic. Adelady. Yes there are other factors affecting population growth. In India the low proportion of females to males born is yet another, which will of course reduce population growth. However, it is notable that all of the methods if overdone could lead to social or economic instability in later years. -
Shibui at 19:08 PM on 24 November 2011The Debunking Handbook Part 4: The Worldview Backfire Effect
Don't John or Stephan feel that the Hockey Stick could be seen by sceptics as an example of Confirmation Bias? -
Tom Curtis at 17:58 PM on 24 November 2011Climate sensitivity is low
Eric (skeptic) @245, the rapidity with which a system adjusts to a new equilibrium depends not just on thermal inertia, but also on the magnitude of the disequilibrium. With the enhanced greenhouse effect, the disequilibrium is small, being approximately 1 W/m^2. This is because of both the small initial perturbation and the fact that the full effects of positive feedbacks are not felt until the system approaches the equilibrium temperature. In contrast, in the model analyzed by Lacis et al, the initial perturbation is around 30 W/m^2. Consequently the system adjusts towards equilibrium much faster because of the much larger disequilibrium. Even so, as skywatcher @246 points out, the system has still not reached equilibrium after 50 years. Further, Lacis et al state that they use the Q-flux ocean model with a 250 meter mixed layer depth. Had they used a model with deep diffusion, time to equilibrium would have been significantly extended (by a few centuries, I suspect), but the early changes of the system would have been unaffected. It just would have taken longer to close the last 0.1 W/m^2 of disequilibrium. -
skywatcher at 16:32 PM on 24 November 2011Climate sensitivity is low
Depends what you call equilibrium Eric - the temperature units on the Lacis diagram are pretty large, and it clearly hasn't reached perfect equilibrium even after >50 years. Why you suggest it supports a 10 year equilibrium mystifies me. From the diagram the change has reduced to being relatively slight after ~25 years, but equatorial regions are still cooling after 50 years. -
Tom Curtis at 15:22 PM on 24 November 2011Newcomers, Start Here
Eric (skeptic) @151, no it means it is a very weak positive feedback. By reducing the difference between polar and tropical temperatures it makes the escape of energy from Earth less efficient. Because the energy escape is less efficient, the global means surface temperature must be higher for the same amount of energy to escape. However, this effect is so small (for the temperature changes involved) that it is extremely dubious that it could be detected against background noise in the coming century. -
Eric (skeptic) at 15:19 PM on 24 November 2011Newcomers, Start Here
No, it's a positive feedback (less uneven -> less radiation -> more warming) -
Eric (skeptic) at 15:17 PM on 24 November 2011Newcomers, Start Here
Tom, you said "Bodies with very uneven temperatures radiate heat far more efficiently than bodies with very even temperatures." Does that mean that polar amplification (makes temperatures less uneven) is a negative feedback? -
Eric (skeptic) at 15:08 PM on 24 November 2011Climate sensitivity is low
A quote from the Climate-time-lag.html article: "How long does the climate take to return to equilibrium? The lag is a function of climate sensitivity. The more sensitive climate is, the longer the lag. Hansen 2005 estimates the climate lag time is between 25 to 50 years." While reading through Lacis et al regarding CO2 as a control knob, I noticed this diagram

Taking less than 10 years to cool to equilibrium suggests a short lag. That is for full removal of CO2, etc and I don't know if the time constant would be different for a change in CO2. But if the lag time is much shorter than the 25 to 50 years suggested above, then climate sensitivity is also lower than estimated by Hansen.
-
Tom Curtis at 15:02 PM on 24 November 2011Newcomers, Start Here
Eric (skeptic) @146, yes, imthedragon's point @141 is correct, if easily misinterpreted. In the absence of an atmosphere and ocean to both retain heat due to their heat capacity, and to spread heat around due to the motion of winds and currents carrying heat from the tropics to the poles (and to a much lesser extent, from day side to night side, the Earth would suffer similar diurnal temperature variation to that encountered on the moon, ie, between -157 degrees C and 100 degrees C. Instead of that 257 degree C range, we have diurnal temperature ranges of between 5 and 30 degrees C (approximately), and that is almost entirely due to the capacity of the atmosphere and ocean to absorb and retain heat. What is more, that capacity also warms the Earth. Bodies with very uneven temperatures radiate heat far more efficiently than bodies with very even temperatures. For example, even though the effective temperature of the moon, ie, the temperature it would need to be to reradiate the energy absorbed from the sun to space if it was all one temperature, is around 380 degrees C, its blackbody temperature is actually 270 degrees C. The difference is due to the very uneven temperatures on the moon. However, this has nothing to do with the 33 degree C difference between Earth's effective temperature and its mean surface temperature. If the Earth was of uniform temperature with no greenhouse effect, its surface temperature would be 255 degrees K. As the Earth's temperature is not entirely even, it would actually be slightly lower than that, a fact often ignored for simplicity. But without the greenhouse effect, the surface temperature could not be raised above the effective temperature, let alone by the 33 plus degrees that it has been raised. So, yes, the atmosphere apart from the greenhouse effect makes the Earth's surface temperature stable. And yes, the greenhouse effect does nudge the temperature higher. But the 33 degree K (12%) nudge is more than just a bit, and indeed is absolutely crucial to the possibility of life on Earth. -
adelady at 14:15 PM on 24 November 2011The Debunking Handbook Part 4: The Worldview Backfire Effect
Steve, I wouldn't put Myers approach to humiliation on the same footing as your 'concern trolls'. I'm not fond of humiliation as a teaching, tutorial or discussion technique, but I know it has many adherents and a long, not-so-glorious history in universities. It's an extension of not suffering fools gladly. Probably marginally useful in training where people are looking to enter professions (in medicine or the military for instance) where clear thinking and rapid judgments can be crucial. I see it as a form of intellectual bullying. Mainly because it tends to become an habitual, charmless style rather than an occasional startling wake-up call. It's only saving grace is that it's honest. The same cannot be said for the 'concern trolls'. Where I see such interventions in discussions, I'm prepared to bet my wardrobe that it's the thin end of a wedge which generally finishes up going in a very unpretty direction. -
Eric (skeptic) at 14:13 PM on 24 November 2011Newcomers, Start Here
I think I can answer one of my questions. Pressure broadening in wikipedia is "Impact pressure broadening: The collision of other particles with the emitting particle interrupts the emission process, and by shortening the characteristic time for the process, increases the uncertainty in the energy emitted (as occurs in natural broadening)[3]. The duration of the collision is much shorter than the lifetime of the emission process. This effect depends on both the density and the temperature of the gas." Apparently the heating of the rest of atmosphere by GHGs is one part of pressure broadening. Then the other effect of the rest of the atmosphere is stability from thermal inertia. Both imthedragn and I may have been conflating warming and stability. -
Steve L at 13:56 PM on 24 November 2011The Debunking Handbook Part 4: The Worldview Backfire Effect
Question: Those of us most interested in the science are upset about political attacks on science and personal attacks on scientists. It happens that a lot of those attacks come from members of given political parties and people with strong political leanings, so a lot of us might identify those parties and leanings as being our enemies. Does this simple identification hurt our chances? Scientists may say, "The world is very likely X and it is very unlikely Y." Then someone jumps in from Political Group A and generalizes on the basis of their own conservation bias, "Yeah, those stupid Political Group B people are all idiots and deny logic and science." Are these people hindering progress by increasing the defensiveness with which anyone who identifies with Political Group B will approach the topic? Should we be trying to censor such supporters of science? Should we censor ourselves when identifying groups who resist the finding that "The world is likely X" and inhibit the dissemination of that finding? To make this 'real' in the context of internet discussions, are the 'concern trolls' correct about tone? Is PZ Myers wrong about the value of humiliation? -
Eric (skeptic) at 13:56 PM on 24 November 2011Newcomers, Start Here
Thanks skywatcher, I read the paper, but it merely repeats Tom's explanation about pressure broadening (as shown in Tom's diagram above). Is the lapse rate responsible for the 33C GH effect? If so, are changes lapse rate caused by uneven pressure broadening of increased CO2 (with more broadening at the bottom)? Seems like a valid but only partial explanation. What about heat transferred from CO2 to O2 and N2? I do not believe that can be ignored for both stability and warmth. -
jimb at 13:53 PM on 24 November 2011Economic Growth and Climate Change Part 1 - Factors Influencing CO2 Emissions
Back to the issue of economic growth influencing CO2 production, a headline in our local business section says "Oilsands output could triple by 2035", citing a report by the National Energy Board (Canada). Included in the article was a comment from the Pembina Institute that the government had to address mounting environmental challenges if Canada was to reach its 'energy potential'. So far it seems that economic growth is the main consideration. -
muoncounter at 13:30 PM on 24 November 2011Economic Growth and Climate Change Part 1 - Factors Influencing CO2 Emissions
MA Rodger#19: "Hansen & Sato 2004 see the wobbly soak-up rate as important enough to spend one page of a six page paper discussing it." Not so much. Here's H&S' main point on that question: Year-to-year fluctuations of atmospheric CO2 growth must reflect fluctuations of the land and ocean sinks for CO2 and the biomass-burning source. Most of the rest is about other GHGs. "40% is a more usual number" Is it? Again H & S: Fig. 5A shows the CO2‘‘airborne fraction,’’ the ratio of the annual increase in atmospheric CO2 to annual fossil fuel CO2 emissions. Despite large year-to-year fluctuations, the airborne fraction has been remarkably constant at ~60% of emissions during the post World War II period Nor is there any mention of ENSO or either NinX in this paper. Again, I'm not seeing the point of this wobblometry. -
skywatcher at 13:21 PM on 24 November 2011Newcomers, Start Here
Eric, on temperature stability, I'm not sure what your point is. Have you read the Lacis et al paper DB linked to inline at #141? The remaining atmosphere without GHGs can provide a stable temperature ... if you like your temperature to be stable at -21C! Given the lack of water vapour in that atmosphere, I suspect the diurnal range would be pretty brutal round the mean figures too, though cloud cover would tend to moderate it. -
bit_pattern at 13:05 PM on 24 November 2011The Debunking Handbook Part 4: The Worldview Backfire Effect
"Another way in which information can be made more acceptable is by “framing” it in a way that is less threatening to a person’s worldview. For example, Republicans are far more likely to accept an otherwise identical charge as a “carbon offset” than as a “tax”, whereas the wording has little effect on Democrats or Independents—because their values are not challenged by the word “tax”.6" Somebody should really forward a copy of this to the Labor strategists that allowed the "carbon tax" to become the commonly accepted way of referring to the policy. -
Eric (skeptic) at 12:47 PM on 24 November 2011Newcomers, Start Here
Tom, my understanding is that the CO2 more or less immediately transfers energy from outgoing IR to the rest of the atmosphere. Wouldn't that heating of N2 and the O2 raise the temperature of the atmosphere from bottom to top (more at the bottom) and thus explain the higher lapse rate? Another way to look at it is that the overall mass of the atmosphere dictates the heat capacity but additional CO2 raises it slightly. Thus I think that imthedragn's point about temperature stability (141) is valid. -
John Hartz at 12:43 PM on 24 November 2011Climategate 2.0: Denialists Serve Up Two-Year-Old Turkey
The bottom line: Hacked emails are a sideshow and cannot take away from what many business leaders already know and what the IPCC’s extreme weather report confirms. Climate change is real and we’d better buckle our seat belts for more costly extreme weather if we carry on with business as usual. Source: “IPCC Report Confirms What Businesses Already Know: Extreme Weather & Climate Change Has Economic Impacts” by Mindy Luber, President of CERES, Forbes, Nov 23, 2011 Click here to access this article. -
Rob Painting at 12:27 PM on 24 November 2011Economic Growth and Climate Change Part 1 - Factors Influencing CO2 Emissions
MA Rodger - sorry to butt in here, but I'm just joining in near the end of this to-and-fro. You are aware that ENSO affects atmospheric CO2 because of the extra rain that falls over land during La Nina stimulates vigorous plant growth, and cooling of sea surface temperatures? Conversely El Nino warms the sea surface (particularly the equatorial Pacific) which increases CO2 outgassing from the ocean, and the marked drying of the tropical basins diminishes plant growth, and therefore they too give up CO2 to the atmosphere. Volcanic eruptions tend to ramp up CO2 uptake by land-based plants because the diffraction of sunlight enables light to better penetrate the forest canopy. If none of this has anything to do with what you guys are debating, please disregard. -
Tom Curtis at 12:05 PM on 24 November 2011Newcomers, Start Here
Sphaerica, with respect, I believe your explanation @143 is incorrect. Placing imthedragon's question into context, the Earth's atmosphere contains just 8% of the CO2 contained by Mars'atmosphere. Further, CO2 provides approximately 20-25% of the greenhouse effect on Earth, or about 7 degrees C of warming. If the Earth's CO2 was doubled 3.5 times it would equal Mars' CO2, so on a simplistic view, Mars' greenhouse effect should provide about be 11 degrees warming. That is approximately double the warming it actually provides. A major reason for the shorfall is the lack of pressure broadening. Increased pressure widens the absorption band at the expense of reduced probability of absorption in the central peak.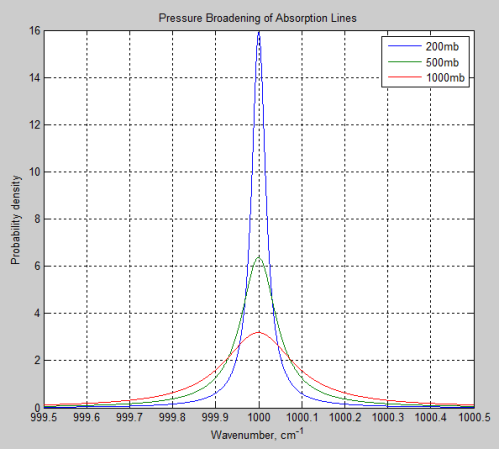 (From Science of Doom)
Because in the central peak the atmosphere of both Mars and Earth have an optical thickness greater than 1, the effect of reducing pressure is to increase the altitude of effective emission from CO2 to space. However, it also greatly reduces the bandwidth of that emission, thereby allowing far more heat to escape directly to space from the surface, thereby greatly reducing the greenhouse effect. Mars' surface pressure is 4 to 8.7 mb (depending on season), so the effect is far greater than that illustrated in the diagram above.
There are two other significant effects reducing the greenhouse effect on Mars.
The first is that the adiabatic lapse rate on Mars (4.5 degrees C per km) is less than half of that on Earth, and significantly less than the environmental lapse rate of approx 6.5 degrees C/km. By itself, this factor would reduce the strength of the greenhouse effect on Mars by about 30%.
The second is simply the other gases in the atmosphere. Given a layer of CO2 sufficiently thick to absorb all IR light in its absorption band, if we add another gas that does not absorb IR sufficient to double the atmospheric pressure, the thickness of that layer of CO2 increases. In doing so, the effective altitude of radiation of that CO2 also increases. The strength of the greenhouse effect is most simply calculated by assuming that the temperature at the effective altitude of radiation to space equals the equilibrium temperature of the planet (ie, that temperature which will result in outgoing radiation matching incoming radiation), and then deriving the surface temperature by the lapse rate. Increasing the effective altitude of radiation by adding neutral gasses therefore increases the strength of the greenhouse effect. Consequently, the large concentrations of oxygen and nitrogen on Earth increase the strength of the greenhouse effect on Earth relative to Mars, in addition to the other effects.
As a final note, while adding neutral gases does increase the strength of the greenhouse effect, they do not have a direct effect on surface temperature (other than by equalizing the distribution of temperatures). In the absence of a greenhouse gas, adding neutral gases would have no ability to raise surface temperatures above the equilibrium temperature as greenhouse gases do.
Moderator Response: I suggest adding an Argument: "Why is Mars so cold when it has so much more CO2?" Include not just these reasons, but also an explanation that (and why) the amount of energy from the Sun reaching Mars is so much smaller than that reaching Earth. And give it a link to the Mars is Warming argument.
(From Science of Doom)
Because in the central peak the atmosphere of both Mars and Earth have an optical thickness greater than 1, the effect of reducing pressure is to increase the altitude of effective emission from CO2 to space. However, it also greatly reduces the bandwidth of that emission, thereby allowing far more heat to escape directly to space from the surface, thereby greatly reducing the greenhouse effect. Mars' surface pressure is 4 to 8.7 mb (depending on season), so the effect is far greater than that illustrated in the diagram above.
There are two other significant effects reducing the greenhouse effect on Mars.
The first is that the adiabatic lapse rate on Mars (4.5 degrees C per km) is less than half of that on Earth, and significantly less than the environmental lapse rate of approx 6.5 degrees C/km. By itself, this factor would reduce the strength of the greenhouse effect on Mars by about 30%.
The second is simply the other gases in the atmosphere. Given a layer of CO2 sufficiently thick to absorb all IR light in its absorption band, if we add another gas that does not absorb IR sufficient to double the atmospheric pressure, the thickness of that layer of CO2 increases. In doing so, the effective altitude of radiation of that CO2 also increases. The strength of the greenhouse effect is most simply calculated by assuming that the temperature at the effective altitude of radiation to space equals the equilibrium temperature of the planet (ie, that temperature which will result in outgoing radiation matching incoming radiation), and then deriving the surface temperature by the lapse rate. Increasing the effective altitude of radiation by adding neutral gasses therefore increases the strength of the greenhouse effect. Consequently, the large concentrations of oxygen and nitrogen on Earth increase the strength of the greenhouse effect on Earth relative to Mars, in addition to the other effects.
As a final note, while adding neutral gases does increase the strength of the greenhouse effect, they do not have a direct effect on surface temperature (other than by equalizing the distribution of temperatures). In the absence of a greenhouse gas, adding neutral gases would have no ability to raise surface temperatures above the equilibrium temperature as greenhouse gases do.
Moderator Response: I suggest adding an Argument: "Why is Mars so cold when it has so much more CO2?" Include not just these reasons, but also an explanation that (and why) the amount of energy from the Sun reaching Mars is so much smaller than that reaching Earth. And give it a link to the Mars is Warming argument. -
MA Rodger at 12:05 PM on 24 November 2011Economic Growth and Climate Change Part 1 - Factors Influencing CO2 Emissions
@18 The links have picked up extranious characters. They are in order:- http://www.esrl.noaa.gov/psd/enso/mei/table.html http://cdiac.ornl.gov/trends/emis/meth_reg.htmlModerator Response: (Rob P) Had to excise your last link, it was messing with the page layout. -
MA Rodger at 11:56 AM on 24 November 2011Economic Growth and Climate Change Part 1 - Factors Influencing CO2 Emissions
Muoncounter @17 Hansen & Sato 2004 see the wobbly soak-up rate as important enough to spend one page of a six page paper discussing it. It is as you say but an oscillation on a rising trend but big enough to reduce annual increases by 70% in consecutive years. The causal link – high MEI will restrict ocean absorption of CO2, low MEI will assist it setting the CO2 wobble in motion. (One comment – I was surprised to see the 55% figure for CO2 remaining in the atmosphere on your second graph @14. 40% is a more usual number. I linked back to the graph's origin & CO2 data source & saw two problems. The USEIA CO2 data is a bit low but more worrying, the emissions for land use change appear not to be included in the analysis.) -
MA Rodger at 11:42 AM on 24 November 2011Economic Growth and Climate Change Part 1 - Factors Influencing CO2 Emissions
Sphaerica @16 You're asking a bit too much here. The lag (always present) is variable in length and perhaps could be due to the season the El Nino/La Nina occur in. Also the ampitude. Or whatever. That use of an index like MEI comes so close to the CO2 rises with only a starightforward linear re-scaling I fine pretty impressive. And getting a better fit would require a step into the modelling arena, a major piece of work. The “2002 on” section – I wonder that if the next El Nino sees CO2 rises passing well above 3ppm pa, those wobbles wouldn't then look so odd. Your requested 'third line' will require a mix of annual data & monthly data so this is a little more of a task than something done over a cup of tea. And I do wonder what would be gained by plotting CO2 emissions as a separate line. If this does gain a place on my to-do list, I would see more to be gained by subtracting the emissions increase to leave the wobble without the trend. (Of course, it doesn't have to be me that creates the graph when the data is available to all.) MEI data monthly CO2 data CO2 emissions – FF & cement CO2 emissions – land useModerator Response: [Sph] Links fixed. When you post links, try not to use "curly" (“curly” instead of "straight") quotes (or to copy from Word, which tends to automatically give you curly quotes). They aren't the same (to HTML) as straight quotes, and hence the problems (the "extraneous characters" were the curly quotes themselves). -
Bert from Eltham at 11:38 AM on 24 November 2011Pielke Sr. Misinforms High School Students
I wonder if Pielke would think that it would be quite acceptable for me to urinate and defecate in my or any other street. Or maybe his street or front yard. Could I just throw my rubbish anywhere I liked? Say out in the same street. Surely as I am only some miniscule proportion of any large group this would not matter? There is no linkage proved with my waste and any disease or annoyance. So if we all did this and put billions of tonnes of this waste into the environment it has absolutely no harmful effect! My body waste and rubbish are very nutritious foods for all sorts of living things such as plants and bacteria and will neatly add to productive food for all! In the middle ages people used to throw their rubbish into the street and waste ran down the gutters. It did them no harm in fact they flourished along with rats and other benign native animals. They even grew grapes in Scotland! We just do not need sanitation or clean water as it costs far too much. Anyway nature or providence will take care of it. There is no evidence that all this expenditure will make an iota of difference! All these people worried about 'pollution' are just anally retentive. They have a secret agenda for world domination by regulating our lack of anal retention. Bert -
muoncounter at 11:04 AM on 24 November 2011Economic Growth and Climate Change Part 1 - Factors Influencing CO2 Emissions
MA Rodger, I'm not seeing the point of this wobblometry. Hansen and Sato's 2004 analysis was reproduced here by D. Kelly O'Day. If you are suggesting there's some sort of causal relationship between MEI and deltaCO2, what is it and why does it work? And why would that be important, as it is little more than an oscillation on a rising trend?
-
J Bowers at 10:45 AM on 24 November 2011Climategate 2.0: Denialists Serve Up Two-Year-Old Turkey
lurgee -- "Thus far, the most 'exploitable' line seem to be Phil Jones's comment about the IPCC being above national FOI requests, which seems a reasonable enough statement when referring to an international body" I'm sure that's covered in the first set of emails and jumped on by denialists last time (Caspar Amman, IPCC?), but probably just an email that wasn't cherrypicked for the first release. Zombiegate/Sloppy-seconds-gate/Whatevergate. Same crap, different conference. -
Bob Lacatena at 10:43 AM on 24 November 2011Economic Growth and Climate Change Part 1 - Factors Influencing CO2 Emissions
MA Rodger, What about 2002 on? What about amplitude, as well as an apparent "lag" in some cases but not others. Your eyecrometer seems to be malfunctioning. You are seeing strong correlation and stopping your thought process dead because, in your mind, it's "close enough." Again, why only include those two variables on your graph? Add emissions, then you can make your case more clearly and completely. -
MA Rodger at 10:39 AM on 24 November 2011Economic Growth and Climate Change Part 1 - Factors Influencing CO2 Emissions
Sphaerica @14 My apologies but I'm at a loss what you mean by "a lot of major disconnects." This leads me to wonder what you are defining as "short-term". The CO2 increase trace is characterised by a series of wobbles superimposed onto a rising trend of increasing slope. With the exception of the volcano years (63, 82 &91) the MEI matches the CO2 wobble for wobble with perhaps the exception of 2005-8. If the wobbles are the short-term features, surely ENSO represented by MEI is "the major short term factor." That's where I'm coming from. Until I can grasp where you're coming from, thoughts of "a third line" (which will require the use of annual data on a month graph) would be premature. -
Bob Lacatena at 10:30 AM on 24 November 2011Newcomers, Start Here
141, imthedragon,So it is really the atmosphere and not greenhouse gasses that provides the stability of the temperature...
No. You are very grossly understating the role of greenhouse gases. As you already pointed out H2O is a very strong greenhouse gas and, as both skywatcher and I have explained, it dominates near the surface. So where do temperatures vary the most on earth, in a desert or in a rainforest? The latter has nice, cool trees to shade you, and yet it is stiflingly, achingly hot during the day and gives you little respite at night, too. The desert has burning sands in the day, but temperatures plummet at night. The difference lies in water vapor, the powerful greenhouse gas, that is pervasive in a tropical rain forest and prevents it from losing heat, but almost totally absent in a desert and so allows the heat to escape the moment the sun goes down. -
Bob Lacatena at 10:22 AM on 24 November 2011Newcomers, Start Here
140, imthedragon,CO2 and water vapor both absorb infrared from a nearly identical portion of the spectrum
This is wrong because, just like the radiation/collision aspect of things, the system is far more complex than that. It's not nearly as simple as just saying they overlap, so the change can't matter. For example, the concentration of CO2 proportionally in the atmosphere is fairly constant regardless of altitude, while the concentration of H2O drops the higher you go, because temperatures drop as you get higher and the ability to hold moisture in the air is temperature dependent. Why does this matter? Because a big part of what is changing, and causes greater surface temperatures, is that the altitude from which the planet radiates away its energy is increasing. The earth must have a mean global temperature of 255˚K when seen from space. It must, because that's the amount of energy that it absorbs from the sun. That can't change. What can change is the distribution of energy beneath the point where it radiates the energy into space, and the altitude where the radiation occurs. Picture the atmosphere, for the sake of argument, as a series of layers. Every layer absorbs IR, gets warmer, and radiates IR up and down. Above the lowermost layer, every layer is receiving IR from above and below. As you go up the air is less and less dense, with proportionally less H2O and the same concentration of but less total CO2. So as you go up more and more IR succeeds in radiating upwards, working it's way out into space, rather than downward and warming the surface. When there is less CO2, the layers above have less chance of trapping the outgoing energy. The radiation to space effectively occurs at a lower altitude. With more CO2, the layers above trap more radiation. Things progress upward, and the ultimate radiation to space occurs from higher layers. Add H2O, which overlaps with the CO2 absorption range. But H2O is not evenly distributed. It is more present in the lower layers, and more rarefied in the upper layers. So if you add CO2, and radiate the energy into space from high enough up, the overlap of CO2 and H2O is irrelevant. CO2 dominates. -
skywatcher at 10:07 AM on 24 November 2011Newcomers, Start Here
#140 imthedragon - it's important to remember that, although there's overlap between CO2 and water vapour, one condenses and precipitates at Earthly temperatures and one does not. Additionally, in the upper atmosphere, it's the radiation from CO2 that dominates due to pressure effects (see for example this RealClimate article or this excellent series by ScienceOfDoom). So while it's tempting to think of CO2 and water vapour similarly, you cannot, as one is doomed to be a feedback to the other's forcing, and one is not so prevalent or effective in the thin upper atmosphere. -
adelady at 08:22 AM on 24 November 2011The Debunking Handbook Part 4: The Worldview Backfire Effect
I notice that advertising companies have picked up on this. Can't remember the company (I've already got mine) but "I'm not trying to save the world. I'm just saving up for a trampoline." is advertising genius. -
John Hartz at 07:39 AM on 24 November 2011World Energy Outlook 2011: “The door to 2°C is closing”
Suggested reading: “Climate-Control Policies Cannot Rely on Carbon Capture and Storage: That’s My Side of The Economist Debates” by Joe Romm, Climate Progress, Nov 22, 2011 Click here to access this article. -
imthedragn at 06:39 AM on 24 November 2011Newcomers, Start Here
So it is really the atmosphere and not greenhouse gasses that provides the stability of the temperature. Instead of frigid cold overnight and scorching heat during the day, the temperature stays more moderate because of the atmosphere even if the atmosphere were devoid of greenhouse gasses. The additional heating of the greenhouse gasses by their absorbtion of the infrared radiated from the planet's surface allows that average temperature to be nudged a bit higher.Response:[DB] "even if the atmosphere were devoid of greenhouse gasses"
Umm, no. Please read Atmospheric CO2: Principal Control Knob
Governing Earth’s Temperature -
imthedragn at 06:31 AM on 24 November 2011Newcomers, Start Here
Sphaerica, that is by far the best response I have ever seen to that question I had of Mars. The fact that surface temperatures are both much cooler and much warmer than they would be otherwise and that the "global warming" simply refers to the shift in those average temperatures really puts things in perspective form me. The remaining item in my mind that I need to clear up is defining a "static" greenhouse effect. By that I mean if we raise the CO2 level by x amount and then keep it there perpetually, the global average temperature will eventually stabailize to what. In my mind, regardless of how much you try to categorize things as forcings or as feedbacks, CO2 and water vapor both absorb infrared from a nearly identical portion of the spectrum, I still conceptualize them as if they were acting as a single gas. -
John Hartz at 06:13 AM on 24 November 2011Climategate 2.0: Denialists Serve Up Two-Year-Old Turkey
Suggested reading: Real 'Climategate' Scandal: UK Police Spent Measly $8,843 In Failed Attempt to Identify Criminal Hacker” DeSmog Blog, Nov 22, 2011 Click here to access this article. -
Bob Lacatena at 06:12 AM on 24 November 2011Economic Growth and Climate Change Part 1 - Factors Influencing CO2 Emissions
12, MA Rodger, I see a lot of major disconnects in your graph between MEI and CO2, which clearly points to MEI being only one factor, and not in any way the major short term factor in comparison to emissions. Clearly there is something missing, and changes in actual emissions are the obvious candidate. You should amend your graph to clearly include a third line demonstrating actual human emissions each year. -
John Hartz at 06:08 AM on 24 November 2011Climategate 2.0: Denialists Serve Up Two-Year-Old Turkey
Suggested reading: “East Anglia SwiftHack Email Nontroversy Returns: What You Need To Know”, DeSmog Blog, Nov 22, 2011 Click here to access this article.
Prev 1383 1384 1385 1386 1387 1388 1389 1390 1391 1392 1393 1394 1395 1396 1397 1398 Next


