


 Arguments


Recent Comments
Prev 1397 1398 1399 1400 1401 1402 1403 1404 1405 1406 1407 1408 1409 1410 1411 1412 Next
Comments 70201 to 70250:
-
Bob Lacatena at 15:26 PM on 14 November 2011How to Avoid the Truth About Climate Change
10, Pirate, Is there a point to your question? -
Bob Lacatena at 15:25 PM on 14 November 2011New tool clears the air on cloud simulations
Climastrology button required here. -
Sasquatch at 15:01 PM on 14 November 2011How to Avoid the Truth About Climate Change
Does a geochemist qualify as a climate scientist? -
muoncounter at 14:34 PM on 14 November 2011New tool clears the air on cloud simulations
scaddenp, You are being wayyyy too rational about this. The basis of the "Microwave" theory is that microwave radio frequency communications are directly linked to global climate change and can be historically traced to the use of radio waves at a global level. -
jmorpuss at 14:32 PM on 14 November 2011New tool clears the air on cloud simulations
scaddenp @ 22 As you move into the microwave frequencies used by satalite and long distent coms as well as some radars you can create hot spots and as you know heat differences drive the weather Here is a link to http://www.ngdc.noaa.gov/stp/IONO/Dynasonde/SpEatHeating.htm Sporadic E and charged particals -
scaddenp at 14:13 PM on 14 November 2011New tool clears the air on cloud simulations
jmorpuss - noone disputes radio waves are EM. Just that this has nothing to do with climate or weather. If you want to connect radio (kHz to 1GHz range EM) to climate, then you need papers that show a climatic/meteorological response in that range. Sporadic-E clouds are not meteorological clouds. GHG are transparent to EM in that frequency. -
jmorpuss at 14:00 PM on 14 November 2011New tool clears the air on cloud simulations
Tom @16 The first line here states that radio waves are a form of electromagnetic radiation http://encyclopedia.thefreedictionary.com/radio+waves Sometimes you have to put the peaces together -
Tom Curtis at 13:03 PM on 14 November 2011Extreme Events Increase With Global Warming
muoncounter @30, I do not think we are significantly disagreeing. Your quote from Hansen, "The most important change of the climate dice is probably the appearance of extreme hot summer anomalies..." is exactly correct, and exactly to the point. My purpose, however, was to point out that the increase hot events was not matched by an equivalent decrease in cold events. As can be seen from the following graph (also from Hansen et al, 2011): a) cold (> 1 sigma) events have approximately halved over the last 40 years; b) very cold (>2 sigma) events have declined but not appreciably; and c) extremely cold (>3 sigma) events have never been frequent, but have become rarer, but one still occurred as recently as 2010. In contrast: e) hot (>1 sigma) events have tripled on frequency; d) very hot events have risen from about 1% to about 20% of land area; and e) extremely hot (3 sigma) have risen from negligible amounts to about 5% of land area. Obviously the big news in this is the rise of hot events. There is, however, a common perception that that rise will be matched by and compensated by a decline in cold events. That perception is wrong, and needs to be rebutted.
-
Tom Curtis at 12:43 PM on 14 November 2011New tool clears the air on cloud simulations
The moderator is quick of the mark today. For the record, jmorpuss posted another of topic response which has been deleted. I presume it was deleted because: 1) It contained moderation complaints, in contradiction of the comments policy; 2) It was extremely of topic, in contradiction of the comments policy; and 3) It contained a link with no discussion of the link's comments, in contradiction of the comments policy. All three aspects of the comments policy are justified, and indeed, valuable in keeping discussions focused, relevant, and understandable. Yet deniers persistently violate all three and then complain that their posts are deleted in order to suppress their opinions, which is laughable. In this case I wish to point out that not only was jmorpus link of topic with regard to the OP, but it was also of topic with regard the particular discussion of his theories above. It contained no mention of clouds, sporadic E, or the ionosphere, and therefore was entirely irrelevant. It was certainly not a defense of jmorpus' theory. Also, for the record, I do not delete anything on SkS, as I am not a moderator. -
Tom Curtis at 12:13 PM on 14 November 2011New tool clears the air on cloud simulations
Additional to my 16: IN facing theories that are utterly absurd it is easy to miss particular absurdities in the crowd. In particular, jmorpuss claim that: "What I'm trying to point out here is how ground based and satalites data collecting can cause sporadic E clouds to form" is beyond absurd. Like all other ionized layers, Sporadic E layers are formed by ionizing radiation from the sun. While they effect radio communication, they are not caused by it. This claim by jmorpuss is further evidence of crankery, and needs to be defended along the same lines as those in my conclusion of my 16 (12:00 PM 14 Nov, 2011). Note to moderator: I know that my 16 and this post are now responses to a deleted post. Could you please allow them to stand based on the principle outlined inline @7. If you could restore his deleted post on the same basis, that would also be appreciated. -
John Hartz at 12:07 PM on 14 November 2011New tool clears the air on cloud simulations
DB: Suggest that all jmporuss's comments be deleted and that he/she be banned from posting on SkS. -
Tom Curtis at 12:04 PM on 14 November 2011New tool clears the air on cloud simulations
Norman @13, I accept your point. Accepting it, however, only shows jmorpuss claim @6 even more absurd. -
Tom Curtis at 12:00 PM on 14 November 2011New tool clears the air on cloud simulations
jmorpuss @11: >b>1) I, and I am sure all other comentators on this site have never come across your unusual definition of radio waves as "radiated electromagnetic waves". What we have come across in both physics courses and popular reading on the topic is the definition of "radio waves" as:" Wave from the portion of the electromagnetic spectrum at lower frequencies than microwaves. The wavelengths of radio waves range from thousands of metres to around 30 cm. These correspond to frequencies as low as 3 Hz and as high as 1 gigahertz (109 Hz)."
(Source) Consequently, unless you can provide a clear definition of "radio waves" as "radiated electromagnetic waves of all frequencies" from a reputable source of information on physics, I will conclude that my usage is incorrect, and that your usage is aberrant, and marks you as an ill informed crank. 2) Like Scaddenp, I failed to find any relevant information in your linked source. First, it refers to only a restricted part of the radio frequencies, and hence not to gamma rays. Second, it specifically discusses the effects of the ionosphere on the propogation of High Frequency Radio waves, ie, those between 3 and 300 MHz. The ionosphere is a portion of the atmosphere including the thermosphere and exosphere (50 km to over 500 km altitude according to your source) in which electrons are stripped from atoms in the atmosphere, thus ionizing them. Because of the high altitude and the ionization, no water is found at those levels of the atmosphere, so no meteorological clouds can be found at that level of the atmosphere. Third, the only "sporadic E" things described by your source are "sporadic E layers", which are:"Sporadic E refers to the largely unpredictable formation of regions of very high electron density in the E region. Sporadic E may form at any time during the day or night occurring at altitudes of 90 to 140 km (the E region)."
(My emphasis) It is true that the wikipedia article on the Ionosphere refers to these layers as "sporadic E clouds", but they are clouds of high electron density, not of water vapour and therefore are not meteorological events. Equating clouds of high electron density with meteorological events is further evidence of crankery. As the wikipedia article on cranks says,"Cranks characteristically dismiss all evidence or arguments which contradict their own unconventional beliefs, making rational debate an often futile task."
Therefore, absent the immediate explicit explanation of your theory, supported by links to reputable sites explicitly advocating and providing evidence for that theory, I will draw the obvious conclusion that you are in fact a crank and that further discussion with you is a waste of my time. -
jmorpuss at 11:46 AM on 14 November 2011New tool clears the air on cloud simulations
Philippe @12 this link may help you understandhttp://www.ips.gov.au/Category/Educational/Other%20Topics/Radio%20Communication/Intro%20to%20HF%20Radio.pdfResponse:[DB] Again, simply posting a link does not help you prosecute your agenda. You must demonstrate that you both understand the science and mechanisms behind that which you propose AND you must also point to peer-reviewed literature which supports those.
Your links, as have already been pointed out, do not support your position.
-
jmorpuss at 11:37 AM on 14 November 2011New tool clears the air on cloud simulations
Riccardo @10 You need to research how a magnetron works and with carbon Nano tube tech's one can make a wave guide out of it and inject gasses into the wave guide The microwaves in your microwave oven is ionised by the metal wave guide -
Norman at 11:36 AM on 14 November 2011New tool clears the air on cloud simulations
Tom Curtis @ 8 Cosmic rays are currently described mostly as high energy particles. Mostly protons with a few alpha particles and some heavier nuclei. I do not think they refer to gamma rays as cosmic rays anymore but call them gamma rays directly to indicate the difference between the normal particle flux entering our solar system and the few extreme events that produce intense levels of gamma radiation. Current understanding of the term cosmic rays. -
Philippe Chantreau at 11:32 AM on 14 November 2011New tool clears the air on cloud simulations
"What I'm trying to point out here is how ground based and satalites data collecting can cause sporadic E clouds to form" Say what? What in the world in this mumbo-jumbo? Data collection causing cloud formation? How is this fantastic hypothesis supported in any way by your link? Sorry to be blunt but you seem to have no comprehension whatsoever of what you read. When one talk about radio waves, it is generally understood to include electromagnetic waves within the radio frequency spectrum. If it is infra-red, visible or ultra violet, this is normally specified. If it is higher energy like X rays or Gamma rays, it is never referred to as radio waves. Conventions may be just that but they do have their usefulness. Electromagnetic waves do not carry nano particals, whatever that may be. Cosmic rays do not do that either. If you know of any scientific work linking, even in the loosest fashion, radio waves and climate, please cite. At this point, you have demonstrated only thorough confusion. -
muoncounter at 11:16 AM on 14 November 2011Extreme Events Increase With Global Warming
Tom C#29: Point taken. However, your #21 "an overall increase in the combined total of hot and cold events, even though cold events are becoming rarer" seems like a stretch. Why include cold events in the 'combined total,' if the rightward migration of these distribution curves shows that extreme cold events are becoming less frequent? See Hansen again: The most important change of the climate dice is probably the appearance of extreme hot summer anomalies, with mean temperature at least three standard deviations greater than climatology, over about 10% of land area in recent years. That's illustrated in Hansen's Fig 7: --full scale
The vertical scale is % area; summertime area classed as 'hot' has tripled, 'very' and 'extremely' hot went from negligible to sizable percentages. In that context, this really is about increased probability - and extent - of extreme heatwaves (with their accompanying drought and fire risk). So what comes after the 3 sigma 'extremely hot'? Biblical?
--full scale
The vertical scale is % area; summertime area classed as 'hot' has tripled, 'very' and 'extremely' hot went from negligible to sizable percentages. In that context, this really is about increased probability - and extent - of extreme heatwaves (with their accompanying drought and fire risk). So what comes after the 3 sigma 'extremely hot'? Biblical?
-
dhogaza at 11:13 AM on 14 November 2011Models are unreliable
So ... no Camburn. Am I only only person who thinks he was just going off on models in an effort to derail the other thread?Response:[DB] Camburn has elected to recuse himself from further participation.
-
scaddenp at 11:11 AM on 14 November 2011New tool clears the air on cloud simulations
The linked information refers to radio spectrum in the range 1 to 300 MHz (well within normal usage of word "radio"). Again, I fail to see the climatic significance. -
Riccardo at 10:47 AM on 14 November 2011New tool clears the air on cloud simulations
jmorpuss nowhere in the link you provide do they say that radio waves is short for "radiated electromagnetic waves", whatever that means. In any case, there's no way for them to carry nanoparticles. -
jmorpuss at 10:37 AM on 14 November 2011New tool clears the air on cloud simulations
Tom @ 8 thanks for not deleting. Sphaerica @7 Radio wave is short for radiated electromagnetic waves and really covers the whole magnetic spectrem and includes gamma rays though people may not understand this it is still true (-Snip-)Response:[DB] Unless you can point to peer-reviewed science that can substantiate what you hypothesize, you are essentially engaging in "What if _______?" conjecture.
Of course, what you neglect is the need for subsequent explanations as to why what amounts to established fact only applies in certain situations...and not others.
OT snipped.
-
Tom Curtis at 10:13 AM on 14 November 2011Extreme Events Increase With Global Warming
muoncounter @23, the top row of graphs is Jun-Jul-Aug, but the second row is Dec-Jan-Feb. Consequently my point @21 stands. -
Tom Curtis at 10:07 AM on 14 November 2011New tool clears the air on cloud simulations
jmorpuss @6, as Sphaerica has already pointed out, cosmic rays are not "radio waves that carry nano particles". Radio waves are the least energetic form of electromagnetic radiation. Cosmic rays are gamma rays, the most energetic form of electromagnetic radiation (even more energetic than X-rays) along with showers of high energy sub-atomic particles, and while the latter could be loosely described as "nano-particles) they are not "carried by radio-waves" in any meaningful sense. To clarrify Spaerica's further comment, by "cosmic ray theory" he means the theory that cosmic rays increase cloud cover by creating cloud nuclei, not the theory as to how cosmic rays are generated. -
Bob Lacatena at 09:53 AM on 14 November 2011New tool clears the air on cloud simulations
6, jmorpuss, Um, no. Cosmic rays are in no way "radio waves that carry nano particals [sic]." That falls under the category of "making stuff up." Beyond this -- cosmic ray theory itself is an unproven theory with no support at the moment whatsoever. Taking this a step further to discuss radio waves is insanity. Beyond this -- the fact the you can use the word "cloud" in your topic as well as the original post does not make your comment on-topic on this thread. Your comment is off topic and as such should be deleted. You've attempted to post these links before, but without context. Now you're conjuring context out of thin air. And honestly, I have a very, very hard time seeing the point. Please stop. This site is about science, not Dog Astrology or whatever your own personal interest may be. [Mods -- feel free to delete the original comment and all subsequent comments.]Moderator Response:[DB] Actually, since jmorpuss has persistently been pushing this agenda regardless of thread, it's a good teaching moment to nail this one down so subsequently we can point back to this as needed (lest it amount to PRATT, of course).
-
oneiota at 09:48 AM on 14 November 2011Glaciers are growing
Some grist for the mill: I’ve come across an interesting easy to read general paper on AGW by the glaciologist Lonnie Thompson titled Climate Change: The Evidence and Our Options. “Glaciers serve as early indicators of climate change. Over the last 35 years, our research team has recovered ice-core records of climatic and environmental variations from the Polar Regions and from low-latitude high-elevation ice fields from 16 countries. The ongoing widespread melting of high-elevation glaciers and ice caps, particularly in low to middle latitudes, provides some of the strongest evidence to date that a large-scale, pervasive, and, in some cases, rapid change in Earth’s climate system is underway. This paper highlights observations of 20th and 21st century glacier shrinkage in the Andes, the Himalayas, and on Mount Kilimanjaro. Ice cores retrieved from shrinking glaciers around the world confirm their continuous existence for periods ranging from hundreds of years to multiple millennia, suggesting that climatological conditions that dominate those regions today are different from those under which these ice fields originally accumulated and have been sustained. The current warming is therefore unusual when viewed from the millennial perspective provided by multiple lines of proxy evidence and the 160-year record of direct temperature measurements. Despite all this evidence, plus the well-documented continual increase in atmospheric greenhouse gas concentrations, societies have taken little action to address this global-scale problem. Hence, the rate of global carbon dioxide emissions continues to accelerate. As a result of our inaction, we have three options: mitigation, adaptation, and suffering.” -
michael sweet at 09:35 AM on 14 November 2011Extreme Events Increase With Global Warming
Muoncounter, I am sure we are on the same page. Hansen's paper is shocking. Skept, It sounds to me like we generally agree. I think the data already exists to show the warming is much more downside than any lessening of cold is upside. I think Hansen's paper is the final nail in the coffin of the deniers. If we both keep reading we will come to agreement soon. There are a lot of people on this website who call themselves "skeptics" who are really deniers so your handle looks funny. -
jmorpuss at 09:31 AM on 14 November 2011New tool clears the air on cloud simulations
5, Sphaerica All you have to do is rap this type of info around cosmic ray theory But see that cosmic rays are only radio waves that carry nano particals And then apply this info on radio propagation from our com's and detecting Link provided http://www.ips.gov.au/Educational/5/1 -
Bob Lacatena at 09:19 AM on 14 November 2011New tool clears the air on cloud simulations
4, jmorpuss, Your provided link says nothing whatsoever about weather or climate. How is it of any interest on this site, or in any discussion of climate? -
jmorpuss at 08:40 AM on 14 November 2011New tool clears the air on cloud simulations
One thing I don't see disgust much is th conection between sporadic E clouds and weather events Why? http://en.wikipedia.org/wiki/Sporadic_E This link gives some insight to what I mean I have other links I would like to share if you are interested -
pauls at 07:57 AM on 14 November 2011New tool clears the air on cloud simulations
WheelsOC, This isn't about better resolution cloud modelling. COSP simulates, within a GCM, the mechanisms by which real satellite observational data is collected. The challenge is in obtaining meaningful comparisons between satellite retrieval data and outputs from GCMs in order to produce realistic parameterisations of cloud processes. This approach allows genuine apples to apples comparisons between models and satellite data. Thanks for posting this, John, very interesting. Just yesterday I was pondering the possibility of exactly this approach for assessing UAH & RSS TLT data against models. Maybe it's already been done? -
David Lewis at 07:45 AM on 14 November 2011Global Surface Temperature: Going Down the Up Escalator, Part 1
Hansen has singled out ocean heat content measurements as the most important indicator of a "warming world" for many years. Now that precise measurements look like they are becoming available, he is emphatically calling attention to them. Since 2005 he has been describing calculations primarily based on measured ocean heat content in his public statements as a “smoking gun”. Now the term, i.e. “smoking gun”, is in his latest paper in press. He is becoming increasingly confident in analyses of data coming from the recently deployed Argo floats: “The strong positive energy imbalance during the solar minimum, and the consistency of the planet’s energy imbalance with expectations based on estimated human-made climate forcing, together constitute a smoking gun, a fundamental verification that human-made climate forcing is the dominant forcing driving global climate change.” This is the data he is using: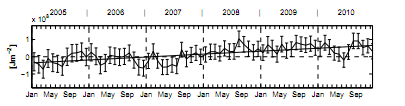 (From von Shuckmann and Le Traon 2011, “How well can we derive Global Ocean Indicators from Argo data?”)
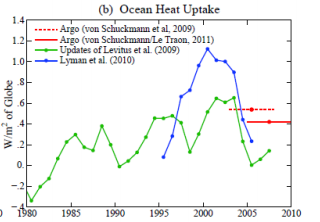
To illustrate how “noisy” the previously available ocean heat storage data is compared to this new Argo data, Hansen provided this chart. The solid red line is his calculation based on the data from the von Schuckmann chart above, and the dotted red line is calculation based on data from a previous von Shuckmann et. al. effort. Both are Argo analyses:
(From von Shuckmann and Le Traon 2011, “How well can we derive Global Ocean Indicators from Argo data?”)
To illustrate how “noisy” the previously available ocean heat storage data is compared to this new Argo data, Hansen provided this chart. The solid red line is his calculation based on the data from the von Schuckmann chart above, and the dotted red line is calculation based on data from a previous von Shuckmann et. al. effort. Both are Argo analyses:
 The ocean is where the heat is. Mere sloshing around of a tiny bit of the heat in the ocean, i.e. ENSO, can show up as a cooling trend in the global average surface temperature chart. Debate about whether the planetary system could possibly be cooling should be done using terms that make it clear that the global average surface temperature chart isn't a measure of whether the planet is cooling or not, or whether global warming is occurring or not.
-
lancelot at 07:40 AM on 14 November 2011Sober up: world running out of time to keep planet from over-heating
John Hartz, thank you, will look it up. -
lancelot at 07:39 AM on 14 November 2011Sober up: world running out of time to keep planet from over-heating
Re philippe 117 . Electrical energy import into the UK is via a single route : across the channel from France. Oil imports are from many diverse routes and suppliers. Governments will rightly consider such facts, that is the reality. I cannot personally see the UK relying on 70% import of energy from a single supply route. Maybe 20% max. That leaves at least 50% fossil fuels or local nuclear. (Unless you can suggest another answer). You might want to check out Sustainable Energy without the Hot Air by David McKay, for a good survey of UK energy needs and scenarios, it is also downloadable online. -
John Hartz at 07:33 AM on 14 November 2011Sober up: world running out of time to keep planet from over-heating
@ Lancelot #115 The journal references that you asked for are: Mark Z. Jacobson, Mark A. Delucchi. Providing all global energy with wind, water, and solar power, Part I: Technologies, energy resources, quantities and areas of infrastructure, and materials. Energy Policy, 2010; DOI: 10.1016/j.enpol.2010.11.040 To access a PDF of Part I, click here. Mark A. Delucchi, Mark Z. Jacobson. Providing all global energy with wind, water, and solar power, Part II: Reliability, system and transmission costs, and policies. Energy Policy, 2010; DOI: 10.1016/j.enpol.2010.11.045 To access a PDF of Part II, click here. -
JMurphy at 06:52 AM on 14 November 2011Extreme Events Increase With Global Warming
Interesting paper here, which directly connects fire with temperature in a more indirect way, so to speak : Forecasting Fire Season Severity in South America Using Sea Surface Temperature Anomalies -
muoncounter at 05:54 AM on 14 November 2011Extreme Events Increase With Global Warming
michael sweet#24: Please excuse my northern hemispherocentrism. It is interesting to note that the new Hansen et al paper finds verification of the much-discussed (and criticized) 1988 models: Hansen et al. (1988) projected how the odds would change due to global warming for alternative greenhouse gas scenarios. Their scenario B, ... led to four of the six dice sides being red early in the 21st century based on global climate model simulations. Figure 5 confirms that the actual occurrence of summers in the "hot" category (seasonal mean temperature anomaly exceeding +0.43 σ) has approximately reached the level of 67% required to make four sides of the dice red. ... However, note that the odds of an unusually cool Jun-Jul-Aug (by the standards of 1951-1980) have fallen more than the odds of having an unusually cold Dec-Jan-Feb. Comparable loading of the dice has occurred in winter, where "hot", i.e., mild, winters now occur almost two-thirds of the time. --emphasis added The new paper's Figure 7 is extremely relevant: It depicts the inexorable trend of JJA for an increasing percentage of the globe into 'hot,' 'very hot,' and 'extremely hot.' This graph could make even the 'pausers' take notice, as there is no evidence of warming having paused. -
Philippe Chantreau at 05:43 AM on 14 November 2011Sober up: world running out of time to keep planet from over-heating
Will strategic and political considerations constrain the relaiance on imported electricity more than they constrain reliance on imported oil and coal? I don't see that the situation will be much different. The truth is that, as long as tepid attitudes and reluctance to change like that displayed here by lancelot are widespread, no change can happen. There is also the option of waiting until FF are so scarce that change, and its modalities, is no longer a matter of choice. -
skept.fr at 05:20 AM on 14 November 2011Extreme Events Increase With Global Warming
Michael : I consider the Tom’s argument, and in #20 I finally conclude in the same way when looking at Figure 2 (an overall increase of combined event). I’m please to read Hansen paper. Tom : my initial point was not that hot events are limited to heat waves (nor extreme events to temperature break-records), just that the shift of the mean to the right you describe logically implies a lesser probability for extreme cold events – a quite consensual conclusion from IPPC AR4. But you get the point for the overall increase. Again, my ultimate concern is to correctly estimate the present and future carbon cost for society : I hope we all have the same agenda. -
WheelsOC at 05:15 AM on 14 November 2011New tool clears the air on cloud simulations
Alright! More realistic physics and better resolution for cloud modelling! This should make Dr. Spencer happy, right? ... right? Hmmm, this news has been out for almost three weeks and he's been pretty quiet about it. Wasn't his major beef with climate models the idea that they had unrealistic and backwards cloud simulations? -
lancelot at 05:01 AM on 14 November 2011Sober up: world running out of time to keep planet from over-heating
I should add: the other 70% will still have to come from fossil or nuclear, or be imported, as it is done already from France. However, strategic and political considerations will constrain the reliance on imported electricity. That is just a fact of life. -
lancelot at 04:49 AM on 14 November 2011Sober up: world running out of time to keep planet from over-heating
John Hartz, (author of this topic): in the intro: "a recent study in Energy Policy found that fossil fuels could be wholly abandoned by 2050 with the world's energy needs met by electricity produced 90 percent from wind and solar sources alone" That would be wonderful if true, but is very hard to believe. Firstly. Do you have a link to that study? Secondly, even if theoretically possible globally, in a country such as the UK it is not likely to be possible locally. The often quoted limit for renewables is about 30%. So it would seem that the other 70% will have to still have to come from fossil or nuclear. This must surely apply to many other countries. Thirdly, some calculation should be done of the amount of carbon likely to be produced in the transition period, for building such a massive energy infrastructure, using energy which comes from current sources. I am not saying that the quoted target is not desirable, just questioning the practical side.Moderator Response: [John Hartz] The article was written by Jeremy Hance and was originally posted on Mongabay.com. See Jeremy Hance #73 for links to the Energy Policy paper. -
cynicus at 04:28 AM on 14 November 2011The BEST Summary
Tristan, it figures that Jo Nova rants about percentages: deniers hate percentages and love numbers. See, the Oregon Petition has over 30.000 signers who earn a BS degree or equivalent, so we -the public- are supposed to think: "Gee that's a lot of knowledgeable people, they must be right". Now, we can discuss endlessly if the Spice Girls have BS degrees or not, or that there really exists someone called Donald Duck, but of the people with a BS degree (or equivalent) alive, much less then 3% signed the petition! Hmm, now it doesn't sound that impressive anymore, does it? Another example is that famous list of 900 papers skeptical of AGW. Now, we can discuss endlessly if these papers are really sceptical about AGW or not (many of them aren't), or that some of these papers are not to be taken serious (many of them aren't, e.g. the paper in the Dog Astrology Journal). But when we take a look at the number of papers published each year on AGW, it turns in the order of 2000+ papers are published year after year of which less then 5% is sceptical about AGW. Hmm, 900 papers doesn't sound so impressive anymore, right? Deniers hate percentages but love numbers. Note: Figures are not exact, it's just to make the point -
Lazarus at 04:17 AM on 14 November 2011Sober up: world running out of time to keep planet from over-heating
Typo: "r. The other study predicts that pats of Europe,"Moderator Response: [John Hartz]Typo fixed. Thanks. -
michael sweet at 04:09 AM on 14 November 2011Extreme Events Increase With Global Warming
Muoncounter, Since this an Australian web site I am surprised you said JJA is a summer only time;). In the paper Hansen also shows DJF data and it looks very similar. The primary difference is in winter the standard deviation of temperature is greater. This means a stronger conclusion can be drawn from the JJA data. -
muoncounter at 03:57 AM on 14 November 2011Extreme Events Increase With Global Warming
Tom C#21: "the information in the inline graphs @13. The distribution of temperatures shown in those graphs not only shifts the mean to the right, but broadens the distribution." Of course, those are summer (JJA) graphs, so they do not deal with cold extremes in any way. But in dealing primarily with heat, this post does not explicitly exclude its broader effects. No such exclusion is in any way logical. Anyone who lived through this summer in the southwestern US saw little separation between heatwave-drought-fire; the latter two are symptoms of prolonged extreme heat. All are connected: in fact, it was the passage of Hurricane Irene to the east of Texas that brought winds turning local fires into wildfires. There is also ample evidence, at least on a local scale, that a bad fire season leads to a higher probability of flooding in the following wet season: Water quickly saturates the thin layer of permeable soil above the hydrophobic zone not being slowed by a vegetative canopy. Slower infiltration rates result in an increased intensity of surface runoff and erosion. But we've already seen a 'trifecta' of extreme behavior: National Weather Service forecast offices and River Forecast Centers have been gearing up for the third leg of a triple crown of disasters consisting of continuing drought and wildfires in the west, a record-breaking tornado outbreak in the South and record flooding along the Lower Mississippi River. And if tropical cyclones (TCs) are more frequent or more intense due to warming, you can add in the associated heavy Predecessor Rain Events (PREs) described by Galarneau and Bosart 2010: PREs are high-impact weather events that can often result in significant inland flooding, either from the PRE itself or from the subsequent arrival of the main rain shield associated with the TC that falls onto soils already saturated by the PRE. Further along the scale, consider what may be a changing winter pattern towards more frequent extreme snowfall totals: There will still be colder than average winters in a world that is experiencing warming, with plenty of opportunities for snow. The more difficult ingredient for producing a record snowstorm is the requirement of near-record levels of moisture. Global warming theory predicts that global precipitation will increase, and that heavy precipitation events--the ones most likely to cause flash flooding--will also increase. Our prior extreme weather threads (and here) addressed these connections. -
michael sweet at 02:32 AM on 14 November 2011Extreme Events Increase With Global Warming
Hansen's most recent paper shows 2009 with 7% Extreme heating over land, 2010 as 17% Extreme heating and 2011 as 10% Extreme heating (See figure 6 in linked study). All these years had 0% Extereme cold and in fact 0% Very cold, the next warmer bin (Very hot was 20, 20, and 17%). From 1950-1980 less than 0.5% of land area was either Extremely hot or Extremely cold. I do not think that there is a problem with minimizing the side effects of cold weather, compared to current issues with extraordinary heat, drought and flooding. Perhaps you could site an example of a scientist "minmimizing the deleterious effects of a cold event"? We are all aware of the deleterious effects of cold following extreme volcanic erruptions, those are beyond human control. Consider Toms argument also. We want to be honest but not minimize the danger. -
Tom Curtis at 02:30 AM on 14 November 2011Extreme Events Increase With Global Warming
skept.fr @20, while I admire a commitment to truth in any person, your reduction of the issue to heatwaves only obscures truth rather than reveals it. As already noted by other commentators, by that formula you exclude from consideration the drought and fires that accompany the heatwaves. Indeed, you also exclude the droughts (such as those in the Amazon, and in the South West corner of Australia) which are largely independent of heat waves. You also exclude from consideration the many floods in recent years several of which have a high probability of having been caused, or made worse by global warming. You also draw attention away from the information in the inline graphs @13. The distribution of temperatures shown in those graphs not only shifts the mean to the right, but broadens the distribution. That means the reduction in cold wave events is nowhere near as large as the increase in heatwave events. So, contrary to your 16, this is not a case of an equal number of extreme events, with increase in hot events compensated for by a decrease in cold events. There is an overall increase in the combined total of hot and cold events, even though cold events are becoming rarer. -
Tom Curtis at 02:16 AM on 14 November 2011New tool clears the air on cloud simulations
"Additionally, COSP has shown that climate change leads to an increase in optical thickness and increases the altitude of high clouds and decreases the amount of low and mid-level clouds."
This is very interesting. Cloud albedo is a function of optical thickness, but the greenhouse effect is a function of cloud altitude. Specifically, the higher the altitude of the top of the cloud, the greater the greenhouse effect from that cloud. That means that an increase in the altitude of high clouds, and a decrease in the amount of low and mid-level clouds translates out as a positive cloud feedback, ie, that the effects of increased warmth on clouds tend to further increase the warmth, rather than reduce it. -
skept.fr at 02:08 AM on 14 November 2011Extreme Events Increase With Global Warming
Michael : « you want to minimize the deleterious effects of these type of events » I would like the negative effects of AGW (including unique extreme events) to be precisely detected, attributed, evaluated. As a true skeptic (or I hope so), I’v no sympathy for those who try to distort the results of science (in a maximizing or minimizing sense) in order to influence public opinion and promote an ideological or economic agenda. And as a citizen, I’d like to know the true externalities of carbon-based energy systems. But ‘true’ means simply… true : we need to assess costs of climate-related hazards with and without AGW in order to make the optimal choices, at least if we favour an evidence-based policy. You are right for the other side-effects of hot temperatures (fires, drought), but do you mean that there is no side-effects of extreme cold temperatures too, in Russia or elsewhere ? If so, hem, I would conclude that ‘you try to minimize the deleterious effects of these type of events’ ☺ But after all, if hot extreme events in a warming climate are more numerous than cold extreme events in a stable climate (as it seems to be according to Figure 2), the choice for the title is justified.
Prev 1397 1398 1399 1400 1401 1402 1403 1404 1405 1406 1407 1408 1409 1410 1411 1412 Next


