


 Arguments


Recent Comments
Prev 1411 1412 1413 1414 1415 1416 1417 1418 1419 1420 1421 1422 1423 1424 1425 1426 Next
Comments 70901 to 70950:
-
Tom Curtis at 07:42 AM on 27 November 2011Schmittner et al. (2011) on Climate Sensitivity - the Good, the Bad, and the Ugly
muoncounter @8 and skept.fr@7, when I said that "the temperature change should equalize" I did not mean that temperature changes in different latitude bands would be equal, or indeed that their should be the same temperature change within a given latitude band for all seas and land surfaces. Obviously there will be regional variations based on changes in circulation and in changes in land cover. Because these factors do change, we would only expect that " Land temperatures ... should fluctuate about a mean that is close to sea surface temperatures." Close, but not identical. Further, as a point of clarification, this should apply to zonal means rather than to the global mean. Indeed, it will not apply to the global means because of the different zonal distribution of ocean and land surfaces. That we should expect this effect, however, is seen by considering two hypothetical examples, a desert world (no oceans), and an oceanic world (no land). For the thought experiment, assume feedbacks are identical in both. IN that case, doubling CO2 in both will lead to approximately equal increases in GMST because the increase in GMST is determined by the value needed to establish equilibrium in the TOA energy equation. There will be slight differences in the final outcome depending on differences in heat transfer from equator to poles. The main difference will be that while the land only world will reach the equilibrium temperature in a few years, the ocean only world will take a few centuries. In the real world, as noted we will expect slight differences in zonal mean changes in temperature between land and sea. However, those differences will be less than the differences in regional changes in temperature due to changing currents, winds and land cover. With regard to Schmittner et al's figure 1 (the figure three in the caption is a typo), I would regard it as supporting my argument rather than rebutting it. The relevant points are: 1) There observational data shows an increase (!?!) in sea surface temperatures north of Iceland. As the area north of Iceland was almost certainly covered with perennial sea ice, the apparent increase in temperature would indicate that the proxy is measuring under ice temperatures rather than surface temperatures, as per my hypothesis; 2) In the model, in all areas not associated with significant sea ice during the LGM, land temperatures are withing 1 degree of SST temperatures; and in contrast 3) In the model, in areas associated with sea ice land temperatures are significantly colder (up to 4 degrees) than are sea surface temperatures. Please note that this is very much what my explanation predicts. For a true check using models, however, we would need to check out a hot example, where my explanation would predict land temperatures lying withing a degree of sea temperatures in the same zone over the entire globe. -
Mikel at 07:36 AM on 27 November 2011Climategate 2.0: Denialists Serve Up Two-Year-Old Turkey
69 John Hartz SkS provided a very good series of articles about twelve months ago reviewing the furore over the CRU emails, including an article on FOI requests. I was hoping SkS or others viewing this site might know of some other site that looked at the legal issues arising from the release of the CRU emails. I am not expecting SkS to provide a forum but I was asked to set out what I consider to be some of the legal issues. -
John Hartz at 07:24 AM on 27 November 2011Climategate 2.0: Denialists Serve Up Two-Year-Old Turkey
@Mikel #68: Why whould SkS provide a forum to discuss the "legal" issues that you have raised? -
Mikel at 07:10 AM on 27 November 2011Climategate 2.0: Denialists Serve Up Two-Year-Old Turkey
66, JMurphy 67, Philippe Chantreau OK, I'll keep it brief and, yes, I have read the Muir Russell investigation report, the UEA undertaking to the ICO and seen the guidance from the ICO on research information. 1) Offence committed: Yes, but likely to be an offence under the Computer Misuse Act 1990 not the Theft Act. Although unlikely, a leak could be an offence under Section 55 Data Protection Act. Ultimately, a decision for the CPS; 2) Privacy, in particular privacy at work and the difference between privacy and confidentiality. Privacy in the UK derives from the Human Rights Act. Confidentiality can derive from common law, contract law, commercial/trade secrets, need to protect free/frank exchange of views, to name but a few; 3) Status of the IPCC with regard to rights of access to information. IPCC Secretariat is based in Switzerland and subject to Swiss law?; 4) Records retention policy, in particular with respect to email; 5) Ownership of research information. The academic or the institution? 6) Definition of 'holding' information. Use of personal accounts on external systems; 7) Anonymising personal data to remove that data from being covered by the Data Protection Act. Tension between absolute anonymity and highly probable anonymity in the DPA. -
Andy Skuce at 07:08 AM on 27 November 2011Schmittner et al. (2011) on Climate Sensitivity - the Good, the Bad, and the Ugly
I'll confess from the beginning that I don't understand, in Figure 1, what Marginal posterior probability distributions for equilibrium climate sensitivity really are. James Annan says of this figure:remember, they are not estimates of "the pdf of sensitivity" but rather, probabilistic estimates of the sensitivity - but they do need to overlap in order to be taken seriously
I'm not sure I grasp that distinction either. Nor do I understand why the land-ocean line has five peaks (penta-modal?) Is the lumpiness of this curve meaningful or is it just noise or artefact? Any help would be most welcome. -
Rob Painting at 06:52 AM on 27 November 2011Schmittner et al. (2011) on Climate Sensitivity - the Good, the Bad, and the Ugly
This is figure 4 from Schmittner (2011): Their temperature reconstruction (which they attempt to match the model to) seems to show Arctic temperatures at the Last Glacial Maximum (LGM) warmer than today.
-
Steve L at 06:48 AM on 27 November 2011The Debunking Handbook Part 4: The Worldview Backfire Effect
Hi Adelady, thanks. I've been thinking about what you've written. Also re-thinking about what I wrote. I suspect that the proper approach depends on the target audience (surprise!). This debunking handbook is a tool for people who are trying to win recruits or at least trying to soften opposition. Myers' site and many internet fora may be primarily about reassuring and motivating those already on-side. So, combining this with what you've written about honesty, the lesson may be that brutal honesty is effective within ranks but gentle, careful dishonesty(?) is the right approach outside. Intuitively I want to think that both approaches are useful (and ethical!) so I don't like what I've written here about how to interact with opponents. But really, the goal is finding the right tactic to eradicate misinformation that is protected by someone's cognitive psychology. We have to trick them into lowering that guard. It's called effective communication, and I'm not sure it's entirely honest. To avoid the 'Worldview Backfire Effect' when speaking with someone whose worldview one finds odious, perhaps dishonesty is required. Note, on another thread someone pointed to a Naomi Klein article in The Nation in which she indicated the climate problem was perfect for the Left, because addressing it requires supporting things the Left wanted anyway. Almost immediately someone jumped in to say that Klein needed to be pushed back because this is ammunition for political opponents. In searching for the article a second ago I found a Guardian column called "Dear Naomi Klein: Please Stop Making My Work Difficult." Here Klein's use of the word "reparations" needed to stop. The last line in Part 4 above says that framing isn't "about manipulating people." But it is. All communication is! The question I'm asking is whether it helps to reject/censor communication from one's own side if it has a chance of backfiring. Or is exposure of the target to a diversity of approaches more effective? -
skept.fr at 06:43 AM on 27 November 2011Schmittner et al. (2011) on Climate Sensitivity - the Good, the Bad, and the Ugly
dana #3 : "we might expect similarly radical climate changes to result from similar radical temperature changes" Oh yes, for sure. For example with just a small change in temperature and chiefly westerlies humid fluxes from the Atlantic, we know that large parts of Southern Europe (and France's 'Midi' for my personal interest!) may become a semi-arid region, very different from now. We don't need a 3 or 4 K local warming for that, a more modest switch in temperature/humidity mean and forced circulation would be sufficient. -
muoncounter at 06:41 AM on 27 November 2011Schmittner et al. (2011) on Climate Sensitivity - the Good, the Bad, and the Ugly
Tom C#1: "Over long time spans, the temperature change should equalize." Perhaps, but this MARGO graph and the accompanying paper suggest that the sea water temperature did not equalize: Our reconstruction reveals the presence of large longitudinal gradients in sea surface temperature in all of the ocean basins, in contrast to the simulations of the Last Glacial Maximum climate available at present.
Per the Schmittner paper, the MARGO data are the source for their SSTs. Can we expect land-based temperatures to 'equalize' with SST if there is such a distinct variation in SST? (Note that the yellow-beige represents an anomaly of +1C, as computed from LGM - WOA985 values).
The Schmittner model (their Fig. 3) neither matches the variation in this graphic nor shows 'equalized' temperatures from land to sea.
Our reconstruction reveals the presence of large longitudinal gradients in sea surface temperature in all of the ocean basins, in contrast to the simulations of the Last Glacial Maximum climate available at present.
Per the Schmittner paper, the MARGO data are the source for their SSTs. Can we expect land-based temperatures to 'equalize' with SST if there is such a distinct variation in SST? (Note that the yellow-beige represents an anomaly of +1C, as computed from LGM - WOA985 values).
The Schmittner model (their Fig. 3) neither matches the variation in this graphic nor shows 'equalized' temperatures from land to sea.
-
Jim Powell at 06:17 AM on 27 November 2011SkS public talks in Canada and AGU, San Francisco
Break a leg, John! You will do us proud. -
skept.fr at 06:16 AM on 27 November 2011Schmittner et al. (2011) on Climate Sensitivity - the Good, the Bad, and the Ugly
Tom Curtis #1 : "I have been wondering about the very different climate sensitivities determined using sea surface temperature data, and land data, as shown in figure 1. In general, climate change occurs faster over land than at sea, but that is because of the large thermal inertia of the oceans. Over long time spans, the temperature change should equalize." Interesting. Layman question : why would we expect the same equilibrium ∆T on oceanic and land surfaces ? For example, don't SST depend mainly on underlying circulation changes (changes in salinity, pressure, thermohaline, etc.) and land surface temperatures on other factors (such as vegetation density, melting of permanent ice at mid and high latitudes, etc.)? (For those interested by LGM, here , another work, more precise, with another model and proxy data set, Roche et al 2007) -
Albatross at 06:07 AM on 27 November 2011Schmittner et al. (2011) on Climate Sensitivity - the Good, the Bad, and the Ugly
skept.fr @2, Thanks for the link to the presentation on the preliminary CMIP5 results. Interesting. -
DrTsk at 06:01 AM on 27 November 2011Schmittner et al. (2011) on Climate Sensitivity - the Good, the Bad, and the Ugly
The sea level rise was used as an example of significant climate change. That will not happen now (maybe) but since we are heating up something else dramatic might happen. -
Albatross at 05:59 AM on 27 November 2011Schmittner et al. (2011) on Climate Sensitivity - the Good, the Bad, and the Ugly
Dr. James Annan has some thoughts on the new paper. -
dana1981 at 05:52 AM on 27 November 2011Schmittner et al. (2011) on Climate Sensitivity - the Good, the Bad, and the Ugly
skept @2:"how do we know if a 2,5 K warming imposed on initial conditions of the LGM has the same effect that a 2,5K warming on the present conditions, concerning sea-level rise?"
We don't, and I wouldn't expect them to have the same effect. I was just trying to give an example of the kinds of radical climate changes that occur during glacial-interglacial transitions. That's not to say a similar amount of warming now will cause the same climate changes, just that we might expect similarly radical climate changes to result from similar radical temperature changes. -
kampmannpeine at 05:52 AM on 27 November 2011SkS public talks in Canada and AGU, San Francisco
bon voyage ! and a lot of success! -
skept.fr at 05:38 AM on 27 November 2011Schmittner et al. (2011) on Climate Sensitivity - the Good, the Bad, and the Ugly
Healthy skepticism – I'm quite new here and I hope it is the case for all reconstructions! Your point is clear, this is just one sensitivity study among dozens already published, and one whose main result is very dependent of a new proxy data set for LGM. Even if it was nearly correct (only future debates and eventual replications of the results will tell), it would fall in the range of the IPCC AR4 sensitivity, with already 3 models out 17 in 2,1-2,3 K sensitivity for 2xCO2 (and the CMIP5 first results will probably keep this range of 2-4,5 K in the AR5). As Knutti et Hegerl 2008 pointed out in their review, most equilibrium sensitivity estimates with different methods are centered around 3K. "Another concern regarding the study is in the model they used..." I often read paleoclimate reconstruction with models of intermediate complexity. Maybe they are useful for approximate AO equilibrium on long period ("run faster" as Urban says), but far less realists than AOGCM on short-term variations (as Tamino showed)? See for example Claussen et al 2002 for explanations about EMICs, notably : "EMICs include most of the processes described in comprehensive models, albeit in a more reduced, i.e., a more parameterized form. They explicitly simulate the interactions among several components of the natural Earth system including biogeochemical cycles. On the other hand, EMICs are simple enough to allow for long-term climate simulations over several 10,000 years or even glacial cycles ." "If Schmittner et al. are right about climate sensitivity and LGM temperature change, then if we continue with business-as-usual GHG emissions, we will match the amount of warming between glacial and interglacial periods much sooner. Some of the differences between glacial and interglacial periods include 120 meter sea level rise" Here, a question : how do we know if a 2,5 K warming imposed on initial conditions of the LGM has the same effect that a 2,5K warming on the present conditions, concerning sea-level rise? For example, Vermeer et Rahmstorf 2010 found with a semi-empirical approach a 124 cm sea leval rise for 2,6 K in 2100 (see table 1), not 120 m. Even if it is transient climate response, it is hard to imagine that equilibrium response (for the same 2,6 K warming) would add 119 m. I suppose a complete Earth System Model (with A-O coupling on small grids, but also carbon cycle, vegetation, ice etc.) could tell us what would happen with a 2,6 K warming. If there is a high dependency to initial conditions, the previous LGM-Holocene transition is not necessary a good reference. -
Rob Painting at 05:33 AM on 27 November 2011What's Happening To Tuvalu Sea Level?
skept.fr @ 2 - See Timmerman (2010), the full paper is linked to in the post. The projections indicate an El Nino-like trend (a weakening of the wind-driven water mass) in the 21st century, which will oppose sea level rise (SLR) in the Pacific Islands. Sadly it's nowhere near enough to counter the contributions to SLR by thermal expansion and melting land ice. Victull @ 5 - see SkS post: Hiding the incline in sea level William @ 8 - Thanks. See the SkS rebuttals on coral atolls. I hyper-linked to it in the post, but it's not conspicuous. Further reading on this related topic is in the SkS rebuttal on coral bleaching. It is incredibly simplistic to think that sand accumulation (indicated in your link) will alleviate problems. I'm sure you can see the flaws of such "skeptic logic." I don't even broach the issue of ENSO (La Nina/El Nino) effects on rainfall in the tropical western Pacific, nor the threat of storm surge intensification. Add ocean acidification into the mix, and I expect most rational people can connect the dots. Tuvalu is living on borrowed time. -
Steve L at 05:29 AM on 27 November 2011What's Happening To Tuvalu Sea Level?
Hi Michael (@4) for all that interesting information. I was thinking in terms of detecting rising sea levels and understanding direct impacts in general. Sea level rises and falls with perhaps a decadal periodicity and AGW is adding an increasing trend on top of that. At the same time rain patterns change, there's irrigation, etc. That trend in aquifer salinity might not be easily detectable over short time scales. If saltwater contamination is an important prediction and outcome of AGW, then perhaps there should be a good baseline developed of the world's vulnerably coastal areas. I just briefly googled to see if there was a sort of global monitoring. I found this webpage for Tasmanian aquifer salinity. Looks to me as though good baselines probably aren't widespread. -
Tom Curtis at 05:28 AM on 27 November 2011Economic Growth and Climate Change Part 1 - Factors Influencing CO2 Emissions
MA Rodger @42, thankyou. I believe that this graph shows conclusively that natural variation is the major component in changes from year to year in atmospheric CO2 concentration. To avoid misrepresentation it should be noted that the graph does not show the annual emissions of CO2, but the change in the emissions from one year to the next. Had it shown the annual emissions, they would clearly have been much larger than the year to year fluctuations. Indeed, the first graph in post 40 shows exactly that. Therefore, and without any doubt, anthropogenic emissions are responsible for the long term trend in the graph of CO2 concentration. -
Philippe Chantreau at 05:20 AM on 27 November 2011Climategate 2.0: Denialists Serve Up Two-Year-Old Turkey
I'm not sure anyone can without more specifics Mikel. What are these "issues"? For a start, why don't you look in details at the various investigations that have already been conducted on these e-mails? The leftovers that are being served up now to attempt to derail the Durban talks have absolutely nothing new, so whatever "issues" are there were already there 2 years ago, I presume. -
Tom Curtis at 05:13 AM on 27 November 2011Schmittner et al. (2011) on Climate Sensitivity - the Good, the Bad, and the Ugly
I have been wondering about the very different climate sensitivities determined using sea surface temperature data, and land data, as shown in figure 1. In general, climate change occurs faster over land than at sea, but that is because of the large thermal inertia of the oceans. Over long time spans, the temperature change should equalize. Land temperatures should still show a greater day/night, seasonal and annual fluctuations, but should fluctuate about a mean that is close to sea surface temperatures. Once exception is if the SST freezes. In that event, "Sea Surface Temperatures" as measured by proxies will not actually be the Sea Surface Temperature, ie, the upper surface of the ice, but rather the temperature of the liquid water beneath the ice. That water will, of course, be just above freezing temperature. Consequently, sea surface temperatures have a floor below which they will not fall. The consequence of this is that the lower global means surface temperatures fall, and hence the more extensive the sea ice, the greater the discrepancy between global mean sea surface temperature and global mean Surface Air Temperature. Unfortunately, as temperatures rise, there is no ceiling on Sea Surface Temperatures (except for a runaway greenhouse effect). Ergo, with rising temperatures, SST will rise to match land Surface Air Temperatures. That being the case, the land only climate sensitivity (in green in figure 1) is probably a better predictor of future climate change with increased CO2 than are the ocean, or land and ocean values. -
MA Rodger at 05:10 AM on 27 November 2011Economic Growth and Climate Change Part 1 - Factors Influencing CO2 Emissions
Off-topic graph as requested @37.
-
Tom Curtis at 05:00 AM on 27 November 2011Lindzen and Choi find low climate sensitivity
Can I recommend that we take discussion of Schmittner et al across to the new post discussing it? -
JMurphy at 04:57 AM on 27 November 2011Climategate 2.0: Denialists Serve Up Two-Year-Old Turkey
What legal issues, Mikel ? -
william5331 at 04:56 AM on 27 November 2011What's Happening To Tuvalu Sea Level?
No argument whether sea level is rising or not or where it is rising. You have the hard data which says it is and any reasonable person would have to admit that the rise will most likely accelerate over the coming years. However, we may be focusing on the wrong factor. It could be that sea level rise is the least of the worries of the coral atoll nations. http://mtkass.blogspot.com/2011/09/by-by-coral-atolls.html William -
JMurphy at 04:54 AM on 27 November 2011Lindzen and Choi find low climate sensitivity
There is also an informative interview with Nathan Urban (second author of the Schmittner et al paper) at Planet3.org. He is not too happy about the way some so-called skeptics have used the graph shown in les's comment above, especially mentioning Pat Michaels. The interview also mentions the double-think of the so-called skeptics in general, because they can highlight and praise this paper as being something they find easier to believe in (because of the possibility of lower climate sensitivity); even though it also makes it very unlikely that Lindzen and Spencer are right with their claims that sensitivity is even lower, i.e. under 1. So, are Lindzen and Spencer now to be dismissed by the so-called skeptics ? As soon as pigs can fly... -
Mikel at 04:45 AM on 27 November 2011Climategate 2.0: Denialists Serve Up Two-Year-Old Turkey
64, Sphaerica Wow! I tried asking a polite question. Definitely did not expect such a response. I can answer your question, but I'll take the Moderator's advice before getting into a whole range of legal issues here. Perhaps someone else can answer my question.Response:[DB] Your original question:
"Is there any site dedicated to legal matters that discusses the legal issues raised by the content of these emails?"
You are ignoring the extremely large pink mamuk in the room: The theft of the emails was a crime currently under investigation. Your continued focus on the content of the stolen emails is misplaced.
Given that, Sphaerica's answer:
"there is no evidence whatsoever of anything remotely close to criminal activity in the content of the e-mails"
Is spot-on.
Edit: As is this quote from dhogaza over at RC:
"Stealing private e-mail discussions and publicizing them is akin to bugging the supreme court during their private deliberations and releasing the recording"
-
DrTsk at 04:27 AM on 27 November 2011Memo to Climategate Hacker: Poor Nations Don't Want Your Kind of Help
Thanks John. Good resources. -
John Hartz at 04:01 AM on 27 November 2011Memo to Climategate Hacker: Poor Nations Don't Want Your Kind of Help
As she surveys her small, bare plot in Zimbabwe's capital, farmer Janet Vambe knows something serious is happening, even if she has never heard of climate change. "Long ago, I could set my calendar with the date the rains started," the 72-year-old said. Nowadays, "we have to gamble with the rains. If you plant early you might lose and if you plant late you might win. We are at a loss of what to do." Paramu Mafongoya, a University of Zimbabwe agronomist, says Vambe's worries and those of millions of other poor farmers — most of them women — across Africa are a clear sign of the impact of climate change on a continent already struggling to feed itself. Changes have been noted in the timing and the distribution of rainfall on the continent. Zimbabweans say the rainy season has become shorter and more unpredictable, Mafongoya said. Climate change "is a serious threat to human life," Mafongoya said. "It affects agriculture and food security everywhere." Source: “Climate change hits Africa's poorest farmers” AP, Nov 26, 2011 To access this in-depth article, click here. -
skept.fr at 03:51 AM on 27 November 2011Economic Growth and Climate Change Part 1 - Factors Influencing CO2 Emissions
#39 muoncounter : "That is not a little effect; it is plainly visible on the CO2 emissions curve, as are the Arab oil embargoes, the post-Gulf War recession and even the GWB recession of 2001. Zooming in further, changes in US emissions very visibly drop during these economic stress points" Oh so, we can go back to the real topic of perseus post: if (fossil-based) economic growth is the major driver of CO2 emissions' upward trend since 1850, can we break the correlation in the future (keep the growth up with CO2 down) and if we can't, should we break the growth itself? (But these core questions will probably be treated in the part 2, so may be it is better to wait for the next perseus post? I don't know when (s)he plans to post). -
muoncounter at 03:47 AM on 27 November 2011Economic Growth and Climate Change Part 1 - Factors Influencing CO2 Emissions
Here's another look at the same graphic; this one by Ferdinand Engelbeen, via our very own Dikran Marsupial: Engelbeen also produced this graph, demonstrating a remarkably consistent slope (percentage of cumulative emissions remaining in the atmosphere) of 0.53:

-
muoncounter at 03:34 AM on 27 November 2011Economic Growth and Climate Change Part 1 - Factors Influencing CO2 Emissions
Tom C#37: "just how little major economic shocks actually effect the actual productive capacity (and production) of the global economic system." This graph (and others on more suitable scales) dispute that. "Even the great depression reduced CO2 annual emissions by only around15%26%" That is not a little effect; it is plainly visible on the CO2 emissions curve, as are the Arab oil embargoes, the post-Gulf War recession and even the GWB recession of 2001. Zooming in further, changes in US emissions very visibly drop during these economic stress points: tamino addressed this entire question here.
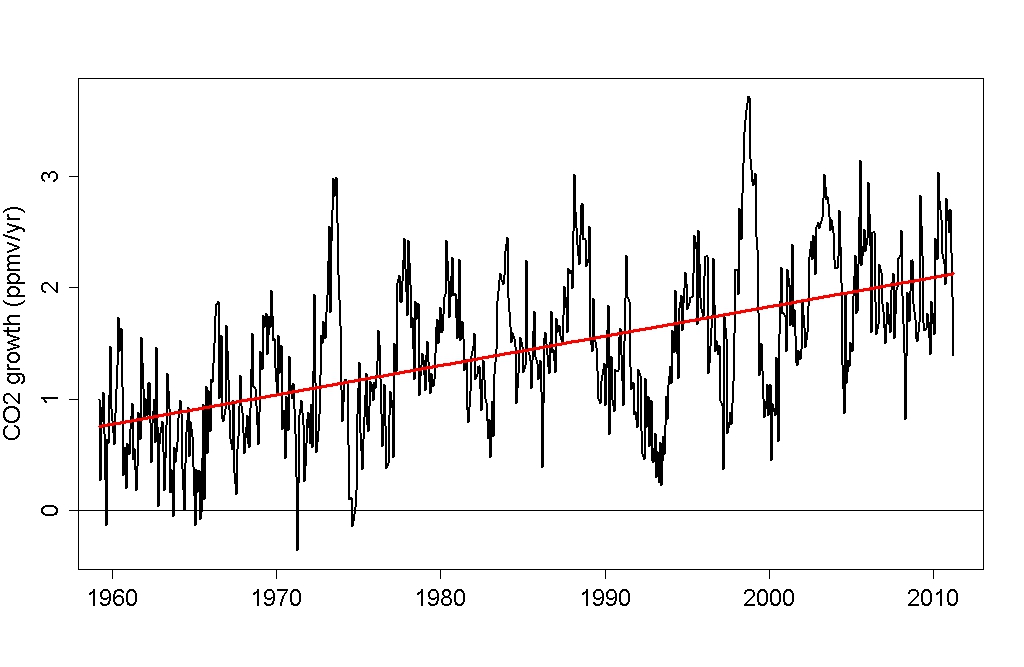 He models the CO2 growth curve remarkably well from a combination of the linear trend and MEI:

-
Daniel Bailey at 03:33 AM on 27 November 2011What's Happening To Tuvalu Sea Level?
Another thing to consider is that the human mind generally thinks in linear fashion on human timescales, which tend to be day-to-day. That makes it exceedingly difficult to grasp non-linear, or exponential changes. Like projected SLR vs that which already has occurred. -
les at 03:32 AM on 27 November 2011Lindzen and Choi find low climate sensitivity
An interesting contribution from the Azimuth blog, including a link to the paper, this graph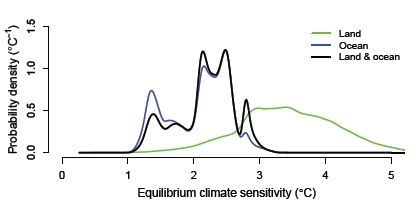 and a link to an interview with one of the authors.
-
DrTsk at 03:22 AM on 27 November 2011What's Happening To Tuvalu Sea Level?
@5 You can take any 10 year interval and see a leveling off a decline or even pink elephants. What in the "long-term rise" don't you get?? The same is true for temperatures droughts sea ice extent etc. False arguments and strawmen... -
Tom Curtis at 03:21 AM on 27 November 2011Economic Growth and Climate Change Part 1 - Factors Influencing CO2 Emissions
Slight correction, during the Great Depression, CO2 emissions fell from 1.145 GTC in 1929 to 0.847 GTC in 1932, a fall of 26%. -
Tom Curtis at 03:10 AM on 27 November 2011Economic Growth and Climate Change Part 1 - Factors Influencing CO2 Emissions
MA Rodger, would you please publish a graph showing: 1) The annual change in total emissions from year to year in GTC (GigatonnesCarbon); 2) The annual change in atmospheric CO2 from year to year in GTC; and 3) The annual change in atmospheric CO2 minus the change in total emissions in GTC. If you would do so, the argument between you and Sphaerica should be settled. I believe that such a graph will show conclusively that your interpretation is correct. I am unsure whether Sphaerica is misunderstanding you as saying natural variation dominates the long term trend (which is of course false), or whether he believes the short term variation in human CO2 production to be large. If the later, it would be because he is unaware just how little major economic shocks actually effect the actual productive capacity (and production) of the global economic system. Those shocks are not brought about by failings in fundamental economic capacity, but by failings in the superstructure of capitalism. As a result, unless they are left to fester (as in the Great Depression), they have little overall impact on actual production. Even the great depression reduced CO2 annual emissions by only around 15% (and hence involved only a 15% reduction in productive capacity). In terms of lost productive capacity, the Global Financial Crisis which still included massive economic growth in India and China, was barely a wimper. (This is not to downplay the real suffering it has caused for many people, but that suffering is not due to a loss of economic capacity, but due only to a loss of willingness to deploy that economic capacity by the holders of capital.) -
Bob Lacatena at 02:54 AM on 27 November 2011Economic Growth and Climate Change Part 1 - Factors Influencing CO2 Emissions
34, Tom, Yes. My simple complaint (without directly stating it) is that the atmospheric CO2 line appears to be detrended while the CO2 emissions line is not, and then they are presented with vastly different scales, masking the wobble in one while exaggerating it in the other. 35, MA Rodger, Picking one year is pointless. That's not how one does statistics. Honestly, your point isn't worth arguing, but you have had several posts with which to prove it and all I see evidence of there is an effort to sell your point rather than to clearly present the data. I'm not saying that you're wrong or right, I'm saying that you've used very unclear and ill-chosen graphics and numbers, with what appear to be rather arbitrary choices that wind up masking the relative factors, and so you have failed to prove your point. By this point, however, I'm simply bored with the issue. It's not worth this much discussion. -
MA Rodger at 02:28 AM on 27 November 2011Economic Growth and Climate Change Part 1 - Factors Influencing CO2 Emissions
My apologies Sphaerica @32. I never dreamt that what I'm saying here was either contentious or novel (It was however always off-topic, beginning as an innocent reply to the question @3.) So perhaps if I present a calculation of the maximum size of the blue wobbles that we should expect to see @28, that will settle this matter one way or the other (being off topic and all). If my calculation contains error, then I'm a blithering idiot and apologise. (I've no problem with that, but I'm not that often wrong.) (1)When shed of seasonal changes, the CO2 level MLO data exhibits a wobble and a rising trend. (2) The wobble's size is up to 2ppm peak to peak (as seen in graphs @12 (use left hand scale) & table @9). Less unusual in size, the 2006/10 wobble is some 0.75ppm peak-to-peak. (3) I contend that these wobbles are overwhelmingly natural. Three folk on this thread assert/suggest that I am wrong. (4) The largest variation in human emissions (twice the size of any other) is the change from 2009 to 2010 (as in red line in upper graph @8). This totals +512 - -122 = 634 million tons of carbon (or 0.634GtC). (5) Not all this carbon will remain in the atmosphere. The graph @28 uses 40% of all CO2. As land emissions are assumed for 2006-10 and treated as flat, I shall be very generous and use 60% in this calculation (so the wobble we are calculating here should be 50% bigger than the @28 graph). Thus Atmospheric CO2 wobble due to human emissions would be 0.634 x 0.6 = 0.3804 GtC. (6) It requires 2.13 GtC to raise atmospheric CO2 by 1ppm. So the 2009/10 wobble will be 0.3804 / 2.13 = 0.179ppm. (7) In comparison with the total wobble maximum p-t-p in graph @12, the maximum peak to peak wobble from emissions is thus 0.179ppm / 2ppm = 9%. The 2009/10 emissions wobble occurs during a total wobble of about 0.75ppm p-t-p, so for this one instance on the 50 year record, the human emission wobble almost manages a quarter of the total and would be less than a sixth if 40% was used in (5). The graph @28 does use this 40% & the graphed wobble is an expected 0.11ppm p-t-p. The impact on the residial wobble in the graph @28 is thus hard to spot. I do hope we can reach a resolution here in this off-topic point. (And I will leave it there without direct reply to @33 or @34) As ever, I am happy to own up to being a blithering idiot if I am in error. -
victull at 02:17 AM on 27 November 2011What's Happening To Tuvalu Sea Level?
I don't quite follow the point of this article. The 2000-2010 sea levels from Fig 1 look pretty flat for all the islands. There is certainly a rise from 1950-2000, so what is happening over the last 10 years? -
Tom Curtis at 02:09 AM on 27 November 2011Economic Growth and Climate Change Part 1 - Factors Influencing CO2 Emissions
Sphaerica @33, the black line @28 is the black line @12 minus the blue line @28. The blue line is the annual CO2 emissions scaled by 40% and reported in terms of change in ppmv to give it the same unit as the mauna loa data. As such, the two lines @28 break the annual CO2 increase into two components - a variation due to human emissions and that due to natural fluctuations. In order to do this, it is necessary that the human emissions be scaled to account for the average absorption of the emissions by the oceans and biosphere. That the 40% scaling is approximately correct is shown by the fact that the black line @28 looks like it has been detrended. As such MA Rodger's graph shows much the same information as Hansen and Sato's graph @17 except that MA Rodger shows the MEI, and also includes emissions from cement manufacture and land use change. I believe Hansen and Sato's presentation to be better. If MA Rodger was to continue graphing this data I would suggest he adopt the Hansen and Sato presentation, except showing the linear trend of the airborne fraction instead of the seven year mean. He could then show the detrended airborne fraction (mauna loa data) against the MEI, and idealy the VEI (and both together). Another interesting plot would be against the detrended global mean sea surface temperature. -
Bob Lacatena at 01:42 AM on 27 November 2011Climategate 2.0: Denialists Serve Up Two-Year-Old Turkey
63, Mikel, What legal issues are you suggesting? Stealing private e-mails is a crime. Hacking into a computer system for any purpose is a crime. You can read about that anywhere. Otherwise, there is no evidence whatsoever of anything remotely close to criminal activity in the content of the e-mails, so even asking a question about it is a slight-of-hand insult. It's like asking someone "Do you still beat your wife?" Asking the question is the crime itself. -
Bob Lacatena at 01:36 AM on 27 November 2011Economic Growth and Climate Change Part 1 - Factors Influencing CO2 Emissions
MA Rodger, And what exactly is the point of "40% emissions subtracted?" That seems like a rather arbitrary and unnecessary adjustment. And why is this graph suddenly so very, very different from the one posted in comment 12? You have some explaining to do. -
Mikel at 01:30 AM on 27 November 2011Climategate 2.0: Denialists Serve Up Two-Year-Old Turkey
Is there any site dedicated to legal matters that discusses the legal issues raised by the content of these emails? (this should not be construed as a criticism of the discussion here but I would like to separate out the legal from the scientific.) -
michael sweet at 01:27 AM on 27 November 2011What's Happening To Tuvalu Sea Level?
Steve, Indeed, Tuvalu has severe problems with salt water contamination of their groundwater. While there are some areas of Tuvalu that are three meters above sea level, the majority of the islands are less than 2 meters. When I visited Funafuti in 1989, there were large areas of some villages that flooded at king tides. I can only imagine how they are dealing with 10 cm more water (5.0 mm/yr times 20 years). Recent increases in wave heights cause substantial salt contamination of the aquafer by washing over the seaward sides of the island. If their stocks of ground water are contaminated they will have no water for their pigs and the coconut trees will stop producing. The recent La Nina related drought has caused stocks of rainwater (the primary drinking supply) to run low. Desalination is too expensive for the long run. How long will they be able to hold out? It is terrible. The Tuvaluans live a traditional lifestyle that they will not be able to replicate if they are forced to emigrate in masse. Tuvalu is a warning to the rest of us living in low lying areas. They do not have to be completely inundated to become uninhabitable. Miami will also run out of water (and storm drainage capacity) long before it is inundated. -
muoncounter at 01:09 AM on 27 November 2011Lindzen and Choi find low climate sensitivity
Perhaps the Schmittner et al sensitivity is low because their data are primarily sea surface temperatures: We combine recent syntheses of global sea surface temperatures (SSTs) from the Multiproxy Approach for the Reconstruction of the Glacial Ocean (MARGO) project and surface air temperatures over land based on pollen evidence, with additional data from ice sheets, land and ocean temperatures. The combined dataset covers over 26% of Earth’s surface (Fig. 1, top panel). In contrast to this balanced-sounding statement, the map in their Figure 1 reveals that there is actually very sparse data over land. Not surprisingly, their sensitivity is low because the find less cooling: Tropical Atlantic SSTs between 20°S–20°N are estimated to be only 2.4 K colder during the LGM in the new reconstruction compared to 3 K The MARGO 2009 results reveals an important caution, illustrated by this map:
Our reconstruction reveals the presence of large longitudinal gradients in sea surface temperature in all of the ocean basins, in contrast to the simulations of the Last Glacial Maximum climate available at present.
-
Bob Lacatena at 01:04 AM on 27 November 2011Economic Growth and Climate Change Part 1 - Factors Influencing CO2 Emissions
31, MA Rodger, If you are going to show CO2 atmospheric variation then you must also show CO2 emissions variation, and scaled proportionately to allow for a fair visual comparison. Compare apples and apples, not apples to miniaturized oranges rolling up a ramp. -
skept.fr at 23:20 PM on 26 November 2011World Energy Outlook 2011: “The door to 2°C is closing”
For charcoal substituting to coal, here a Hanrot et al 2009 study. Iron and steel industry accounts for 5% of total energy use, and 3-4% of GhG emissions according to Xu et Cang 2010 . Not the main issue for mitigation – if oil and coal could be used as commodities where they are strictly necessary in industrial processes rather than as energy sources for transport or electricity, it would be a great leap forward. I must emphasize (for all of us including me!) that if an energy-economy model is needful for simulating energy transitions, it is because in such discussions, we tend to poorly estimate the global quantities (requested for a certain level of production in the future) and furthermore, to add each energy solution in the mix a) without controlling that it is compatible with others in a certain land availability, b) without estimating the equilibrium cost of the energy in question and c) without ensuring that this energy can be implemented specifically where the needs (and workers!) are, or will be in 2050. Even energy-economy models have difficulties to track all the relevant factors, and this is probably one of the reasons for which they diverge in their conclusions about what we can and cannot do from now to 2050. -
MA Rodger at 20:09 PM on 26 November 2011Economic Growth and Climate Change Part 1 - Factors Influencing CO2 Emissions
Sphaerica @29. Blue line = CO2 annual increase (or decrease), 12 month rolling average (after a fashion) x 40% & plotted as ppm of atmosphere. Thus it is a trace of annual changes in emissions. For total emissions annual change in GtC multiply by 2.5*2130. (Perhaps the line is less wobbly that you were expecting.)
Prev 1411 1412 1413 1414 1415 1416 1417 1418 1419 1420 1421 1422 1423 1424 1425 1426 Next


