


 Arguments


Recent Comments
Prev 1469 1470 1471 1472 1473 1474 1475 1476 1477 1478 1479 1480 1481 1482 1483 1484 Next
Comments 73801 to 73850:
-
skywatcher at 14:49 PM on 27 September 2011Review of Rough Winds: Extreme Weather and Climate Change by James Powell
No Norman, your NOAA link shows 2011 to utterly put 1980 and any other year in the shade, for both Dallas and for Waco. If you don't think that breaking average temperature records by a the same amount as the span of 2nd to 10th place on the record table, then you and I have a very different idea of extreme. It was Texas' hottest summer by a clear margin, NOAA data shows this. In case it hasn't already been linked, Tamino has an interesting FEMA graph of the numbers of declared US disasters, with 2011 already top of the tree with three months to go. I'd say it's a more complete survey of extreme weather events than Pielke Jr's attempt to evaluate just coastal counties' hurricane damage (thus avoiding inland flooding from hurricane remnants), and doesn't involve sums of money. There are of course weaknesses as to how individual disasters are declared, but it is more evidence. Note how the rising trend with an early spike in 1998 looks rather familiar... European floods showing an increase, corroborated by the The International Disaster Database, where you can see that the trend in storm and flood damage is much more pronounced than the trend in geological disasters. If weather-related disasters worldwide are rising faster than geological disasters, Pielke Jr's nitpicks disappear. Powell is on the money, and it becomes clearer every year as what was once an abstract trend gets large enough to substantially impact people and productivity. That we see this happening worldwide is of course the key. -
Norman at 14:30 PM on 27 September 2011Review of Rough Winds: Extreme Weather and Climate Change by James Powell
skywatcher @62, Look at my last post at 61. It was much more extensive than on city in Texas. Also the drought post you refer to is from muoncounter. 1980 has not been put in the shade in terms of heat. It was one of the hottest years Texas has experienced. But the ground was not so dry as in 2011 and it did not cover as much area of Texas. Also skywatcher, I am not making a claim against AGW theory that the globe is getting warmer. And the term significant is one of those "in the eye of the beholder". I would agree many areas show warming. Not sure at this time if it is significant. Significant in what way? It is a matter of degrees. Maybe you can't stand it when the temp should be 88 (normal) and it is now 89 on a regular basis. For you this would be significant. Maybe not for others. This thread is not about global warming (evidence would suggest a degree or 2 of warming depending on your temperature scale). It is about extreme weather events. Are they increasing because of the global warming? That is what I question. I am not saying I am correct in my position. I just of the opinion that at this time there is not enough good, reliable data to make a sound judgement upon this issue. I see some blogs throw out the year's worst weather events and tell me things are getting worse. Maybe they are, I just need more evidence than one or two years worth of data. Need a lot more from a lot more areas and over a lot longer time period. Need a consistent way of logging an extreme event. I think monetary damage is not a good one. Hail size, area of coverage, duration of hail storm. That is much more scientific. Get enough of this data compiled and you can answer the question in a sound scientific way based upon solid data. What I intended with the Texas data of 1980 was to show that in one small location (as compared to the whole earth) in one year you have many extremes and disasters. Why should listing 30 global extremes lead me to think that climate is shifting in a very dangerous way? -
skywatcher at 14:15 PM on 27 September 2011Review of Rough Winds: Extreme Weather and Climate Change by James Powell
Norman, you cherry-pick one site (Dallas), then claim to wish to look at the whole globe? Nice goalpost shift there. Following your example, can I call on Russia (2010), Europe (2003), Pakistan (2010), Australia (2010), amongst a wealth of other examples, including (flippantly) Arctic heat in winter or British record-breaking heat in spring? Why not a global temperature dataset? Ah, they all show significant warming. We should be amazed because in Texas, 1980 has been utterly put in the shade by 2011 in terms of heat and drought severity, as shown by your NOAA link. Are the cats and dogs falling in your area yet? -
Norman at 14:15 PM on 27 September 2011Review of Rough Winds: Extreme Weather and Climate Change by James Powell
muoncounter @58 Here is what Wikipedia has to say about the 1980 drought. "The 1980 United States Heat Wave was a period of intense heat and drought that wreaked havoc on much of the midwestern United States throughout the summer of 1980. It is among the most devastating natural disasters in terms of deaths and destruction in U.S. history, claiming at least 1,700 lives[1] and because of the massive drought, agricultural damage reached US$20.0 billion (US$55.4 billion in 2007 dollars, adjusted for the GNP inflation index).[2] It is among the billion-dollar weather disasters listed by the National Oceanic and Atmospheric Administration" Wikipedia information on 1980 drought. Here is a NOAA chart of some of the most costly weather related disasters. The drought and heat of 1980 ranks very high in both life and property damage. Maybe you need to reconsider. The drought of 2011 would be higher on the PDSI because of low rain amounts from 2010. Areas were already dry. We will see how 2011 summer drought compares to 1980 in cost. NOAA chart of billion dollar weather related disasters in US. -
skywatcher at 14:07 PM on 27 September 2011Review of Rough Winds: Extreme Weather and Climate Change by James Powell
Norman, you tried to cherry-pick one site, yet from your link, that site is #1 in all the temperature records for August (high max, min, average), and all but the high max for the summer. Hardly supportive of this being a typical year. Following the link on the NOAA page for Waco also shows the extremes. When average temperatures for a month are broken by >2F (Dallas) and 3F (Waco), and for the entire summer by >1F, you don't have to wonder if it is extreme. You do realise how hard it is to break a monthly average temperature record by that much? Look at 2nd-10th rankings for the average temperatures at these sites: they span 2.6F for Dallas, 1.7F for Waco. The new records are so far above the older series that they show the records being not just broken, but utterly smashed. muoncounter's NOAA map summarises it nicely too. These droughts are not similar. -
dana1981 at 14:06 PM on 27 September 2011Pielke Sr. Agrees with SkS on Reducing Carbon Emissions
mdenison - I think Pielke believes the methane and black soot forcings are underestimated. I certainly disagree on methane, as will be discussed in the Disagreements post. Black carbon he may have something of a point. It's possible that both the negative and positive forcings from aerosols and black carbon are underestimated by the IPCC. I think we discuss this in the Disagreements post too. -
Norman at 13:54 PM on 27 September 2011Review of Rough Winds: Extreme Weather and Climate Change by James Powell
I am posting a link to an article on the extremes of weather in Texas in 1980 for a reference. The claim is that weather is getting weirder. But remember now we are using the entire globe as our sampling table. If one State in one year can have all these extremes (some very wet places, some super dry, some really hot, some really cold, some very snowy places...all one state all one year), why should any be amazed that there are extremes in 2011? Wild Texas weather in 1980. -
muoncounter at 13:46 PM on 27 September 2011Review of Rough Winds: Extreme Weather and Climate Change by James Powell
Norman, By the 1980 drought, you mean this: PDSI, August 1980: as opposed to PDSI, August 2011:
 Yep, they look about the same.
You can look at the monthly US PDSI history here
Yep, they look about the same.
You can look at the monthly US PDSI history here
-
Norman at 13:36 PM on 27 September 2011Review of Rough Winds: Extreme Weather and Climate Change by James Powell
muoncounter @45 "Norman's thesis appears to be 'yeah, but this has all happened before.' 'This' being drought, heatwave, flooding, windstorms, tornadoes, etc. Until it literally starts raining cats and dogs, he's right. Its just that the list of 'yeah, buts' keeps getting longer." Not a thesis. Just looking at evidence. Here are some links for you to check out and see what you think. You can clearly see that listing weather disasters strictly by a dollar value can give very misleading results on trend lines and after more detailed analysis is performed, the trends are no longer there. Normalized Hurricane damage shows no trend. Quote from article: "Across both normalization methods, there is no remaining trend of increasing absolute damage in the data set, which follows the lack of trends in landfall frequency or intensity observed over the twentieth century." Here is another study done on floods. It depends upon how you calculate the losses that determines what is actually going on. Three types of graphs are given using different approaches to financial loss. Floods in USA. -
Norman at 13:25 PM on 27 September 2011Review of Rough Winds: Extreme Weather and Climate Change by James Powell
Eric (skeptic) @49 Your quote says that only one summer (1789) matched 2011 summer drought in Texas. The question I have for you is how many others were close. Maybe only one matched but maybe 20 or 30 were close enough. Not enough data in your quote to form a valid conclusion on the extremity of the 2011 Texas drought. -
Norman at 13:20 PM on 27 September 2011Review of Rough Winds: Extreme Weather and Climate Change by James Powell
skywatcher @44 I believe a valid explanation of the Texas 2011 point on the John Nielsen-Gammon (way outside the cluster) is that this year's drought covered more area and with a similar drought in the 1980's, this one shows up much worse because it could have included area that 1980 did not reach. Here is a NOAA page with 1980 vs 2011 in the Dallas FortWorth area (DFW). 2011 was not much different than 1980 in this area. In fact 2011 had almost 2" more of rain in the area as compared to 1980. Night temps were warmer in 2011 but 86 F is not a brutal temp that would likely lead to death. 1980 vs 2011. -
Crispy at 13:01 PM on 27 September 2011Monckton, the Anti-Nurse
I have heard it said that ridicule is a last resort when you have run out of arguments to put, but I think its use is broader than that, and employed by both sides of the war. 'Christy Crocks' and 'Lindzen Illusions' are whimsical headings, but arguably ridicule. And fair enough, I say. Albatross notes this is a 'PR game' for the deniers. But it is really a PR game for all of us - concerned laypeople, scientists; skeptics and industry drones alike. Hearts and minds have to be won to one side or the other, and we are all doing PR, like it or not. It's a shame we can't have a bipartisan approach to this issue, but so be it. War it is. As to ridicule, (neat segue coming up), Australian readers of SkS might like to check out 'Crownies' on ABC1 this Thursday 29/9, 8.30pm. Climate Change makes it into pop culture, with B-story status at least, with a denialist in court against a climate scientist. Regulars can play Climate Blog Bingo and tick off the skeptic memes. You may recognise some of the one line rebuttals :). And a few less than subtle references to key players. The issue is skated over, as only TV can. But if you like a bit of ridicule in your war, this episode is fun. Thursday. 8.30. -
mdenison at 11:24 AM on 27 September 2011Pielke Sr. Agrees with SkS on Reducing Carbon Emissions
dana1981 @28 I would also very much like to see Professor Pielke explain the 26%. I have been through the calculation on his web site which appears to differ considerably from that made in the TAR. As he said this was a back of the envelope estimate from several years ago which probably explains why I found it so odd to follow. I am sure he would appreciate the opportunity to clarify with the latest data. An update of his website would be useful. It appears to me that an estimate of CO2's relative impact now and in the future is central to differences expressed in the previous posts over his hypothesis 2a and 2b. I read his EOS forum article and references but could not agree with him that the literature provides support hypothesis 2a over 2b. I am inclined to think that my approach seeking quantitative estimates of forcing is not his approach. Unfortunately I have not been able to find his analysis in the literature. In some ways I find hypothesis 2a has some merit. I think if I have understood Professor Pielke's viewpoint correctly he has concerns that by focusing constantly on global change we miss the point that we will all experience climate change locally. Some anthropogenic changes such as BC in the Himalaya or land uses change such as deforestation in the tropics will have far a greater local than global impact on climate. Although perceived as small effects on the global stage compared to CO2 they could remain significant concerns to those affected. Perhaps we could find more common ground by understanding why he thinks CO2 is not the dominating issue for the coming century. -
skywatcher at 10:17 AM on 27 September 2011Review of Rough Winds: Extreme Weather and Climate Change by James Powell
Hi Norman - what I took from Stu Ostro's presentation was that there was the observation that quite often extreme events happened around these large pressure anomalies. I didn't see him indicate a causal mechanism, and so his idea is firmly in 'hypothesis' territory. I would have thought that ordinary blocking events provide the conditions under which dry weatehr has the opportunity to become extremely dry, and wetter weather has the chance to be extremely wet. In that case the blocking itself may not have changed much (though Ostro shows some very extreme values). The weather extremes are thus a result of higher average temperatures and a greater capacity to evaporate or hold more water vapour in the atmosphere - these are of course known consequences of the enhanced greenhouse effect. It remains an interesting possibility that blocking itself may have changed either in location or in strength, leading to greater extremes and/or extremes in places less used to them. -
Norman at 10:02 AM on 27 September 2011Review of Rough Winds: Extreme Weather and Climate Change by James Powell
skywatcher @ 44 I am going through the presentation by Stu Ostro. It is interesting but I am not completely following the connection to Global Warming. Ridges at the 500 mb level prevent troughs from moving and create extreme weather in these areas. I was not sure he made a clear explanation of how global warming is changing patterns. I will continue to digest and research the material as time permints. I thank you for reposting this. I remember looking at it earlier. Here is a few month's worth of 500 mb anomalies from December 2003 to February 2004. Animation of 500 mb anomalies. What I am trying to determine is if Stu Ostro's presentation of anomalies at 500 mb level is really that extreme. I am looking for more animations of this pressure level to determine height anomalies and get some form of what normally occurs. It is a way for me to verify this presentation. -
Stephen Baines at 09:58 AM on 27 September 2011CERN - Saying Nothing About Cosmic Ray Effects on Climate
Riccardo makes a good point. Also the fact that there is a greater effect with a smaller sampling size (less events as amplitude of FD increases) also worries me. I would have conducted a more robust null model, maybe a Monte Carlo simulation that generated sets of randomly placed events, just to see what the odds of getting an apparent significant effect by random chance, and how that changed with the threshold used. -
skywatcher at 09:50 AM on 27 September 2011CERN - Saying Nothing About Cosmic Ray Effects on Climate
tblakeslee, I think we should ignore your arguments until you respond to David Lewis' comment at #99 regarding Richard Alley's presentation. If cosmic rays had little effect during this massive excursion 40kyr ago (cosmic ray flux doubled for a thousand years), why should the much smaller variations have any sizeable effect at all? This is quite apart from all the other reasons that we know cosmic rays are nothing more than a fine tuning knob. -
dana1981 at 09:49 AM on 27 September 2011Pielke Sr. Agrees with SkS on Reducing Carbon Emissions
also Dana69 @28:"I am not sure what the specific difference is"
Man-made CO2 is actually only about 3-5% of annual global CO2 emissions. However, the natural carbon cycle is in balance (nature absorbs slightly more carbon than it emits), so humans are responsible for 100% of the annual atmospheric CO2 increase. However, what Dr. Pielke was referring to was the global energy imbalance. Effects like an increased greenhouse effect or increased solar activity can throw off the Earth's energy balance, leading to more incoming than outgoing energy. Global warming is the result of this sort of energy imbalance. Dr. Pielke claimed that CO2 was responsible for 26% of the current energy imbalance (the rest is other greenhouse gases, black carbon, etc.). Based on the scientific literature, we believe it's twice that (about 50%). -
dana1981 at 09:40 AM on 27 September 2011Pielke Sr. Agrees with SkS on Reducing Carbon Emissions
Dana69 @28 - that CO2 is not the only factor was another of our agreements with Dr. Pielke, discussed in this post."Although CO2 is one of the primary causes of the current climate change (more on the magnitude of its effects in a separate post), we agree with Dr. Pielke that other climate influences such as land-use change must also be addressed through climate policy."
CO2 is, however, the largest single factor causing global warming (again, we'll discuss this further in the Disagreements post). As a side note, the Disagreements post will likely be delayed to give Dr. Pielke a chance to respond to this post, as he's currently traveling. -
muoncounter at 09:40 AM on 27 September 2011CERN - Saying Nothing About Cosmic Ray Effects on Climate
Here's the prior comment. The Dragic paper is quite good: with FDs that reduce the count rate by 7%, there's a detectable increase in DTR, but for FDs with only a 5% decrease, the effect disappears. Did someone say 'hardly a robust result'? -
Philippe Chantreau at 09:27 AM on 27 September 2011CERN - Saying Nothing About Cosmic Ray Effects on Climate
Re Tblakeslee at 100: Do you realize that this is the very same Dragic paper that Muouncounter linked to earlier to showq that events that may have an effect, as small as it might be, are rare and happen only a few times a year? -
Dana69 at 09:12 AM on 27 September 2011Pielke Sr. Agrees with SkS on Reducing Carbon Emissions
Dave123 @16 You ask me to validate Dr. Pielke Sr. data. He provides his supporting data in most of his posts. "First, the climate system is much more than just a globally averaged surface temperature. Even with respect to global annual averaged radiative imbalance, the retention of the scientifically inaccurate use of surface temperature trends (with its lags) is unnecessary. The changes in the ocean heat content over time, when accurately measured, provides a diagnostic of the radiative imbalance without the need for considering lags or a so-called “climate sensitivity”." ( -Snip- ) I am going to go outside the bounds for a second and tell you I have been following Dikran Marsupials responses, both here and other sites, and I have to say he has an impressive intellectual mind. I am not sure of his background, or credentials, but he is someone with a firm grasp of ideas and an impressive array of responses. Are peoples credentials published here, or is this more of a closed site for peoples backgrounds? Lastly, I was wrong when I stated: "He made the claim that man-made CO2 was responsible for about 26% of the yearly global emissions. I did not see any refutation of this claim. I was corrected when it was pointed out Dr. Pielke actual stated: "that CO2 is responsible for 26% of the net positive radiative forcing, which is very different than what you claim he said." I am not sure what the specific difference is, but it does seem to suggest that it is not the entire equation. It may be a factor, but not THE factor. The only implication of this conclusion is political, not scientific. Science talks about what is, politics talks about what ought. Respectfully,Response:[DB] Quote seemingly attributed to RPSr snipped due to language.
"Are peoples credentials published here, or is this more of a closed site for peoples backgrounds?"
What matters at SkS is the scientific strength of the argument, not any credentials. Participants comments are thus judged and weighed on their own merits. Nothing else need matter. That being said, some members of SkS have a short bio located here (not a comprehensive list).
"It may be a factor, but not THE factor."
Based on what? You give us nothing to work with here.
"The only implication of this conclusion is political, not scientific."
Actually the scientific implications dwarf the political ones. If the laws of physics are any guide, a great deal of humanity stands to find out those selfsame implications.
"A man should look for what is, and not for what he thinks should be." ~ Albert Einstein
-
Dave123 at 08:41 AM on 27 September 2011Galactic cosmic rays: Backing the wrong horse
Which suggests that lower troposphere air masses that are supersaturated with water perform condensation to form clouds without needing much assistance from cosmic rays. There seems to be no shortage of 'nucleators' available. -
Riccardo at 08:25 AM on 27 September 2011CERN - Saying Nothing About Cosmic Ray Effects on Climate
Even a cursory reality check makes the 0.5 °C DTR change for a 10% decrease in cosmic rays unlikely. The same 10% are aproximately the GCR intensity variation during half solar cycle; this means that we should see a 1 °C swing in DTR every 11 years. Anyone noticed it? -
Peter Hogarth at 07:54 AM on 27 September 2011CERN - Saying Nothing About Cosmic Ray Effects on Climate
tblakeslee: Interesting, but here are some other recent papers. See: Erlykin 2011“The contribution of CR to ‘climate change’ is quite negligible” Magee 2011 “the scientific rhubarb over cosmic/cloud connectivity can be made into a delicious pie” (!) Sloan 2011 “It is shown that, if such a link exists, the changing cosmic ray intensity contributes less than 8% to the increase in the mean global surface temperature observed since 1900” -
Riccardo at 07:22 AM on 27 September 2011Ocean Heat Content And The Importance Of The Deep Ocean
ENSO does not influence the deep ocean but involves an up and down movement of the thermocline. The "climastrological" interpretation of ENSO given by tblakeslee #30 is irrelevant here. -
tblakeslee at 07:15 AM on 27 September 2011CERN - Saying Nothing About Cosmic Ray Effects on Climate
Here is a new paper that shows the sun-cloud connection in the real world by looking at diurnal temperature range (DTR) which is the difference between the high and the low of the day. You may remember that after 9/11, when the airplanes were grounded, the DTR increased due to the decreased cloud cover with no contrails. Plotting the DTR after 13 Forbush events (coronal mass ejections) that abruptly decreased cosmic rays by at least 10%. Figure 5 shows a DTR deviation curve that very cleanly peaks three days after the event at .5 degrees centigrade. http://www.astrophys-space-sci-trans.net/7/315/2011/astra-7-315-2011.pdf -
dana1981 at 07:08 AM on 27 September 2011Lessons from Past Climate Predictions: IPCC AR4 (update)
Agreed skywatcher - there's not much to disagree with in the conclusions, which are pretty darn wishy-washy (as necessary due to the lack of data available), so the criticisms are necessarily nitpicky. Regarding the claim that starting in 2000 was a cherrypick - aside from the fact that the AR4 model run began in 2000, it wasn't a particularly cold year either. By 2000-2010 standards sure, but at the time, it was the 6th-hottest year on record, and hotter than the 1990-1999 average. The only reason it was relatively cold is that the past decade has been so hot! It's funny that the same people who are arguing there's been little to no warming over the past decade are also arguing that 2000, which at the time was exceptionally hot (6th-hottest year on record) now must be considered a cold year. As for ENSO, the end of 2010 saw a moderate La Nina which was reflected in the early 2011 temperatures, which I could have excluded by looking at just 2000-2010 or 2001-2010 observational data. But I didn't, I included all data through July 2011, including those months impacted by La Nina. In short, that particularl nitpick is just plain wrong. -
David Lewis at 07:04 AM on 27 September 2011Galactic cosmic rays: Backing the wrong horse
Rob @33 I just put in the references and quotes from Alley's presentation because I wasn't seeing his argument made in the post. I wrote it more for people who might be dropping in on the site as opposed to those creating it. I assumed the people involved with creating this site are well aware of Dr. Alley, his AGU presentation, and his body of work. I think Dr. Alley's point about cosmic rays and their influence on climate is very strong. Hansen often makes his points citing paleo data because as he says all possible feedbacks and factors are in there. Whatever the exact processes are, that may or may not affect clouds, that are influenced by variations in cosmic rays, the paleo data shows that a dramatic variation of the abundance of cosmic rays on a millenia time scale in the past had no climate effect. Its the kind of data that would really take the wind out of your sails if you were saying you felt like you were on the brink of discovering some new major factor to climate science. If you were at all rational that is. -
IanC at 06:55 AM on 27 September 2011Ocean Heat Content And The Importance Of The Deep Ocean
tblakeslee @37 ENSO is a result of non-linear coupling between the atmosphere and ocean, so you are asserting that a prediction that completely ignores the atmosphere and ocean is based on sound physics? Landscheidt's later predictions are in fact several times wrong. La Nina after APR04-APR05: Wrong. SOI indicates a warm phase El Nino from MAY05-APR06: Wrong. SOI indicates a cool phase Lastly, if ENSO is truly the result of sun cycles, then how do you explain ENSO cycles seen in climate models without those cycles built in? -
Peter Hogarth at 06:42 AM on 27 September 2011Extreme Flooding In 2010-2011 Lowers Global Sea Level
Hi Rob, Just to add to the graphics above (figure 3). I think this is what is known as an interesting correlation.
-
Albatross at 06:36 AM on 27 September 2011Galactic cosmic rays: Backing the wrong horse
Hat tip to "AGW Observer". A paper is in press at J. Climate by Agee et al. (2011), they conclude: "An updated assessment has been made of the proposed hypothesis that “galactic cosmic rays (GCRs) are positively correlated with lower troposphere global cloudiness.” A brief review of the many conflicting studies that attempt to prove or disprove this hypothesis is also presented. It has been determined in this assessment that the recent extended quiet period (QP) between solar cycles 23–24 has led to a record high level of GCRs, which in turn has been accompanied by a record low level of lower troposphere global cloudiness. This represents a possible observational disconnect, and the update presented here continues to support the need for further research on the GCR-Cloud hypothesis and its possible role in the science of climate change." In other words, the increase in cosmic rays has not been associated with an increase in lower tropospheric cloud cover as predicted by the GCR hypothesis, in fact it has been associated with a record low level of lower troposphere global cloudiness. This finding also points to a positive feedback between warming and clouds. -
Rob Honeycutt at 06:17 AM on 27 September 2011Galactic cosmic rays: Backing the wrong horse
David... Believe me, I think that Alley lecture has made the rounds here. I've watched it several times myself. The moderators here use it quite frequently as a place where people can start learning more about climate science. Dr Alley is somewhat of a hero around these parts. My point was that I believe there was a lot of infighting over whether to fund the CLOUD research in the first place (though, admittedly I've done little research on this). Of course AGW deniers call this out to "prove" that the climate research community is against them but there are lots of people with lots of research projects and CERN has to pick and choose what research goes forward and what gets rejected. The CLOUD project, obviously, was approved. My point was, reinforcing what Alley was saying that "it's a small control knob at best." Based on previous research it's unlikely that the CLOUD project is going to turn up anything BIG with regard to cloud nucleation and climate effects. -
Stephen Baines at 06:14 AM on 27 September 2011Ocean Heat Content And The Importance Of The Deep Ocean
tbl @ 37. Did he also predict that 2010 would tie for warmest in the instrumental record despite the la nina? -
chris at 06:10 AM on 27 September 2011Ocean Heat Content And The Importance Of The Deep Ocean
That's silly tblakeslee. Sea level data is obtained either from tide gauges or satellite ocean surface height measures. Tide gauge averages composite the individual sea level records from different tide gauges in different locations to provide an average sea level (and thus can be used to determine an average sea level change). The use of tide gauge records to composite local sea level measures doesn't involve averaging the tides! Any work of fundamental value to the scientific community is well cited. I suspect that the problems with the paper that I pointed out above are widely recognised, and therefore the work isn't that useful. -
Albatross at 06:07 AM on 27 September 2011Monckton, the Anti-Nurse
Dhogaza and Dana, Thanks for clarifying Dana. Yes, of course Tamino was not part of the belittling and ridiculing of Dr. Nurse-- quite the opposite, and that would quickly become evident upon reading the Tamino post that I linked to. I directed people there for two reasons: 1) To see the offending cartoon, and 2) So they could at the same time see how misleading it is. But yes, that that cartoon was originally published at WUWT. Dana, re your side note. Watts et al. are probably doing that to make up for the fact that they cannot make a coherent, substantive and internally consistent scientific argument against the theory of AGW and against the overwhelming science. As I said before it is a game for them, a PR game, that and they have to keep feeding fodder to those in denial about AGW and its consequences...sadly doing so is frighteningly easy. -
tblakeslee at 05:49 AM on 27 September 2011Ocean Heat Content And The Importance Of The Deep Ocean
Chris 34 The idea of averaging tides makes no sense as they all average to zero. Look at the tide charts and you will find that they are only for specific locations. The tide is a wave that moves as the planet and moon rotate. It would be useful to separately analyze other tide stations but averaging would just destroy the data. The tides are very predictable just as the tides on the sun are predictable. "This work has hardly been cited since it was published. That's usually an indication that it doesn't provide much insight into fundamental understanding..." Or that, like an elephant under the rug, it was simply ignored.Response:[DB] "Or that, like an elephant under the rug, it was simply ignored."
In all things, the simplest explanation is usually the best. In this case, the absence of supporting observations coupled with a already-formed understanding of the physics underlying what we do see explains the lack of citations.
Thus, Shaviv's work (while interesting) is simply not relevant given the established science. Beating this dead horse as you do is like calling a dog's tail a 5th leg: the dog still has but 4 legs, as calling a tail a leg doesn't make it so.
-
dana1981 at 05:49 AM on 27 September 2011Monckton, the Anti-Nurse
I think Albatross meant that his second link (to tamino) discussed a second belittling (via cartooning) of Nurse, not that tamino was belittling Nurse. As a side note, what's with all the "skeptic" cartoons belittling prominent climate figures these days? First Nurse, then Dessler, then John Cook. None of them accurate or particularly funny, either. -
tblakeslee at 05:36 AM on 27 September 2011Ocean Heat Content And The Importance Of The Deep Ocean
Dikran 31 Landsheidt based his predictions on sound physics based on the gravitational effects of the nearest planets on the sun and its angular momentum. The magnetic fields are generated by the sun acting as a dynamo. Here is a paper by Ian Wilson that explains it. http://climatestop.com/Ian_Wilson_Syzygy.pdf After 2002 the predictions continue to be correct including accurate prediction of last years la nina and its return next year. In fact it will be very obvious in the next two decades if he is right as he predicted mostly la ninas for a long time resulting in another little ice age. -
David Lewis at 05:33 AM on 27 September 2011Galactic cosmic rays: Backing the wrong horse
@30 - OK I posted it over there. @31 - Dr. Alley wasn't critical of anyone who wanted to look into this line of research. He was forceful when expressing what he thought would come of it - "a fine tuning knob, at best". What is incredible is how so many who observe the overall climate debate believe deniers making third rate arguments on issues like this should be taken as equally credible as types like Dr. Alley. Dr. Alley's previously mentioned AGU presentation is extremely entertaining. The AGU is the largest gathering of planetary scientists that occurs annually in the world, and the Bjerknes Lecture is one of its high points. Dr. Alley started his presentation by reading out an email sent to his superiors at Penn State which called on Penn State to fire him because he was misleading the world about the role CO2 plays in determining Earth's climate. This greatly amused those present at the lecture. He then proceeded in his inimitable way, with broad brushstrokes, to outline why climate scientists believe CO2 is the "biggest control knob" controlling climate. The video is worth watching and studying. -
dhogaza at 05:31 AM on 27 September 2011Monckton, the Anti-Nurse
Albatross: " They have also belittled Dr. Nurse here and here. " Your second "here" actually points to a post by Tamino at his Open Mind blog, and is hardly belittling of Dr. Nurse. Just the opposite, it's a takedown of Watts' favorite house cartoonist's attempt to belittle Dr. Nurse ... -
David Lewis at 05:18 AM on 27 September 2011CERN - Saying Nothing About Cosmic Ray Effects on Climate
Richard Alley discussed this line of research during his 2009 AGU Bjerknes Lecture, which was entitled "The Biggest Control Knob". A video of his entire lecture is available here. He discusses cosmic rays starting at the 42 minutes 5 seconds mark. He pointed out that the paleoclimate data show that a significant variation in the amount of cosmic rays did not cause climate change. "There's really good science to be done on this. But we have reason to believe its a fine tuning knob...." "Its a really interesting hypothesis....":
"People say the Sun doesn't change much but the Sun modulates the cosmic rays, the cosmic rays modulate the clouds, the clouds modulate the temperature, so the Sun is amplified hugely...."
"Now the Sun modulates cosmic rays..."
"Its a really interesting hypothesis....":
"People say the Sun doesn't change much but the Sun modulates the cosmic rays, the cosmic rays modulate the clouds, the clouds modulate the temperature, so the Sun is amplified hugely...."
"Now the Sun modulates cosmic rays..."
 "...but so does the magnetic field".
"And 40,000 years ago the magnetic field basically zeroed out in what we call the LasChamp anomaly for a millenium or so. And when it did, cosmic rays came screaming into the Earth system and you see, in basically all sedimentary records, this peak of cosmic ray produced nuclides".
[ He displayed this chart ]
"...but so does the magnetic field".
"And 40,000 years ago the magnetic field basically zeroed out in what we call the LasChamp anomaly for a millenium or so. And when it did, cosmic rays came screaming into the Earth system and you see, in basically all sedimentary records, this peak of cosmic ray produced nuclides".
[ He displayed this chart ]
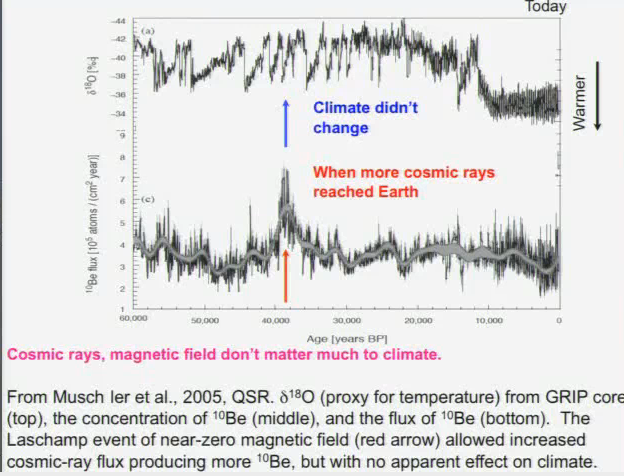 "We had a BIG cosmic ray signal, and the climate ignores it. And its just about that simple. These cosmic rays didn't do enough that you can see it."
-
Michael.M at 05:11 AM on 27 September 2011Monckton, the Anti-Nurse
Something that could be added to the Monckton Myth's link-list: The Clerk of the Parliaments finally wrote a letter to him, daclaring that he is not and has never been a member of the House of Lords: A letter to Viscount Monckton of Brenchley from the Clerk of the Parliaments Best part: "... I am publishing this letter on the parliamentary website so that anybody who wishes to check whether you are a Member of the House of Lords can view this official confirmation that you are not. ..." -
Pete Dunkelberg at 04:47 AM on 27 September 2011Ocean Heat Content And The Importance Of The Deep Ocean
Rob Painting @ 25 "Heat (as in longwave radiation) doesn't warm the upper ocean." etc - I think Science of Doom had a detailed post on this, showing how heat gets into the water millimeter by millimeter. You might take a look. -
Rob Honeycutt at 04:41 AM on 27 September 2011Galactic cosmic rays: Backing the wrong horse
David... I've used that exact same point in Alley's lecture about a dozen times now on various discussion sites when skeptics have brought up the Kirby paper. I don't know for sure but I would speculate that some of the push back from the science community on whether the CLOUD experiments should be done is based on this research. Muscheler 2005 is a pretty clear indicator that GCRs don't have a strong affect on climate. It's interesting research looking into how cloud nucleation occurs but if GCRs had a significant effect I think it would have shown as much in the Muscheler paper. -
Paul from VA at 04:23 AM on 27 September 2011Ocean Heat Content And The Importance Of The Deep Ocean
@30 tblakesee There's absolutely zero evidence that ENSO follows a similar cycle to the solar cycle. Anytime something is cyclic, the best way to determine the period is usally to take a Fourier Transform of the data. The 11-year solar cycle, for instance, shows up pretty blatantly. However, when you look at the ENSO data, you don't find a single strong period, and the strongest ones you can find are at 5 and 3 year intervals, not 11. Below is a Fourier transform of the relevant monthly data sets. I multiplied ENSO data by a factor of ten since the amplitude of the sunspot cycle is ~100 and ENSO is ~10. Plot is vs. frequency so to convert to period P(years)=1/frequency. See that the solar cycle peaks at ~0.09 cycles/year as it should, but ENSO shows very little periodicity over anything frequency less than 0.2 cycles/year (period greater than 5 years).
-
Albatross at 03:43 AM on 27 September 2011Galactic cosmic rays: Backing the wrong horse
David @29, Thanks for posting that. That was actually one of the examples that came to mind when was referring to the paleo record and GCRs in a post on another GCR thread. Would you mind reposting this on that thread too? Thanks. -
chris at 03:39 AM on 27 September 2011CERN - Saying Nothing About Cosmic Ray Effects on Climate
tblakeslee (@ 95) I find your comment that you have "...spent years writing columns about global warming and green energy for Renewable Energy World.." rather incompatible with the links that give us some insight from where you source your information (dubious websites sadly). Surely someone that has been writing on these subjects for years would have learned enough about these subjects to address the scientific literature in it's entirety and access the expertise of scientists that work in these areas... -
David Lewis at 03:35 AM on 27 September 2011Galactic cosmic rays: Backing the wrong horse
Richard Alley discussed this line of research during his 2009 AGU Bjerknes Lecture, which was entitled "The Biggest Control Knob". A video of his entire lecture is available here. He discusses cosmic rays starting at the 42 minutes 5 seconds mark. He pointed out that the paleoclimate data show that a significant variation in the amount of cosmic rays did not cause climate change. "There's really good science to be done on this. But we have reason to believe its a fine tuning knob...." "Its a really interesting hypothesis....":
"People say the Sun doesn't change much but the Sun modulates the cosmic rays, the cosmic rays modulate the clouds, the clouds modulate the temperature, so the Sun is amplified hugely...."
"Now the Sun modulates cosmic rays..."
"...but so does the magnetic field".
"And 40,000 years ago the magnetic field basically zeroed out in what we call the LasChamp anomaly for a millenium or so. And when it did, cosmic rays came screaming into the Earth system and you see, in basically all sedimentary records, this peak of cosmic ray produced nuclides.
[ He displayed this chart ]
"We had a BIG cosmic ray signal, and the climate ignores it. And its just about that simple. These cosmic rays didn't do enough that you can see it."
-
John Russell at 03:32 AM on 27 September 2011Pielke Sr. Agrees with SkS on Reducing Carbon Emissions
Can I suggest that SkS seeks out other published scientists whose work the sceptic community holds dear to their hearts as supporting a contrarian viewpoint, and looks for areas of agreement -- just as has been done here with Dr Pielke? Being able to demonstrate, unequivocally, using the published words of those scientists, that they do support action to reduce GHGs, is a very powerful tool. Though I'm sure it will be difficult for some to admit, to some degree, agreeing the minutiae of the science is less important than action to stop the negative climate effects that we -- those on this side of the divide -- all fear. Let's face it; none of us are doing this because we like a good argument.
Prev 1469 1470 1471 1472 1473 1474 1475 1476 1477 1478 1479 1480 1481 1482 1483 1484 Next


