


 Arguments


Recent Comments
Prev 1515 1516 1517 1518 1519 1520 1521 1522 1523 1524 1525 1526 1527 1528 1529 1530 Next
Comments 76101 to 76150:
-
Rob Painting at 10:32 AM on 20 September 2011Oceans are cooling
Tristan - the false cooling shown in Lyman (2006) were caused by faulty pressure sensors in a collection of the ARGO floats - in other words the floats were actually deeper than they "thought" they were. In some of the floats this grew steadily worse over time. There has since been a second pressure sensor fault (a leaking seal) that has caused problems too. This was identified last year - it's still being worked through. Generally speaking most of the floats are still operational (AFAIK) - they work out exactly how the faulty floats differ from the norm and allow for this in their analysis. The data is then made available for oceanographers such as Josh Willis and John Lyman. The oceans are still warming though. See my post: Ocean Cooling Corrected, Again. It happens to be that the top 700 metres of ocean aren't necessarily an accurate gauge for measuring global warming, for that you have to measure much deeper because the ocean circulations are able to efficiently push heat down to the deep ocean. -
scaddenp at 10:29 AM on 20 September 2011Positive feedback means runaway warming
Good point muoncounter - dating Antarctic core is not such a straightforward process and all of the date models have some assumptions built into them that making testing some hypotheses (eg delays between NH and SH responses) difficult. -
grypo at 10:20 AM on 20 September 2011Chasing Pielke's Goodyear Blimp
Just to give people an idea of the asymmetry involved in this debate, as far as "tone" goes, let's inspect Climate Audit's latest thread. 1. Asserts Trenberth is a plagiarist 2. Asserts Trenberth was given special treatment 3. Says the "Team" (there's a name) are obstructionists on data and opposed to his ideas about openness A few threads earlier: 1. "climate capo Kevin Trenberth" 2. Refers to the analysis of Dessler as "Mannian" 3. Another assertion about the process that Dessler 2011 was published 4. Ends, "Perhaps the editor of Science will send a written apology to Kevin Trenberth." Do Watts and Pielke object to this treatment? And name-calling? Not that I've seen. The constant attacks on scientists from those now attempting to demean SkS for a few silly names on buttons can't be called anything less than preposterous from what I can see. If tone trolling is the best people can do to take down SkS than that should be more of a compliment. It's like in the middle of war zone and one side has stopped to criticize their enemy for grunting too loud. It was a nice try. But if the word 'Crocks' bothers the important crowd (ie not the blogging ideologues) we are trying to reach, I think changing it is correct. -
scaddenp at 10:17 AM on 20 September 2011Positive feedback means runaway warming
jpat - but there are no simple equations in the model. Just mighty complex ones. As I said earlier, if you want the equations then stick you head inside one the Earth System Models. The question for feedback is that for a given delta-T, what are the changes in the feedback? For many the feedbacks, then this also depends on what current T is. Only water vapour is straightforward in this. Albedo depends on cloud response plus elevation versus freezing level.Methane is particularly complex, with multiple sources, some having temperature-triggered stores; and CO2 depends on your full carbon-cycle model. -
muoncounter at 10:10 AM on 20 September 2011Positive feedback means runaway warming
jpat#84: "I just want to see the math for myself. " Speaking of math, did you verify that the time resolution of the Vostok core was sufficient to identify such a short period lag as your 'extracted astronomical signals' graph illustrates? -
Ken E at 10:06 AM on 20 September 2011Chasing Pielke's Goodyear Blimp
Sorry alb, not meaning to sound "inflammatory" so to speak, just relating a relatively simple behavioral example. That example is in fact directly lifted from my own experiences working with children in mental health, and depressingly enough I think an unfortunately large percentage of grown adults never outgrow that level of operation. The point is, it's not the appropriate time to defer leeway to someone's demands when they are being unreasonable in the first place. Doing so more often than not ends up encouraging more of the same inappropriate behavior. I would think after sufficient time-based consideration such changes could be deemed appropriate, but if so it should be for proper reasons. -
nealjking at 09:28 AM on 20 September 2011Chasing Pielke's Goodyear Blimp
Eric, #83: The "crack cocaine" remark is quite degrading as well. -
Eric (skeptic) at 09:24 AM on 20 September 2011Chasing Pielke's Goodyear Blimp
Rob, I agree partly. I looked at the full context of the Jihadist remark and it is inappropriate. It was not used as an analogy but a description. I just commented on the "crack cocaine" remark in the hockey stick thread. -
Eric (skeptic) at 09:19 AM on 20 September 2011Hockey stick is broken
On the Briffa-Yamal series being "crack cocaine for paleoclimatologists" (the comment made by McIntyre), there were non-addictive alternatives available: e.g. http://18a.akadem.ru/Articles/02/naurzbaev_en_2.pdf and http://www.nosams.whoi.edu/PDFs/papers/Holocene_v12a.pdf versus Briffa: http://www.cru.uea.ac.uk/cru/people/briffa/qsr1999/ Briffa's response to the impact of his series: http://www.cru.uea.ac.uk/cru/people/briffa/yamal2009/cautious/cautious.htm McIntyre's response to Briffa's response: http://climateaudit.org/2009/10/28/response-to-briffa-on-yamal-impact/ -
jpat at 08:55 AM on 20 September 2011Positive feedback means runaway warming
Sphaerica @81 - Thanks for that explanation. It's a good point and clearly cause for concern. KR and muoncounter - Thanks for the papers. Schwartz talks about some of the same taxonomical issues I tried to with my divider + VCVS analogy. I think incorporating something like this into the header on this topic would be helpful. In reading through the comments I see others have fallen into the same trap I did. -
pbjamm at 08:46 AM on 20 September 2011Positive feedback means runaway warming
jpat@84 I think this has been pointed out several times, but there are more variables in the model. -
Rob Honeycutt at 08:40 AM on 20 September 2011Chasing Pielke's Goodyear Blimp
Eric... McIntyre and Watts are fostering an atmosphere of hatred toward climate scientists that is completely undeserved. I don't see SkS as taking that approach at all toward Spencer or Christy or even Lindzen. SkS points to the inaccuracies. No one at SkS would ever even consider calling any of these scientists a "jihadist." If they did John Cook would immediately banish them. -
jpat at 08:34 AM on 20 September 2011Positive feedback means runaway warming
scaddenp @83 I'm saying if one of my engineers brought me this plot and said that his system model indicated the red curve was the cause and the blue curve the effect I'd ask to see his equations :>) That's all I'm after here. No agenda, not trying to upset anyone or advocate a position. I just want to see the math for myself. -
nealjking at 08:24 AM on 20 September 2011Chasing Pielke's Goodyear Blimp
and given what we just learned about McKitrick in #69: surprisingly hateful. -
scaddenp at 08:18 AM on 20 September 2011Positive feedback means runaway warming
jpat - are you saying that because CO2 is still rising, then temperature shouldnt be falling? But what is the strength of the forcing associated with delta-CO2 cf to strength of other forcings operating at the same time? -
nealjking at 08:13 AM on 20 September 2011Chasing Pielke's Goodyear Blimp
Eric, 78: "Colorful"? I would say: hostile, degrading. -
Albatross at 08:12 AM on 20 September 2011Chasing Pielke's Goodyear Blimp
Eric, you are now arguing semantics-- if that is the substance of your defense for McIntyre it is incredibly weak, and if that is what you consider "colourful" then we can agree to disagree. He used those terms to attack climate scientists, whether or not they appeared in a title is irrelevant. Thanks for showing us your very obvious bias. -
jpat at 08:09 AM on 20 September 2011Positive feedback means runaway warming
Sphaerica (at #78) et al. The plot below is what am using as a basis for my questions.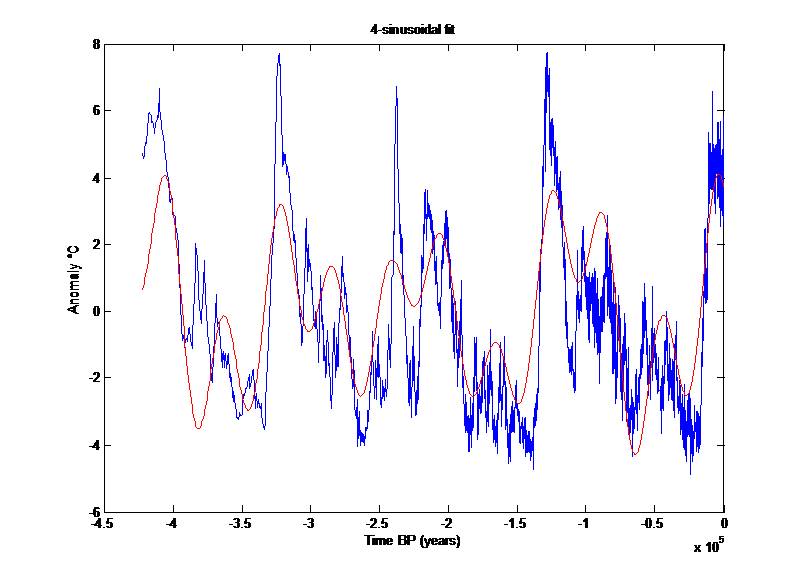 It is a sum-of-sines best fit to the adjusted vostok data where the period and amplitude of the forcing components was extracted by fourier analysis (and match near perfectly to the known Milkanovitch periods.) Since we can not know how the phase of each component is affected by the climate we adjust the phase of each component for best fit (r^2=.6).
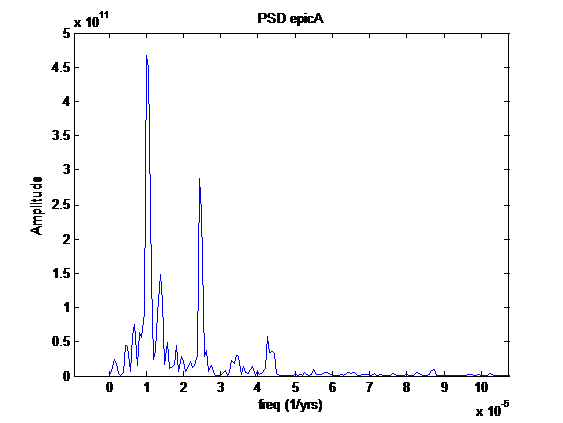
Here's the Fourier analysis which was done with a technique called linear decomposition which avoids the spectral smearing one gets with windowing. The narrow line widths are strong indications that the forcings are astronomical as no natural terrestrial process could maintain this level of spectral purity over 500kYr.
It is a sum-of-sines best fit to the adjusted vostok data where the period and amplitude of the forcing components was extracted by fourier analysis (and match near perfectly to the known Milkanovitch periods.) Since we can not know how the phase of each component is affected by the climate we adjust the phase of each component for best fit (r^2=.6).
Here's the Fourier analysis which was done with a technique called linear decomposition which avoids the spectral smearing one gets with windowing. The narrow line widths are strong indications that the forcings are astronomical as no natural terrestrial process could maintain this level of spectral purity over 500kYr.
 Finally here's the same temperature extraction plotted with the CO2 extraction and scaled to equal amplitude for easy comparison.
 In the first plot, note that the rapid decrease in temperature generally occurs near a dT/dt minima. In the last plot note that the CO2 is still rising at the temperature turn-around point.
Moderator Response: [mc] Please restrict image width to 475
In the first plot, note that the rapid decrease in temperature generally occurs near a dT/dt minima. In the last plot note that the CO2 is still rising at the temperature turn-around point.
Moderator Response: [mc] Please restrict image width to 475 -
Eric (skeptic) at 08:07 AM on 20 September 2011Chasing Pielke's Goodyear Blimp
Albatross, titles please? You are correct that McIntyre uses colorful analogies, but I asked for titles. -
Albatross at 07:58 AM on 20 September 2011Chasing Pielke's Goodyear Blimp
Eric@71, Really? Regarding defending McIntyre, I do not think you wish to go down that road. But you did, so..... Do you not remember Mr. McIntyre saying this? "However, as CA readers know, the resulting Yamal chronology with its enormous HS blade was like crack cocaine for paleoclimatologists" Nice...not. And funny how McIntyre cherry-picked those pseudo-proxy series that showed hockey sticks, and which was dutifully and uncritically reproduced by Wegman in his plagiarised "Wegman report". But I think that I can better that. McIntyre, "James Hansen and his disciples have a more jihadist approach" I think just those two examples beat "Christy's Crocks" by a very long shot. -
CBDunkerson at 07:56 AM on 20 September 2011Chasing Pielke's Goodyear Blimp
Dave123, I didn't know about McKitrick, but yeah Spencer is a typical example Cornwall thinking... that is science, politics, and economics are all synonymous with religion. For example; "We believe Earth and its ecosystems—created by God’s intelligent design and infinite power and sustained by His faithful providence —are robust, resilient, self-regulating, and self-correcting, admirably suited for human flourishing, and displaying His glory. Earth’s climate system is no exception." Except, of course, we know for a fact that isn't true. There were these things called glaciations. Not exactly "admirably suited for human flourishing". Indeed, the last one nearly wiped us out. And before anyone accuses me of 'religion bashing' or somesuch... there are plenty of religious people whose beliefs conform to observed reality. Spencer isn't one of them.Moderator Response: [Albatross] OK, that is enough talk about Spencer's affiliations with the Cornwall Alliance. That subject is now off-topic. Future references to Spencer's religious views or his affiliation with Cornwall Alliance will be deleted. -
wingding at 07:53 AM on 20 September 2011Chasing Pielke's Goodyear Blimp
Crocks is the only one that seems a little aggressive. Perhaps change it to Christy Confusion. The cartoony font used and the alliteration in other buttons puts it in context anyway. -
Stephen Baines at 07:52 AM on 20 September 2011Chasing Pielke's Goodyear Blimp
Well, Dave123, that's definitely interesting. The language in that text definitely suggests a logical link between creationism and the anti AGW crowd. The worlds ecocystems cannot be "unstable and fragile products of chance" and so are immune from "miniscule variations in atmospheric chemistry." Not the kind of presupposition any scientist should sign onto. Is that site legit? -
nealjking at 07:50 AM on 20 September 2011Chasing Pielke's Goodyear Blimp
How about "Christy's Incredulities"? -
John Hartz at 07:47 AM on 20 September 2011Chasing Pielke's Goodyear Blimp
How about... "Christy's Mysteries" In additon to rhyming words, you get a literary allusion. -
Eric (skeptic) at 07:42 AM on 20 September 2011Chasing Pielke's Goodyear Blimp
#68 Rob, IMO McIntyre's titles do not compare to Christy's Crocks. If you believe otherwise, please point to an example. The various thread titles should not distract from the message, so I would propose something like Christy's Crocs which are comfortable and colorful, but relatively cheaply constructed and which should not be worn on a serious hike. -
Dave123 at 07:33 AM on 20 September 2011Chasing Pielke's Goodyear Blimp
ooops...messed up the hypertext -
Dave123 at 07:33 AM on 20 September 2011Chasing Pielke's Goodyear Blimp
Shub, This may be ad homenimem, and the moderators may pull it. But I put the following proposition to you: If someone publicly states that as credo, as faith that some things are beyond science, then can we start to suspect that they aren't in fact scientists at all, but some sort of wolf in sheep's clothing? That they are not operating in good faith except towards their credo and their co-believers? Until a few minutes ago I had no idea that the Cornwall Alliance existed. Now I see that Spenser and McKitrick are members and signers of its credo. Cornwall Alliance Declaration on Global Warming You don't like the IPPC. How are you on other organizations with actual announced agendas? If you don't like Greenpeace having a say in what happens at IPPC, what about testimony under oath from Cornwall Alliance people? And y'know, I find your distinction between congressional testimony and publishing in the scientific literature most peculiar. I don't buy it in the least. -
Bob Lacatena at 07:25 AM on 20 September 2011Positive feedback means runaway warming
77, jpat,if we haven't reached the point of diminishing returns at present, then neither had we back then.
Refer to my previous post. Note that the point at which the natural system stabilizes is always around 270-275 ppm. That was the point of diminishing returns as far as the natural climate goes. It wasn't going to add any more CO2 on it's own. Enter man. Add 115 ppm in just a hundred years (where the natural climb from 180 to 270 took thousands). This is a 0.5 fold increase. If we go all the way up to 540 ppm, double where we started, that is again another whole unit of temperature of increase. Consider that the change from 180 to 270 is only a 0.5 fold increase in CO2. That's what pulls us out of a glacial period, over the course of thousands of years, and we have already today duplicated that forcing in a mere 100 years. You are right in that the natural climate system had reached the point of diminishing returns. It was never going to push CO2 levels and temperatures above where they were at. But that doesn't mean that CO2 will now somehow magically fail to have the same, predictable effect. -
Rob Honeycutt at 07:23 AM on 20 September 2011Chasing Pielke's Goodyear Blimp
funglestrumpet @ 64... I think Monckton got off light in terms of how the alliteration of his name worked out. He's been much more deserving of the "crocks" title. The whole point to the alliteration of titles is to make them a better tool. It makes them more memorable, more likely that people will click through. Anyone who does work on websites will tell you that is how you get more people to click through to the data you'd like them to see. I have to say, these simple alliterations of people's names pale, by far, to what is constantly put out by Watts, McIntyre, Spencer, Monckton, etc. on their blogs. By comparison SkS is being really really polite to these people. -
Positive feedback means runaway warming
Interesting, here's another electronic mapping: Schwartz 2010. Unfortunately, he's using a single compartment energy model, which is notably insufficient to capture climate behavior. -
jpat at 07:18 AM on 20 September 2011Positive feedback means runaway warming
"You do realize I (and others) already provided the mathematical proof, right?" You do realize that a mathematical proof excludes all other possibilities, right? Do you really think you've accomplished that? -
Bob Lacatena at 07:18 AM on 20 September 2011Positive feedback means runaway warming
jpat, Your comment contains a number of errors:the difficulty is explaining the _other_ transition, when your at peak insolation.
Actually, "peak insolation" happens relatively quickly. That's the kick start. Insolation does not slowly increase to keep temperatures and CO2 rising. It increases relatively abruptly, and in so doing starts the rise in CO2 that drags temperatures further upward.At that point dT/dt is at a minimum.
No. dT/dt approaches a minimum as the effect of CO2 tapers off.CO2 is still rising rapidly due to the 800 year lag but no where near saturation.
This is wrong. First, the term "saturation" is ill-defined. I don't think you mean "so much we can't add anymore." What we care about is the temperature-effect of CO2, which is strongest when CO2 levels are low, and decreases as CO2 levels rise. After a while, adding more CO2 just doesn't affect temperatures all that much, so it doesn't add much more in the way of CO2. The feedback dies and a new, stable temperature is achieved. This is because the temperature impact of CO2 is logarithmic, i.e. 1 unit of temperature change per doubling of CO2. So... 1x CO2 --> no change 2x CO2 --> 1 unit increase 4x CO2 --> 2 units increase 8x CO2 --> 3 units increase and so on.The CO2 is thus contributing an ever increasing radiant forcing.
No, as explained above. It contributes an ever decreasing forcing (otherwise you'd have a runaway effect).How does the small insolation dT/dt overcome the CO2 forcing to turn the temperature back around
At the end of the interglacial, when orbital forcings change, there is a decrease in summer time insolation (both in strength and the length of the summer). This allows ice sheets to advance (or, more appropriately, keeps them from melting back to their starting point each summer). The advancing ice reflects rather than absorbs more and more incoming radiation. Temperatures drop correspondingly. When temperatures drop, CO2 drops. When CO2 drops, temperatures drop. The entire cycle happens in reverse until much of the northern hemisphere is covered in ice. -
jpat at 07:12 AM on 20 September 2011Positive feedback means runaway warming
The saturation I was referring to was the log dependency of forcing with CO2 concentrations. At the temperature extremes of the paleo record, the CO2 has been around 270 ppm which is substantially lower than today. My point being that if we haven't reached the point of diminishing returns at present, then neither had we back then. -
muoncounter at 07:04 AM on 20 September 2011Positive feedback means runaway warming
KR#75: "nobody has mapped the climate to your field of electronic circuitry" Well, dontcha know, somebody has. It's dated (2001) and doesn't seem to have much about co2, so I don't know (and don't much care) if it's any good, but jpat might study the lecture series and report back. -
nealjking at 06:42 AM on 20 September 2011Chasing Pielke's Goodyear Blimp
To be honest, the real issue is not what Pielke thinks, it is what people reading and commenting at this page think. In other words, all of you. -
Positive feedback means runaway warming
jpat - Your comments have repeated invoked unlimited runaway feedback, which as discussed in the header of this thread is both non-physical and simply not the case for the climate. Feedback amplification is limited, CO2 will not self-amplify past that, and a forcing change in either direction will be followed by feedback changes in the corresponding direction. CO2 solubility levels in the oceans are temperature dependent. Equations for the various sequestration pathways can be found in incredible detail in the Ocean acidification threads, but a 500-800 year lag time for a solubility response is supported by chemistry, ocean currents, and multiple observations. My interpretation of 'saturation' in your previous post was that CO2 would continue to rise past the initial amplification due to it's own effects - which again contradicts finite amplification of a forcing. There is no inconsistency between CB's and my comments in that regard. --- At this point it's unclear what your discussion is leading to. Climate is not a phase-locked oscillator, not an op-amp circuit. Your tone in this regard is rather remarkable - you seem to feel that because nobody has mapped the climate to your field of electronic circuitry that it's 'hand waving'. Climate the response of the global energy distribution and hence chemical and hydrological responses due to multiple forcings, multiple deltas, with a fair number of positive and negative feedbacks adding up to a net positive amplification of ~3x, over which is laid non-linear interactions leading to chaotic variations (ENSO, weather). Exact numbers for portions of this system have varying uncertainties, such as aerosol total effects, but the climate is surprisingly well understood as a boundary value driven physical system with chaotic variations. -
scaddenp at 06:37 AM on 20 September 2011Positive feedback means runaway warming
"how hot will it get?" jpat - the primary interest at the moment is how hot might it get in the next 100 years. The ice-age cycle is extremely interesting but carbon-cycle feedbacks are insignificant in that time period. We are providing all the CO2 at the moment, not nature. When the oceans start outgassing, it will get first. Also, low sensitivity is not supported by other evidence whereas 100ky problem has other solutions. Its very important to recognise that climate theory is based on physics not paleoclimate. Paleoclimate studies can provide some constraints but primarily are useful as testing ground. Does our theory work in former times? The puzzles are paleoclimate arent challenges to theory - they are challenges of finding ways to constrain multiple theories which account for different forcings. So to the question as to how hot could it get? Well paleoclimate does constrain that - as hot as the pliocene potentially. -
Ken E at 06:36 AM on 20 September 2011Chasing Pielke's Goodyear Blimp
I like Skywatcher's assessment in post 2. The names are already very generously polite. You could have similarly called them "Spencer's Stupidity" and "Cristy's Corruption" and been more accurate to boot. I'd just leave the titles alone for the time being. As another poster said, why even respond to Pielke's complaints? He made highly inappropriate accusations on his blog then blatantly ignored questions posed to him time and again on the matter on the previous post. -snip-Moderator Response: [Albatross] Inflammatory language removed. Again, I understand your frustration, but please be polite. -
NewYorkJ at 06:30 AM on 20 September 2011SkS Weekly Digest #16
In Dana's previous post, I asked what Dr. Pielke thought of: Surface Temperature Records - Policy-Driven Deception? by Josepth D'Aleo and Anthony Watts Like with nearly every other challenge posed to him on that thread, Dr. Pielke did not respond. -
CBDunkerson at 06:29 AM on 20 September 2011Positive feedback means runaway warming
jpat, you need to stop assuming you already know the answers and start actually thinking about the things people are telling you rather than just dismissing them without understanding. There is a common (though false) claim that the warming effect due to CO2 is currently saturated and that increasing atmospheric CO2 levels will thus cause no further warming. I'd assume that is what KR was referring to when he said that CO2 feedbacks would not rise to 'saturation'. It is completely different from what I (and KR) said about temperature increases from CO2 being finite. So no... there is no inconsistency. You just do not understand. Read it again. Really think about it. Ask specific questions. As to people being 'condescending'... have you READ your own posts Mr. 'wand waving'? -
nealjking at 06:23 AM on 20 September 2011Chasing Pielke's Goodyear Blimp
Shub, I think a distinction can and should be made between scientists who come to different conclusions than oneself has, and scientists who have used their skills to distort the conclusions. This is particularly problematic when the conclusions are used to affect consideration of a matter that involves public policy, as climate certainly does. The basic issue boils down to a question of good faith. -
jpat at 06:23 AM on 20 September 2011Positive feedback means runaway warming
KR @66 "CO2 as a feedback won't rise to 'saturation', and I would consider that a strawman argument - nobody has said it would." CBDunkerson@70 "[condescending remarks deleted] The temperature forcing from CO2 feedback is finite. There is no need to "overcome" an "ever increasing" temperature rise from CO2. The warming from CO2 stops... all on its own. After the orbital forcing which caused it does." See what I mean about inconsistency? -
jpat at 06:17 AM on 20 September 2011Positive feedback means runaway warming
KR #66. wand wavers should have read hand wavers but I don't think the distinction would change your accusation of bias, which is misdirected. I've asked to be pointed to a more formal description of the dynamics. In response I get various narratives (which if you'll read through this thread and the Wiki I was pointed to aren't even self-consistent), variations of "why is this so difficult for you to understand" and accusations of bias for simply pointing out that there are other possible explanations. If that's what passes for inquiry hereabouts I guess I'll move on. -
CBDunkerson at 06:14 AM on 20 September 2011Positive feedback means runaway warming
jpat wrote: "The CO2 is thus contributing an ever increasing radiant forcing." If you don't understand why the above is completely false, after having it explained to you several times, there really doesn't seem much point in continuing. The temperature forcing from CO2 feedback is finite. There is no need to "overcome" an "ever increasing" temperature rise from CO2. The warming from CO2 stops... all on its own. After the orbital forcing which caused it does. "Short of a mathematical proof, one must show how the data doesn't support the null hypothesis." You do realize I (and others) already provided the mathematical proof, right? -
funglestrumpet at 06:10 AM on 20 September 2011Chasing Pielke's Goodyear Blimp
Chinaman at 17 puts it very well. I have often thought that calling things 'Monckton's Myths' and such like does not fit with the serious manner that the SkS site generally approaches the issue of climate change. I would list the erroneous statements/notions in order of the area of science involved, together with the accompanying discussion/rebuttal and close with the name of the perpetrator of the erroneous statement/notion. Seeing as there is quite a lot of this material, it would be a nice feature for a visitor to the SkS site to be able to sort the material either as just described, or in the order of perpetrators. Perhaps the whole section could be entitled 'Known Falsehoods'. -
jpat at 06:07 AM on 20 September 2011Positive feedback means runaway warming
KR #67. That comment is unfair. The just so story I was referring to was in reference to the narrative provided by Sphaerica, not to AWG theory in general. I've perused the link you've provided (multiple times). I don't see a treatment of the subject at hand there. -
Shub at 06:06 AM on 20 September 2011Chasing Pielke's Goodyear Blimp
I have no emotional attachment to the titles themselves and am happy to change them if they bother people. Suggested alternatives are welcome.
I don't what the outcome of these deliberations are going to be, but the statement above, indicates an open mind and this has to be appreciated. Take the recent example of the Christy-Santer contrasting topical post. It is not clear at all, from the post that Christy committed such a great faux pas that it deserves to be called a 'crock'. But it has been filed in that category. Christy, and Spencer are scientists - and even scientists have opinions - which is the a coalescing of a broad array of evidence, data, lifelong experiences, biases etc. Sometimes these may not congeal in a way that resonates with a supposed consensus that is put out officially (IPCC). I think scientists must be judged by the quality of their scientific work (which is itself not an easy thing). A Congresssional testimony is not the place of primary scientific exposition. People use it to put across their personal point of view. Every Congressional testimony has been, and will be like this. Hansen's influential Congressional testimony served as a platform for climate scientists of a certain view to push a certain paradigm. It may be easily questioned as to whether the summary of evidence existed at the time, for the certainty that was put forth in his testimony. For some skeptics, that may be a crock. But neverthless, Hansen did what he did and I don't believe in demonizing him. Thanks -
dhogaza at 06:04 AM on 20 September 2011Chasing Pielke's Goodyear Blimp
"I can't help thinking that "skeptics" are thin-skinned when it comes to complaining about perceived insults yet are are heavy-handed when it comes to dishing it out." People, people, people ... it's a tactic. Creationists have used it for decades now. -
Ken E at 06:03 AM on 20 September 2011Heat from the Earth’s interior does not control climate
It's just comical (albeit predictable) to see skeptics even tried this one. I think the next one has to be: "Heat Release From Bioluminescent Sea Animals The Real Cause For Ocean Heating."
Prev 1515 1516 1517 1518 1519 1520 1521 1522 1523 1524 1525 1526 1527 1528 1529 1530 Next


