


 Arguments


Recent Comments
Prev 1539 1540 1541 1542 1543 1544 1545 1546 1547 1548 1549 1550 1551 1552 1553 1554 Next
Comments 77301 to 77350:
-
Bob Lacatena at 06:55 AM on 15 August 2011One Confusedi Bastardi
As bad as Bastardi is, Fox News should be crucified. To have a "news" outlet that knowingly gives a platform for this cr@p is where the real problem lies. And yes, I know, Faux News has lots and lots of issues, and they rather pathetically cross the line for all of them. But to put on a discredited nonsensical weatherman, present him as an expert on global warming, then let him prattle on with what is utter and complete nonsense is just too much. Fox News needs to be crucified. -
Robert Murphy at 06:09 AM on 15 August 2011One Confusedi Bastardi
He also made up a phony "trend" for the Hadcrut data from 1996 to May 2011 on his WUWT post. He has the correct graph, but he drew a curved line that ends with an arrow pointing down, even though the actual trend for the 15 year period is a rise of .008C/yr, which comes to about .12C in warming over the period. His line is a fabrication. -
Camburn at 01:19 AM on 15 August 2011Global warming stopped in
1998,1995,2002,2007,2010, ????
I sea a game of ice hockey in the near future.... Sharpen your blades and repair the goal.Moderator Response: (DB) I hear spring training has lifeguards. Long term, will be an indoors-only pasttime. -
DSL at 01:12 AM on 15 August 2011Global warming stopped in
1998,1995,2002,2007,2010, ????
Sniff sniff . . . I smell a penguin BBQ. -
Tom Curtis at 01:02 AM on 15 August 2011Trenberth on Tracking Earth’s energy: A key to climate variability and change
Adelady @169, DougCotton appears to believe the that all the heat in the surface layers of the ocean can be dissipated in a matter of seconds, or minutes, so that the only think that preserves the warmth through the night is the feedback loop of back radiation re warming the surface after some heat is initially dissipated. In other words, he has no concept of thermal inertia. It is easily determined that it would take approximately 28 days without sunshine for the surface 100 meters to lose 1 degree C with a net upward flux of 160 Watts/m^2. The 160 W/m^2 is just the average net upward flux from the surface excluding solar radiation, while the 100 meters is an underestimate of the typical depth of the mixed layer, in which turbulence caused by winds keeps temperatures near constant with depth. That being the case, the temperature drop at night in the ocean is negligible, except at the very surface where the heat escapes to the atmosphere quicker than it can be replenished from below. As always, Science of Doom has an excellent post (in fact four) on the subject, and even developed a model of the diurnal temperature range in the ocean: And for some empirical results:
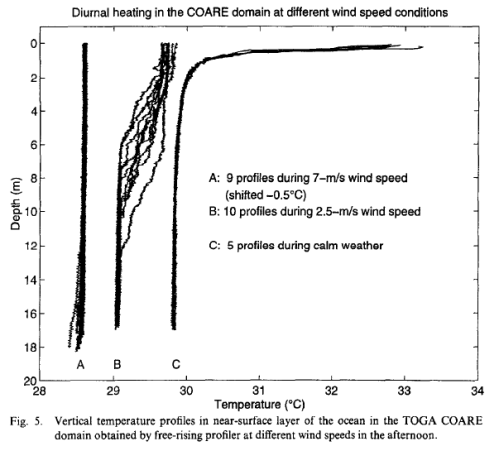 As you can see, even under calm conditions the top most layer only varies in temperature by about 3 degrees at most, for a 40 W/m^2 variation in the surface IR radiation at most. In other words, the up welling IR radiation from the surface is near constant over water, and the dissipating feedback loop imagined by DougCotton is simply unphysical.
Over land, there is substantially greater variation in temperature, but temperatures are normally kept within a narrow range for all that. Because of this, the up welling IR radiation, which is in fact black body radiation from the surface also persists through the night with only minor variation. This can be seen in actual measurements of the surface radiation, in this case over a banana plantation in Brazil:
As you can see, even under calm conditions the top most layer only varies in temperature by about 3 degrees at most, for a 40 W/m^2 variation in the surface IR radiation at most. In other words, the up welling IR radiation from the surface is near constant over water, and the dissipating feedback loop imagined by DougCotton is simply unphysical.
Over land, there is substantially greater variation in temperature, but temperatures are normally kept within a narrow range for all that. Because of this, the up welling IR radiation, which is in fact black body radiation from the surface also persists through the night with only minor variation. This can be seen in actual measurements of the surface radiation, in this case over a banana plantation in Brazil:
 The thing to note is the Net Radiation (Rn), ie, down welling solar radiation minus the up welling IR radiation. At night that becomes just - the up welling IR radiation, and as can be easily seen, it is near constant through the night.
Once again how Doug imagines things to be has no support either in theory or observation.
The thing to note is the Net Radiation (Rn), ie, down welling solar radiation minus the up welling IR radiation. At night that becomes just - the up welling IR radiation, and as can be easily seen, it is near constant through the night.
Once again how Doug imagines things to be has no support either in theory or observation.
-
Daniel Bailey at 00:58 AM on 15 August 2011Global warming stopped in
1998,1995,2002,2007,2010, ????
You know that stuff that ain't happenin'? Still ain't:
 [Source]
Shows over, folks. No warming here, nothing to see.
Response:
[Source]
Shows over, folks. No warming here, nothing to see.
Response:[DB] Fixed images.
-
muoncounter at 23:42 PM on 14 August 2011Trenberth on Tracking Earth’s energy: A key to climate variability and change
DougC: How about a new version of this? It's been such fun playing question time; it is now time for you to provide some answers that are substantiated and based on researched self-consistent science rather than your opinion. Following are questions based on several points in #165. Think of this as your homework assignment; don't come to school without doing it first -- and don't ask someone else to do it for you. 165 #1: In your model, conduction/diffusion 'prevails'. Yet you state there have been cooling periods; cooling requires a heat deficit. What causes this? Your answer must be detailed and not just 'natural cycles;' that's a cop-out of the uninformed. Hint: much is fully explained on other threads. Find them. Read. Learn. 165#2: Why does the surface warm during the day? What happened to the ability of your conduction/diffusion mechanism to 'prevail'? 165#3: Incorrect. Go find out why measuring radiation is not the same as measuring temperature. What have we learned (hint: a great deal) from such radiation curves? Hint: read TomC's excellent comments in this thread - again. 165#4: Incorrect. Go find out why it is the trend in temperature and heat gain that matters. What is that trend over the last 40 years? You state that O2 absorbs UV: Find out how much of the incoming solar energy is UV. Then see if UV even has a place in this discussion. What are 'feedback photons'? Please describe the conversion of heat to 'full spectrum IR.' Why does this 'conversion' only occur at the surface? Is there a difference between IR photons leaving the initially warmed surface vs. those leaving the surface after feedback? Please provide some substantiation that 'all can get out' by '4am'. Include in your answer a discussion of the significance of an increase in nighttime temperatures over a multi-year period. You conflate seasonal temperature variation with the multi-year warming trend. Why does the fact that it cools in the winter not have any significance in this discussion? If, as you've claimed, 'conduction will prevail,' why do we have seasons at all? Until you can answer some questions, in self-consistent detail, your understanding still has gaping holes (and you now know that it does). SkS is not a soapbox; this is a place to test your ideas and accept that others know this science better than you. Sphaerica gives excellent advice. I can add only this: Think about what you read. And more importantly, think about what you are going to say before you write it. Always ask yourself, 'is what I have to say really that new and important or might someone already have this figured out?' Try to avoid adding to the noise; add instead to the useful dialog. -
Bob Lacatena at 22:15 PM on 14 August 2011Trenberth on Tracking Earth’s energy: A key to climate variability and change
Doug, You have wandered through a trail of 100 posts now, hitting everything you can and being soundly refuted at every turn, and yet you keep finding new reasons to ignore what you are told or educating yourself beyond your ignorance. You continue in pursuit of more and more reasons to declare scientists wrong and ignore the problem. If this topic concerns you so much, you need to put more time into studying, and less into posting. When you study, you need to open your mind and learn, instead of starting with a desired outcome and trying to interpret everything in terms of that outcome. You need to recognize that you have a problem, a very serious bias towards arriving at a predetermined conclusion, and that bias keeps you from adequately learning the science. You need to recognize that the science is very, very, very complex. There is a lot to learn, and in a lot of different areas. You need to trust other people, and ask questions to learn instead of trying to score points or find weaknesses for the sake of later scoring points [And after 100 posts your score right now is zero, by the way]. In a nutshell, you need to become a skeptic. A skeptic doesn't believe anything, and refuses to commit until he is sure that he solidly understands and has no doubts. You are not a skeptic. You believe a lot of things, like in the magic of ENSO, which is really nothing more than a global game of oceanic peekaboo. You may actually be on to something in thinking of it as the globe's pressure valve, but if so, it is one that is inadequate to counter the forces that are building beneath it. But this is good evidence of your own approach. When you find a concept you like, you accept it with extreme prejudice and without hesitation, even when you do not have enough facts to quantify the effect enough to justify your own position, and in fact when all evidence points away from your desired conclusion. You also refuse to believe in a lot of things, like the complex and irrefutable physics behind the greenhouse effect. You also, clearly, are not trying to learn everything you can, but rather only those things that you hope will support the result that you'd like to believe is true. Please become a skeptic. Please. Beyond that, this thread has grown extremely tiresome and has wandered way, way off topic. I'm amazed at the patience that all of the (well educated) SkS regulars have shown you here. A large number of people have gone to great lengths to help you, in a carefully reasoned tone that your own hubris and attitude does not mirror. It's time for you to do some serious studying, and to avoid nuthouses like WUWT in the process. Go learn the science. This site is a good place to start, but certainly shouldn't be your only resource. It's actually better as a place to figure out what else you need to learn (in my opinion). But look around, follow tangents, and educate yourself. Until then, you are just confused and passing your confusion to others. The world needs skeptics with the energy to educate themselves, not ignorant ideologues with the energy to broadcast their hoped for assumptions. -
MarkR at 20:27 PM on 14 August 2011Blaming nature for the CO2 rise doesn't add up
15 owl: and that's not all. Why is the ocean acidifying? Is ocean chemistry also wrong? What about CO2 fertilisation? It reminds me of something John published a while back: scientists are saying that if it walks like a duck and quacks like a duck, it's probably a duck. Bastardi is saying that not only is something that isn't a duck walking/quacking like a duck, but someone has hidden the real duck... Or perhaps maths or chemistry are wrong. -
adelady at 18:01 PM on 14 August 2011Trenberth on Tracking Earth’s energy: A key to climate variability and change
Doug "So my question is: Why can't the world just relax, knowing that El Niños will act like a pressure valve and release whatever excess heat any global warming may cause in the future?" You might have noticed that this wonderful El Nino process you're talking about seems quite capable of cooking the whole of Australia - esp when the Indian Ocean gets into the act as well. Sounds a lot like telling people not to worry about floods - after all the water eventually ends up in the ocean or the aquifers so 'Don't worry. Be happy.' And a minor technical quibble. How is it that this 'release' by the ENSO 'pressure valve' doesn't result in temperatures declining back to earlier levels in the following years? If this pressure valve had been doing it's job, surely temperatures would be fluctuating up and down around some level or other rather than steadily increasing decade by decade. -
adelady at 17:54 PM on 14 August 2011Trenberth on Tracking Earth’s energy: A key to climate variability and change
Doug, I'm having trouble understanding (several of) your responses to Tom's explanations. Especially those that rely on contrasts between day and night observations. These items are important for gathering information about particular locations. For global climate, however, the obvious issue is that when it's 4am in one place, it's 4pm at the equivalent location on the other side of the globe. Whatever is happening in the way of diurnal cooling/warming at one is reversing at the other - with appropriate adjustments for geographical variations. It's not clear to me that your ideas account for this adequately. -
DougCotton at 17:46 PM on 14 August 2011Trenberth on Tracking Earth’s energy: A key to climate variability and change
Another question to all: The chart in this topic "Energy Content in the Climate System" shows very clearly the dominance of the energy stored in the oceans compared with everything else. (It is nearly 20 times that in the continents, and nearly 30 times that in the atmosphere.) Even in over 40 years (1961-2003) the error bars still overlap so we cannot prove an increase statistically, though it does look likely and of course an increase would correlate with temperatures. Now, there is also reference to the 1998 El Niño being the biggest in recorded history. El Niños effectively send heat straight through the atmosphere and out to space. So there was some cooling after it especially in 2002. Now, these El Niños will continue happening and we could deduce that the magnitude of the heat which they send to space depends on the the magnitude of the prior build up in the oceans. So my question is: Why can't the world just relax, knowing that El Niños will act like a pressure valve and release whatever excess heat any global warming may cause in the future?Moderator Response: [Dikran Marsupial] Because as well as El Ninos, there are La Ninas, which do the oposite. ENSO is an oscillation, so on a multidecadal scale its effects average out to zero and it doesn't have a great effect on multi-decadal trends. -
DougCotton at 16:57 PM on 14 August 2011Trenberth on Tracking Earth’s energy: A key to climate variability and change
Tom and scaddenp: Note how this book indicates that radiation measurements are just one of several factors that must all be considered in order to arrive at meaningful results. Understanding Climate Change Feedbacks Panel on Climate Change Feedbacks, Climate Research Committee, National Research Council Moderator Response: [Dikran Marsupial] center tags fixed
 -
owl905 at 16:47 PM on 14 August 2011Blaming nature for the CO2 rise doesn't add up
The never-failing absurdity that the CO2 pollution rise is actually 'natural variation': 1. So where did all the human-generated pollution go? 2. Where did all the natural CO2 come from? 3. Instead of the 1/3-missing puzzle, there's now a 1 1/3-missing puzzle. 4. If .8dC from the 1800s drives CO2 levels up 40%, why didn't this variability ever show up in the paleo-climate proxy record? The Great CO2 Flood only shows up when the EIA is measuring massive and growing amounts of human GHG pollution. 5. 5dC from Ice Age to Interglacial had a 100ppm delta - so in the pointy-hat world, a 5dC drives a 50% rise then, but a .8dC rise drives the delta now. The problem with responding to lunatics is they have the magic spell 'budwaddabout' to avoid every defeat. -
Thomas1 at 16:38 PM on 14 August 2011OA not OK part 14: Going down
All very excellent Keith! Can't wait for the complete booklet to hand to a couple of very 'skeptical' (lets say denier) Geologists here. Why is it that there are more deniers per square Km of Geologists than any other science fraternity or am I imagining it? ;-) -
DougCotton at 16:07 PM on 14 August 2011Trenberth on Tracking Earth’s energy: A key to climate variability and change
#162: scadenp: I'm reluctant to place much emphasis on that 1978 paper which acknowledges several limitations and short-comings of the models of the time. They had problems regarding critical lapse rates which implied these were overstated by the models, which they said were in need of improvement. My understanding is that improvements were (are still?) needed in the treatment of marine boundary layer clouds and tropical convective clouds.Moderator Response: [Dikran Marsupial] The 1978 paper was suggested as a good place for you to start in gaining an understanding of the physics of climate and modelling. Of course there are limitations and there has been considerable progress in the last 30 years, however you need to start with the basics first. Your response is essentially a failure to engage with the discussion and your understanding of climate physics is unlikely to improve if you are unwilling to learn. Continue with this approach and you will find people will no longer respond to your questions as your responses suggest you are not interested in the answers. -
barry1487 at 15:50 PM on 14 August 2011Blaming nature for the CO2 rise doesn't add up
Or if their motivation is self-interest the problem is the same. Scientists want more funding for research, but they think that scientists jig their research to get more funding. Again, they superimpose their own worldview on any given subject. Reason, rather 'truth' is the first casualty in the climate wars. -
DougCotton at 14:55 PM on 14 August 2011Trenberth on Tracking Earth’s energy: A key to climate variability and change
Tom, thank you for your time in replying. I have read and understood your argument, and did in fact already know about what you have said. I will endeavour to explain what I believe to be the fallacy and why what you say "And that can only be achieved by the surface of the planet, the source of the rest of the radiation, warming" does not give reason for assuming that long-term warming is happening. My points are ... 1) Obviously there have been times of cooling for several years, eg after 1960. Yet at those times there was CO2 in the atmosphere and that would have given a similar plot, complete with notches. 2) We all have walked on hot sand or rocks, so we know the surface warms temporarily on hot days, and cools at night. So that is all your quoted sentence is actually confirming. 3) You might as well just measure the inward and outward bound radiation at the top of the atmosphere, from a satellite I guess. In general, in regard to warming or cooling, it won't tell you any more than what you already know from temperature data. 4) There can, however, be differences between (3) and what temperatures tell us due to build up or decline in potential (stored) energy, such as ice melting, water vapour forming by evaporation etc. So, unless we can quantify these factors over the time span measured, the information is useless. (A company cannot work out its sales from its purchases unless it knows opening and closing stock.) Just one other point, O2 absorbs at various altitudes - UV-A and UV-B higher up, but UV-C right down to the lower troposphere. In general, UV has much more energy than visible light, let alone IR as everyone here knows. (The O2 may become O3 in the process which is, of course, relatively unstable.) That energy will end up, after collisions, as photons both surface-bound and space-bound. (It has to, or the atmosphere would warm excessively in the long term.) Finally, feedback photons from CO2 to the surface, convert to heat and thence back to (nearly) full spectrum IR radiation, and so most will not be absorbed by CO2 on the second iteration, or perhaps the third etc. (Feedback is a multi-iteration process.) In the limit, all can get out regardless of the amount of CO2 - within reason - usually by, say, 4am the next morning. But if some heat in the oceans builds up in summer months, it then has winter to cool off - as we observe happens. -
barry1487 at 14:04 PM on 14 August 2011Blaming nature for the CO2 rise doesn't add up
Just goes to show the power of denial blinders. They seem to completely shut down critical thinking.
They confuse the political consequences of the study of climate change in the modern age with its scientific underpinnings. The political focus on anthropogenic global warming is a consequence of scientific inquiry, but they think the scientific focus on anthropogenic global warming is a result of political aspiration. And they think that because their own focus is politically motivated. It's no surprise they defer to ideas that get cause and effect backwards, because that is the root of their intellectual malady. -
Marcus at 13:42 PM on 14 August 2011Blaming nature for the CO2 rise doesn't add up
It comes down to this-if, as the deniers claim, warming is causing the rise in CO2, then *what* is causing the warming in the first place? We've had 6 consecutive decades of rising temperatures & atmospheric CO2 concentrations-but over that period we've had 3 decades of stable sunspot levels, followed by 3 decades of falling sunspot levels-not to mention above average volcanic activity over the 1990's. So again I ask- "where is the warmth coming from?" -
Albatross at 13:23 PM on 14 August 2011Blaming nature for the CO2 rise doesn't add up
Tom @10, Indeed. Re Fig. 17. Of course correlation is not causation, but one could argue that the increase in CO2 explains ~71% of the variance in the temperature anomaly. That is, most of the warming is attributable to human's burning fossil fuels. -
muoncounter at 13:18 PM on 14 August 2011Blaming nature for the CO2 rise doesn't add up
TomC#10: Nice! Just to be clear, the third graph's vertical axis is the change in CO2 over the 1900 concentration. I assume the horizontal axis, showing emissions as a volume fraction has been converted from the way it is usually reported - as mass in Gtons. Hard to argue that the linear fit in the 2nd graph makes any sense whatsoever. Although it does reinforce the point that both warming and cooling must be increasing CO2, just as the goblins want us to think. They are that good! -
Tom Curtis at 12:47 PM on 14 August 2011Blaming nature for the CO2 rise doesn't add up
Ferdinand Engelbeen has three diagrams of particular interest to this debate: The first amounts to a visual presentation of the argument above: The second plots CO2 concentration against temperature anomaly:
 The third plots CO2 concentration against cumulative human emissions:
 (Note, cumulative emission, not annual emissions as shown in the graph @7)
Salby and the denier cohorts are in effect asking us to ignore the 0.9966 correlation (R^2) in the third graph because they are impressed by the 0.719 correlation in the second.
(Note, cumulative emission, not annual emissions as shown in the graph @7)
Salby and the denier cohorts are in effect asking us to ignore the 0.9966 correlation (R^2) in the third graph because they are impressed by the 0.719 correlation in the second.
-
Tom Curtis at 12:04 PM on 14 August 2011Trenberth on Tracking Earth’s energy: A key to climate variability and change
DougCotton @160, the atmosphere absorbs around 78 W/m^2 from the Sun, mostly as a result of H20 and aerosols (which each account for nearly 50% of the energy absorbed). Most of the rest of the energy absorbed is absorbed by O2 in the thermosphere, and O3 in the mesosphere and stratosphere. If we supposed that all of the energy absorbed by the atmosphere was absorbed in the lower 2 km of the atmosphere, that would represent just 16% of the energy absorbed by the surface at that level. The immediate effect of that would be to slightly warm the lower atmosphere with respect to the surface, thus causing conduction to be a net sink of atmospheric heat rather than a source. It would also cause precipitation to be reduced in the lower atmosphere resulting in energy from evapo-transpiration to be released higher in the atmosphere than it currently does. It would also increase the backradiation. Most importantly, it would increase the rate at which convection carries heat away from the surface and lower regions of the atmosphere. The net effect would be negligible. Importantly, the CO2 in the upper troposphere would still be much cooler than the surface. Consequently, CO2 radiation from the upper troposphere which escapes to space would be much weaker than the radiation from the surface (and the CO2 in the lower troposphere) that would have escaped to space if the upper tropospheric CO2 had been absent. Consequently, the net effect of the CO2 would still be to warm the surface. -
Tom Curtis at 11:43 AM on 14 August 2011Trenberth on Tracking Earth’s energy: A key to climate variability and change
DougCotton @161: 1) The first spectrum shows a black body radiation for the surface of about 275 K. As black body radiation, it is a function of the temperature and emissivity of the emitting source, in this case the surface, which indicates the surface at the particular location and time the spectrum was observed was about 275 degrees K (or 2 degrees C). Spectrums at other times and places will show different temperatures. For example, the Sahara spectrum (third image, part a) shows a black body radiation of approximately 325 degrees K (52 degrees C); that for Antarctica shows 180 degrees K (-93 degrees C); and those for the Tropical Western Pacific and Southern Iraq show 295 degrees K (23 degrees C). If you divided the Earth's surface up into equal cells of about 2 to 4 times the size of the instrument resolution, and took a spectrum for each cell, then determined a mean spectrum for the whole Earth, then the mean black body curve shown would be for approx 288 degrees K, and the area under the curve would be approx the same as the area under the curve of a smooth (no notches or peaks) 255 degree K black body curve. 2) To quote the conclusion in full, so that it makes sense:" As, on average the energy radiated to space must equal the energy received from the sun, if the area under the curve is reduced by the absorption of IR radiation by green house gases, then the area under those parts of the curve in which IR radiation is not absorbed must increase in order that the same overall energy output is obtained. And that can only be achieved by the surface of the planet, the source of the rest of the radiation, warming."
Consider, as a simple analogy, a water filled ballon. As water is uncompressible for normal pressure ranges, the volume of the balloon is constant. Therefore, if you press down on one part of the balloon, it will bulge out at other parts, of necessity. If it did not, the indentation from your pressing down would have resulted in a loss of volume. Returning to the spectrums, the area under the curve is the power output at the location measured. As indicated above, averaged over the Earth's surface, the area under the curve is the same as the area under a 255 degree black body curve. It must be, or else the energy coming in from the Sun will not equal the energy going out by IR radiation, and the Earth will be either heating or cooling to compensate. Because the area under the curve averaged over the globe is effectively a constant, if some part of the curve lies below the 255 degree black body curve, then other parts must lie above it to maintain the constant area. This is an exact analogy of the situation with the balloon. As it happens, the areas lying below the 255 degree curve do so because they are emitted high in the atmosphere by CO2. That means the areas emitted from the surface must lie above the 255 degree curve to compensate, and the only way they can do that is if the surface is warmer than 255 degrees K, on average. I have treated the averaged case because it is easier. It would be equally possible to treat each cell (see (1)) seperately, and determine the area of a black body curve having the same area under the curve as does the spectrum from that location and time. Any part of the observed spectrum lying below that curve represents greenhouse forcing, and needs to be compensated for by parts of the spectrum lying above the curve, ie, being warmer because of greenhouse forcing. -
scaddenp at 10:19 AM on 14 August 2011Trenberth on Tracking Earth’s energy: A key to climate variability and change
Doug, you are asking some question that actually requires doing the maths - (and thus avoiding hand wavy answers). The place to start is Ramanathan and Coakley 1978. To see what that looks like when you do the calculations then look at Modtrans code pointed to earlier. You will note that this mathematical model is extremely successful at predicting power and spectrum of both OLR and DLR. An alternative formulation would need experimental confirmation at least as good. For more on why stratosphere cools but troposphere warms with increased CO2, try looking at here. Again, same underlying mathematics. -
Tom Curtis at 10:08 AM on 14 August 2011Climate Denial Video #3: Polluters Use Same Tactics As Tobacco Industry
While on the topic, I cannot be the only person here to have noted the linguistic similarity between "ratio" and "rational". In fact, as confirmed in the Shorter Oxford English Dictionary, they stem from the same root, and where originally the same word. In other words, to be rational literally meant to keep the ratio in mind (or more colloquially, to keep things in proportion). Thus, in the strict use of the language, somebody who insists that we ignore the denominator, and hence the ratio, as apirate is doing, is strictly speaking not rational. Make of that what you will. -
Tom Curtis at 10:01 AM on 14 August 2011Climate Denial Video #3: Polluters Use Same Tactics As Tobacco Industry
apirate @24, Dikran @25, and Muon @26 have more than adequately responded to you. I will point out that the actual survey included eight questions, and so would have taken more time to complete than signing the petition. -
Tom Curtis at 09:59 AM on 14 August 2011Climate Denial Video #3: Polluters Use Same Tactics As Tobacco Industry
A quick count of the PhD's amonsgst signatories of the OISM petition whose name starts with A shows that 246/900 signatories, or 27.33 per cent of signatories have that qualification. Assuming that people whose name starts with A do not have an unusual disposition to gain (or not gain) PhDs, the proportion is projectable. On that basis, approximately 8,500 people with PhD's have signed the petition. To put that in perspective we need a denominator. Between 1998 and 2008 (inclusive) 426,538 PhD's were awarded in Science or Engineering. In other words, signatories of the petition with PhD's represent less than 2% of Science and Technology PhD graduates while the petition has been active, and probably significantly less than 1% of PhD graduates in Science and Technology in the US overall. (See also Muoncounter @19) Statistically, it also means that only 10.66 of the climate scientists signing the petition held a PhD. Don't you just hate the denominator - it has this horrible habit of putting things in perspective. -
muoncounter at 09:16 AM on 14 August 2011Blaming nature for the CO2 rise doesn't add up
Albatross#8: "between 1950 and the mid seventies global temperatures declines somewhat, ... explain the increase in CO2" That's easy: since we know it can't be anthropogenic, both warming and cooling increase CO2. That's the power of goblin-based science: assume the answer, then manipulate the theory to produce it. QED -
muoncounter at 08:59 AM on 14 August 2011Why Wasn't The Hottest Decade Hotter?
DougC#86: "there is (as best I can ascertain) no statistically significant information either for or against correlation. " Look harder, there's plenty of information against. See the 'It's cosmic rays' thread. -
DougCotton at 08:39 AM on 14 August 2011Why Wasn't The Hottest Decade Hotter?
As I said, I tend to agree. I have not at any stage taken a position that solar winds cause climate change. I am just saying that it is one of many hypotheses that (other) people do seem to keep putting forward, and I was genuinely interested to see if there was anyone in this forum who held to such views. If there had been, then I too would have pointed out that, even where there have been attempts to reconstruct sunspot data for thousands of years back, there is (as best I can ascertain) no statistically significant information either for or against correlation.Moderator Response: [Dikran Marsupial] There is a word for that kind of behaviour, namely "trolling". If you were genuinely interested in opinions here on the solar cycle length - climate correlation you would have found the relevant article, read it and the responses, and added a comment at the end saying that you felt that there was no statistical evidence for or against. Do not do this again. If you want to discuss an issue, do so directly, on an appropriate thread and state your own position clearly and unambiguously in your initial post. -
Albatross at 08:35 AM on 14 August 2011Blaming nature for the CO2 rise doesn't add up
Nice post Muoncounter @7, Indeed. Also, note that between 1950 and the mid seventies global temperatures declines somewhat, so how then does Salby explain the increase in CO2 of about 15 ppmv during that time. He obviously now cannot claim that the increase then was in response to the warming pulse from 1920-1945 either? -
Albatross at 08:26 AM on 14 August 2011Murry Salby - Confused About The Carbon Cycle
I think we need to be very clear about an incredibly important point here. Anyone, and I mean anyone, peddling this hypothesis about the recent increase in CO2 being almost entirely attributable to the warming is a denier of the theory of AGW. What is telling is that for years some prominent "skeptics" have been lying to us-- for example, Anthony Watts proprietor of the pseudo-science site WUWT is now peddling Bastardi's nonsense which includes Salby's refuted hypothesis. What is odd is that very Watts takes strong exception to being labelled a "denier". It it is clear that his bluster (i.e., Anthony's) is just a facade to his denial and all these years he has been lying when he claims to be a "skeptic". That, or Watts has now finally jumped from being a "skeptic" to a full-blown denier of the theory of AGW. The underlying foundation of the theory of AGW, is as the name suggests that we are almost entirely responsible for increasing CO2 (and other GHGs), so to deny that or not accept that is to be a denier of AGW. So anyone who supports Watts or his site is now also by extension a denier of the theory of AGW. EOS. PS: Perhaps Salby can explain to us how we humans have managed to increase CFCs (measured in ppbv), N20, low-level O3 and other species that are not temperature dependent, while not managing to increase CO2? -
muoncounter at 08:19 AM on 14 August 2011Blaming nature for the CO2 rise doesn't add up
MarkR#6: "goblins are fixing the net CO2 flux" Now that's a headline worthy of FauxNews. These are some very smart goblins (or possibly orcs). They also know that the rate of atmospheric CO2 increase must slow whenever there is a drop in annual carbon emissions. That means they knew about such things as the oil price shocks of the late 70s and even the early 90s Bush 41 recession. source
Note that when the curve doubles back to the left (a decrease in annual emissions), there follows a year or two where the dots are closer together vertically (less annual change in CO2).
This must mean that 'Goblins control our economy!'
source
Note that when the curve doubles back to the left (a decrease in annual emissions), there follows a year or two where the dots are closer together vertically (less annual change in CO2).
This must mean that 'Goblins control our economy!'
-
hfranzen at 08:16 AM on 14 August 2011Murry Salby - Confused About The Carbon Cycle
The question is, "is CO2 entering or leaving the ocean at the present time?" The answer to this can be found by looking at the data - Millero's review in Geochemica et Cosmochemica Acta in 1995 provides very accurate data for the temperature dependence of the constant relating the partial pressure of CO2 over seawater versus temperature, the Keeling curve provides the increase in CO2 partial pressure with time and the rate at which seawater is warming with time is quite accurately known. A "back of the envelope" calculation then shows that CO2 is presnetly entering and not leaving the ocean and that this will remain true for a long time to come unless some currently inoperative source of heating significantly increases the rate of temperature increase or the rate of production of CO2 is significanlty decreased. -
muoncounter at 06:58 AM on 14 August 2011Climate Denial Video #3: Polluters Use Same Tactics As Tobacco Industry
pirate#24: "went through the trouble of submitting the paperwork" Will the misconceptions never cease? Here's the 'paperwork' (from the petition project website): Please print the petition, fill out the credential section, and sign as indicated. In order to obtain a pdf copy of the petition, click here. Please mail your signed petition to ... So all of 30 seconds to print, sign, check a box and write in one word (the credential section). Add in $0.38 for a stamp (a few years ago). That's it. Here's a takedown of the 'credentials,' with links to several others. Science as critiqued by petition; what a waste of time. But let's put it back on pirate: prove that there are as many active, published climate scientists among these distinguished signers as you claim. Be sure to cross off the ones who passed away prior to signing.Moderator Response:[DB] Spot-on, sir. Well-done.
-
Ken E at 06:00 AM on 14 August 2011Murry Salby - Confused About The Carbon Cycle
Also nothing presumptuous about pointing out the guy makes 2 completely contradictory arguments. Start with a model, ignore data that doesn't fit it, then argue something else that's incompatible with model you're holding above the data...and what are you left with? Certainly nothing of scientific merit. -
MarkR at 05:56 AM on 14 August 2011Blaming nature for the CO2 rise doesn't add up
1. Wingding I accept that if the change in atmospheric CO2 is being fixed by magical goblins, then human contributions don't matter. If Joe Bastardi can provide evidence to demonstrate that goblins are fixing the net CO2 flux, and hopefully explain why they only decided to start doing it at the industrial revolution and increasing it proportionally to human emissions, then I would welcome the evidence and find it fascinating. -
dana1981 at 05:51 AM on 14 August 2011Blaming nature for the CO2 rise doesn't add up
Regarding this particular point though, I really cannot believe that so many so-called "skeptics" actually believe that CO2 is rising in response to temperature, when the argument is so easily debunked by this simple accounting approach (let alone the many other lines of evidence). Just goes to show the power of denial blinders. They seem to completely shut down critical thinking. -
dana1981 at 05:46 AM on 14 August 2011Blaming nature for the CO2 rise doesn't add up
MA Rodger - I've drafted up a post responding to Bastardi's Gish Gallop. At least the comments he made on Fox News and Tamino's recently. We'll publish it in a couple of days. Suffice it to say, as I'm sure you're well aware, Bastardi doesn't have the slightest clue what he's talking about on any of these points. -
MA Rodger at 05:06 AM on 14 August 2011Blaming nature for the CO2 rise doesn't add up
The linked Bastardi comment on the Tamino blog provides mainly a cut & paste job from a post on WUWT which totals about 1,000 words of nonsense. I summarise it here (still 180 words because summarising nonsense is word-intense). Bastardi says in his Tamino comment that some think him and his ilk to be right-wing idiots. I don't know his politics so I cannot say that he is. SUMMARY Only 3% to 5% of the annual increase in atmospheric CO2 rise of 1.5ppm is due to human emissions. This is small and (even if small is bad) oceans and atmosphere are big. And all the energy is in the oceans so showing the change is due to an atmospheric trace gas (has not been done &) is daunting. Contrary to climate models, satellites suggest the heat is escaping into space so CO2 sensitivity is low and model-assumed positive feedbacks are actually negative. Global warming from 1800 is said to be man-made with the assertion for 1977-98 “What else can it be?” But there was cooling since 1800, natural cooling so why not natural warming? Sunspots fit well as the driver of temperature since 1800. CO2 levels are driven by temperature as the ice core data show and so did Salby. Extreme weather events are more caused by cooling climates not warming ones. Ocean & solar cycles will cool the planet in coming decades. This will likely be obvious by 2020. If temperatures rise despite these cycles, “you carry the day.” -
Dikran Marsupial at 04:39 AM on 14 August 2011Climate Denial Video #3: Polluters Use Same Tactics As Tobacco Industry
apiratelooksat50 wrote "And, you know all this how?" reading the documentation for the petition project would tell you that they organisers make no distinction between climate graduates and those actively pursuing careers in climatology. But surely you knew that already? The survey however does verify this distinction. -
apiratelooksat50 at 04:27 AM on 14 August 2011Climate Denial Video #3: Polluters Use Same Tactics As Tobacco Industry
TC at 21 "But what of your 39 climate scientists who do not accept the consensus? The simple fact is that most science graduates do not go on to research. They still get counted as scientists for the purposes of the petition, even if their day job is slinging burgers at MacDonalds." And, you know all this how? At the end of the day, you still have 30+ climate scientists who went through the trouble of submitting the paperwork to have their names added to the petition, vs. 75 climate scientists who answered a vaguely worded, online, 2 question survey designed to ensure participation. -
Dikran Marsupial at 03:44 AM on 14 August 2011Blaming nature for the CO2 rise doesn't add up
wingding However it is implausble if we want to do some science where the causal mechansim must also be plausible. The problem for Salby is that the numbers don't add up for his theory. The fact that the numbers do add up for your (physically implausible) "theory" doesn't change the fact that they don't add up for Salby's. BTW anthropogenic CO2 emissions do affect natural uptake and emissions; the reason that the natural environment is currently a net carbon sink is a response to rising CO2 levels caused by anthropogenic emissions. -
actually thoughtful at 03:28 AM on 14 August 2011Skeptical Science Helps Students Debunk Climate Myths
Apirate, My comment wasn't flip. It was in earnest. While I respect your chosen profession, and that you are open to changing your mind (really, kudos on that - it appears we must simply wait for you to process all the good information you are getting and apply it to your life). I am very sensitive to the cognitive skills and development of teenagers, and I believe the phrase "garbage in, garbage out" applies more to teenagers than even to computers. As to your reply to me, your critical thinking, in falsely equating WUWT to SkS fails at points 3 (you have failed to judge the credibility of WUWT), 4 (you have failed to identify the assumptions of WUWT) and 6 (you have failed to judge the quality of the argument of WUWT). Given that, how can you possibly site 1-6 of your list as support for WUWT? You are not being internally consistent here. Here is a critical thinking assignment for your students (that you would benefit from): Pick an article in WUWT on a subject that also has an article in SkS - have your students compare and contrast the articles through the lens of 1-6 above. I think you will be surprised by the outcome. Most of us have already gone through this (or else it was intuitively obvious). -
wingding at 03:04 AM on 14 August 2011Blaming nature for the CO2 rise doesn't add up
What if the delta C atm (15) is fixed by temperature, or goblins, whatever. Meaning that human emission (30) determines the natural contribution: 15 = 30 + N So currently N, nature, is a sink of 15. If we cut our emissions to 0: 15 = 0 + N Then nature switches to being a source of 15. This is at least plausible on the face of it if we are just talking numbers. -
muoncounter at 02:27 AM on 14 August 2011Climate Denial Video #3: Polluters Use Same Tactics As Tobacco Industry
DSL#20: "using the same methodology" According to these results, there is room for significant doubt of a number of theories: Only 53% of adults know how long it takes for the Earth to revolve around the Sun. Only 59% of adults know that the earliest humans and dinosaurs did not live at the same time. Only 47% of adults can roughly approximate the percent of the Earth's surface that is covered with water. Only 21% of adults answered all three questions correctly. On that basis: - Kepler's Laws (and Newton's for that matter) are subject to 'skepticism'; - evolution (and all the technology used for radiometric dating; indeed the fundamentals of radioactive decay itself!) are in doubt; - physical geography (and any form of satellite image analysis) are riddled with question marks. Is this how the science should be evaluated? By opinion polls? pirate, is that what you are teaching? -
Tom Curtis at 02:21 AM on 14 August 2011Climate Denial Video #3: Polluters Use Same Tactics As Tobacco Industry
Perhaps its time for a SkS Project Michael to match the NCSE's Project Steve? How long do you think it would take us to get 31,000 Michaels who accept AGW? -
Tom Curtis at 02:15 AM on 14 August 2011Climate Denial Video #3: Polluters Use Same Tactics As Tobacco Industry
apirate @17 & 18, the denominator is absolutely essential to critical thinking about poll results. Probability theory is just the science of ratios, and statistics is a special branch of probability theory that applies the theorems of probability to sampling. The upshot is, if you do not keep the denominator firmly in mind, your thinking about survey results will be simply nonsense. Now, if you want to break down the figures from Doran, you get the following figures: 10,257 research geo-scientists in the US; 3,146 respondents; approx 5% (155) climate scientists; 79 actively publishing climate scientists. From this you can determine that there are approx 500 research Climate Scientists in the US, or which 255/500 are actively publishing in climate science; of which 244/255 accept the consensus on global warming. That leave about 11/255 actively publishing climate scientists who do not accept that consensus, in the US. Approximately 88% of all research climate scientists accept the consensus, meaning there are about 60/500 research climate scientists in the US who do not (a number which inlcudes the active publishers). But what of your 39 climate scientists who do not accept the consensus? The simple fact is that most science graduates do not go on to research. They still get counted as scientists for the purposes of the petition, even if their day job is slinging burgers at MacDonalds. All you can deduce from that figure is that 0.12% of global warming skeptics with technical training of any sort actually have relevant qualifications to assess the climate science. Not a very reassuring statistic for those in denial about AGW. It's no wonder that you don't want to have anything to do with the denominator.
Prev 1539 1540 1541 1542 1543 1544 1545 1546 1547 1548 1549 1550 1551 1552 1553 1554 Next


