


 Arguments


Recent Comments
Prev 1552 1553 1554 1555 1556 1557 1558 1559 1560 1561 1562 1563 1564 1565 1566 1567 Next
Comments 77951 to 78000:
-
Paul D at 18:21 PM on 22 August 2011GHG emission mitigation solutions - a challenge for the Right?
I forgot to add that part of the issue is to do with knowledge itself. The right in particular believe that if you have knowledge of something than that knowledge must be utilised. eg. If you know coal can produce electricity, it is the right of everyone to exploit it. But what if we didn't today know how to use coal to make electricity and only knew about wind turbines and even nuclear reactors?? This clearly shows that it is knowledge that allows people to say 'we must use this resource'. What restrictions do is to place an artificial barrier to specific knowledge because other knowledge (about climate in this case) says using the coal knowledge would be harmful. So ultimately it is a battle of knowledge and some rejecting specific knowledge. Those that support AGW accept that the knowledge of coal producing electricity, they also accept the knowledge of climate changing. The other people accept coal knowledge but question climate science or reject it completely. Which really points to focusing on climate science, since all sides accept coal can produce electricity! -
Paul D at 18:09 PM on 22 August 2011GHG emission mitigation solutions - a challenge for the Right?
I personally have no problem with restricting access to technology that is known to be damaging, do the right?? You have to be an extremely dishonest person to be happy that you are allowing humanity to destroy itself and that it was possible to prevent that destruction. Surely the question (put simply) is if one wants to travel from A to B, no one is stopping you doing it, but they might want to restrict how you do it, depending on what is available at the time the person wants to travel. And what happens under such circumstances? Well one thing that often happens is people become innovative and invent new systems that can do something better within the restrictions. This happens all the time. There isn't much in the way of politics involved here, just that people are creative and adapt. Commercial companies are free to develop within a (environmentally) sustainable legislative structure. -
skywatcher at 17:34 PM on 22 August 2011A new SkS resource: climate skeptics and their myths
#89: There is nothing bad happening now???? I suppose as usual you'll 'wait and see' if the rising trend in natural disasters, the faster-than-expected melt of Arctic ice, the acidifying oceans, or the large spikes in food prices continue (to use just a few examples). You advocate waiting on just about every thread, even when there's ample evidence to act now. There's plenty happening right now that's definitely not good, but only if you open your eyes Eric. Well said Sphaerica. -
Stevo at 16:02 PM on 22 August 2011OA not OK part 18: Been this way before
Thanks for the links, Doug. What struck me was how compelling Richard Lindzen was when spoeaking to the committee, i.e. not very. It was gratifying to see that the USN recognises the realities of AGW. Looking very much forward to the summation articles in this series. -
adelady at 15:23 PM on 22 August 2011There is no consensus
Rick "At some point I'll pick an aspect of the science and get as into the detail of that as I can..." 'An aspect' encompasses many things. If you're looking at the central issue - the radiative physics of gases - all well and good. That's where the core science is, that's where the agreement is. Don't pick a side issue or a fine detail like droplet sizes affecting albedo of clouds (and dozens and dozens of similar nitpicks). The item that's been so competently put together relies on radiative physics in the atmosphere. The fine details are important for getting the best presentation possible - but the garnishes, crockery and cutlery don't change the fact that a meal is ready to serve. Changing the colours of plates or shape of forks might improve the look but not the nutritional content or the taste of the food. If, like me, you're not a scientist, concentrate on learning the basics. Be warned, basic does not mean simple or easy or quick. Science of Doom is probably the best place to start for digestible serves of serious science. -
Rickoxo at 14:18 PM on 22 August 2011There is no consensus
Muon 424, I didn't mean to try for a higher standard, I was just trying to pull out what hit me as a clear and critical premise from IPCC so we didn't get bogged down in questions of, "well this person disagreed because of the policy issues, and this person disagreed because of something else, etc." I got that quote from here on this site and now looking back, I see I didn't give a reference, sorry for that. The quote comes from Dana1981 in the big picture post that's linked on the home page, end of the 2nd sentence in the "Humans Are Causing the Warming" section. I used that quote because I thought it reflected a reasonable summary of the opinion at this site and I thought it reflected what IPCC said as well. Sorry for the error on my part. I appreciate your comment, "That's a new, vastly higher hurdle; some no doubt can and do disagree with your words 'quantify,' 'verify' and 'essentially all'." I find it interesting that this site is promoting a statement of GWS that is stronger than the IPCC position. In that same section of Dana1981's post, he answers the question of what would it take to refute man-mad global warming theory, "it would require that our fundamental understanding of physics be wrong, because that's what the theory is based on. This fundamental physics has been scrutinized through scientific experiments for decades to centuries. It's this kind of combination of extremely strong statement of GWS linked with a claim that the evidence is so overwhelming that it's basically beyond refutation that makes me think this site is expressing more personal opinion than summary and distillation of what the scientific community would say about this topic. I'd bet everything I have that if those two sentences from Dana1981 were on the Doran survey, there wouldn't be anything near 90% acceptance of both of them. Yet those two sentences are presented in a featured article on the home page of the site. p.s. back a comment or so ago, I didn't set up the criteria from 20 publications as indicating sufficient status as a climate scientist, that comes from Anderegg -
Rickoxo at 14:14 PM on 22 August 2011There is no consensus
DSL, I don't think I have any basis for an assessment of the science yet, I'm still trying to get a handle on what the experts in the field believe. At some point I'll pick an aspect of the science and get as into the detail of that as I can, but for now, getting a sense of the degree to which experts in the field see the science as settled or open to debate but clearly leaning in a direction hits me as a useful starting point. I get that Doran didn't define the context under which he was asking about human contribution to climate change being significant, that's one of the flaws in his survey, but that still wouldn't change the meaning of significance once he defines the nature of the contribution he was talking about. -
Doug Mackie at 14:13 PM on 22 August 2011Settled Science - Humans are Raising CO2 Levels
Tom, Alex and MP: Most people are very sloppy about ppm and ppmv and mean ppmv when they say ppm. That is they take it as understood that the units are the same: volume CO2 per volume 'air' and not some mixture of units like volume per mass. (However, by using the ideal gas laws you could convert). From our post:1 part per million (ppm) of this atmospheric mass is 5.1 x10¹² kg (5.1 billion tons), but this does not take into account the fact that CO2 molecules are heavier than other molecules in the atmosphere. Most of the atmosphere is nitrogen (78%) and oxygen (21%). Nitrogen (N2) has an atomic mass of 28 and oxygen (O2) has a mass of 32. Thus, we can say the 'average' molecule in air has a relative mass of about 29. CO2 however has a mass of 44. So, 1 ppm of CO2 thus has a mass of (44/29) x (5.1 x1012) kg = 7.7 x10^12 kg = 7.7 billion tons. If the calculation is done more carefully then the answer is 7.8 billion tons of CO2. (The FAQ at the US government Carbon Dioxide Information Analysis Center says 1 ppm CO2 = 2.13 Gt C, but we recall from post 5 that we can convert that to Gt CO2 by multiplying by 3.67: 2.13 x 3.67 = 7.8).
Thus 31e12 kg CO2 is 4.0 ppm. The atmospheric increase is less than this due to absorption by the ocean. -
Bob Lacatena at 13:51 PM on 22 August 2011A new SkS resource: climate skeptics and their myths
89, Eric the RedNo one knows what the future will bring...
Wrong! You don't know what the future will bring, because you refuse to learn and open your eyes. I'll say it one more time. You are the guy who jumps off of the skyscraper and is heard to say, each time he passes an open window, "so far, so good!" Intelligence is about being able to see beyond the present. The science is solid, and anyone who takes the time to learn it knows that. You don't take the time to learn. You come into every thread expressing tangential doubts and reasons not to worry or even look too closely at the problem. Doubt, doubt, doubt. They also become, for you, reasons to avoid paying attention to the facts or learning what you don't know. The difference between you and I is that take the time to learn about gravity and anticipate the splat (or not even jump), while you're willing to talk happily to people as the windows magically fly by. -
scaddenp at 13:49 PM on 22 August 2011GHG emission mitigation solutions - a challenge for the Right?
Badgersouth - I didnt have ambitions beyond people already arguing at Skepsci. I am looking at the root of denial, where political values are involved. I think that if someone interested enough to look at skepsci can see ways of looking at the problem without an assault on political values, then they can then be more open to looking at the science objectively. TC - I think that it is also true some significant reduction in emissions is better than no reduction. However, "significant" does mean some serious dent. I dont think "fee and dividend" or trading schemes are going to make massive reductions quickly - they just remove some barriers to switching technology. Just for my 2c. I'm all for just a ban on new coal generation - that gives you 30 years to replace generation and let the market figure out what's the best replacement. Definitely not a solution to appeal to the right however. -
John Hartz at 13:47 PM on 22 August 2011GHG emission mitigation solutions - a challenge for the Right?
Muoncounter #30: I concur with your timeline. You have also convinced me that Ken Lay may have influenced the Clinton Administration on cap and trade. I suspect a lot of others did as well. -
SocialBlunder at 13:41 PM on 22 August 2011Antarctica is gaining ice
Thank you both DB and Steve! -
Tom Curtis at 13:19 PM on 22 August 2011Settled Science - Humans are Raising CO2 Levels
Alexandre @30, how do you convert ppm by mass of CO2 into ppm by volume? -
Tom Curtis at 13:17 PM on 22 August 2011GHG emission mitigation solutions - a challenge for the Right?
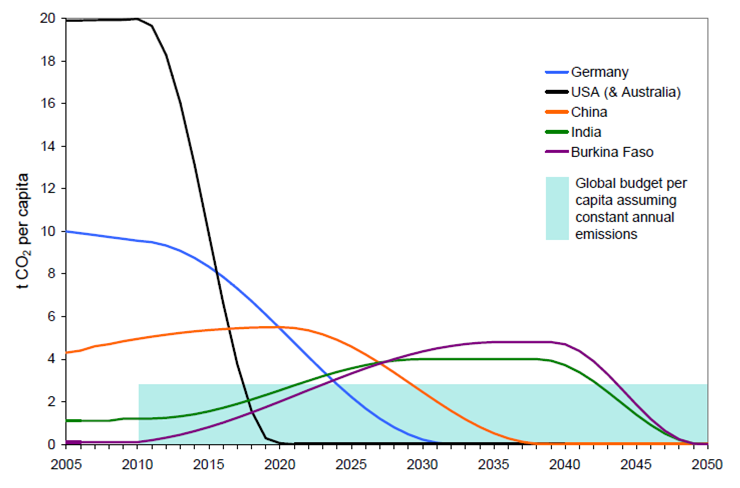
I am posting this separately from my preceding post even though it is logically connected, in order to give the point some space. The point is simple: Any purported Libertarian solution to the problem of climate change must be able to eliminate global emissions by 2050 as per the first chart in my preceding post. Further, any purported solution that rejects a carbon market must reduce US emissions to zero by 2020 as in the second chart above. Anything else is not a solution. That also means Camburn's one word solution needs to be elaborated. How exactly will sufficient thorium reactors be introduced to the US by 2020 to eliminate all use of fossil fuels for standing power and transport, based on Libertarian principles. In the absence of a discussion of that point, just saying "Thorium Reactors" is an evasion, not a solution. -
muoncounter at 13:17 PM on 22 August 2011GHG emission mitigation solutions - a challenge for the Right?
Badgersouth#26: Ok, so take the legal concept back to the Clean Air Act of 1990, but that dealt with trading SO2 allowances. In this 1997 US House document, carbon trading was a 'possibility': Using tradable emissions to achieve regulatory goals can be expanded to cover additional pollutants. Two possibilities are particulate matter and ozone under the Clean Air Act and carbon dioxide and other greenhouse gases under the Framework Convention on Climate Change. That's about the time Ken Lay was dumping campaign contributions in Democratic pockets and living large at the White House. Do you have a different timeline? -
SteveS at 13:16 PM on 22 August 2011Antarctica is gaining ice
SocialBlunder, Have you looked at the intermediate tab? From that article, the 2002 paper might not be in error (since the data was probably obtained sometime before 2002). The 2nd figure (from Velicogna 2009) shows a curve that indicates that somewhere around 2001 or 2002 the ice mass was stable. Now the ice mass is negative and the loss is increasing by ~26 Gt/year. So if that acceleration is constant and if the ice sheet was in balance in ~2002, then in ~2001 the ice sheet would have been gaining 26 Gt/year. A lot of ifs there, but I see no reason to disbelieve the 2002 paper and don't see it contradicting this article - it's just that the 2002 uses outdated information (not their fault - it was current when they printed it). But take that with a grain of salt. IANACS (I am not a climate scientist), just an aerospace engineer living as a computer scientist :). -
Tom Curtis at 13:10 PM on 22 August 2011GHG emission mitigation solutions - a challenge for the Right?
Scaddenp @25, Camburn and Muon may be right about the conception of emissions trading schemes, but that is irrelevant. The equation is quite simple. If we want a reasonable chance of preserving our children's future, we need to reduce carbon emissions at a rapid rate. Given that its already too late, to start radical reductions in 2011, we probably want to catch the blue curve (below) and aim at globally averaged reductions of 5.3% per annum. However, that is the globally averaged figure.
If we are to deal with global warming, we must treat the right to emit CO2 as a scarce good. At the moment this scarce good is a commons, but in order to ensure that it is not arbitrarily consumed, rights must be explicitly allocated, either on a national or individual basis. Because these rights are to a scarce good which is in demand, they have economic value.
The issue then becomes how do we allocate the goods. A Libertarian (and any sensible person) is committed to the view that societies are just things that people do, ie, that the fundamental ethical unit is the individual, not the society. That being the case, a "fair" distribution of this scarce good must be a fair distribution based on the number of individuals involved, not the number of societies (or nations). In other words, a fair distribution is an equal per capita distribution.
But based on an equal per capita distribution of emissions rights, the US (and Australia) is committed to reducing emissions at greater than 10% per annum:
However, that is the globally averaged figure.
If we are to deal with global warming, we must treat the right to emit CO2 as a scarce good. At the moment this scarce good is a commons, but in order to ensure that it is not arbitrarily consumed, rights must be explicitly allocated, either on a national or individual basis. Because these rights are to a scarce good which is in demand, they have economic value.
The issue then becomes how do we allocate the goods. A Libertarian (and any sensible person) is committed to the view that societies are just things that people do, ie, that the fundamental ethical unit is the individual, not the society. That being the case, a "fair" distribution of this scarce good must be a fair distribution based on the number of individuals involved, not the number of societies (or nations). In other words, a fair distribution is an equal per capita distribution.
But based on an equal per capita distribution of emissions rights, the US (and Australia) is committed to reducing emissions at greater than 10% per annum:
 Frankly, that is an impossible ask, even on a war footing.
There are only two ways to resolve this paradox. The first is to allow the exchange of rights to emit in some form of regulated market. The second is to insist in negotiation that the people of the third world surrender their emissions rights gratis because we all are finding it to hard. That second stance is the current preferred stance of western nations in international negotiations. It also directly contradicts claimed Libertarian principles.
Given that the second method contradicts Libertarian principles (and any reasonable principle of fairness), whether a the US adopts cap and trade, or fee and dividend, or whatever, it is going to have to allow for the use of traded carbon credits as offsets against the scheme it uses. Consequently the supposed advantages of Pigovian taxes is illusory. The potentially flawed carbon market will still need to be introduced anyway; and ways found to overcome those potential flaws to do so.
Frankly, that is an impossible ask, even on a war footing.
There are only two ways to resolve this paradox. The first is to allow the exchange of rights to emit in some form of regulated market. The second is to insist in negotiation that the people of the third world surrender their emissions rights gratis because we all are finding it to hard. That second stance is the current preferred stance of western nations in international negotiations. It also directly contradicts claimed Libertarian principles.
Given that the second method contradicts Libertarian principles (and any reasonable principle of fairness), whether a the US adopts cap and trade, or fee and dividend, or whatever, it is going to have to allow for the use of traded carbon credits as offsets against the scheme it uses. Consequently the supposed advantages of Pigovian taxes is illusory. The potentially flawed carbon market will still need to be introduced anyway; and ways found to overcome those potential flaws to do so.
-
Eric the Red at 13:08 PM on 22 August 2011A new SkS resource: climate skeptics and their myths
Sphaerica, I guess the feeling is mutual. There is nothing bad happening now, but wait until the future comes and disaster hits. You use this future disaster concept to overcome the fact that currently there is no problem. No one knows what the future will bring, so no one can dispute your contention. However, we do know the present, and polar bears are currently not endangered. -
muoncounter at 13:02 PM on 22 August 2011GHG emission mitigation solutions - a challenge for the Right?
scaddenp#24: "you might see useful new thinking" Take a successful project as a model: The Dutch Delta Project could only get moving in earnest after a major disaster (1953 North Sea flood). The success of this project required massive government spending and a long-term outlook. I'm no expert in Netherlands politics, but it looks like the Dutch governments that made these decisions were centrist coalitions. Coalitions that could work together to solve big problems. Those were the good old days. -
John Hartz at 12:57 PM on 22 August 2011GHG emission mitigation solutions - a challenge for the Right?
scaddenp #21: Why on earth would you believe that an article posted on SkS challenging the right to provide solutions to a problem that it denies exist, prompt anyone on the right to respond? In addition, you seem completely oblivious to the fact that the right's position on climate change has been and continues to be dictated by the fossil fuel industry. Personally, I do not believe your article serves any useful purpose and is not consitent with the core mission of SkS. -
SocialBlunder at 12:51 PM on 22 August 2011Antarctica is gaining ice
I understand that both WAIS and EAIS are in negative balance. I am trying to reconcile that knowledge with the paper linked above. The abstract states "We have used ice-flow velocity measurements from synthetic aperture radar to reassess the mass balance of the Ross Ice Streams, West Antarctica. We find strong evidence for ice-sheet growth (+26.8 gigatons per year), in contrast to earlier estimates indicating a mass deficit (−20.9 gigatons per year). Average thickening is equal to ∼25% of the accumulation rate, with most of this growth occurring on Ice Stream C. Whillans Ice Stream, which was thought to have a significantly negative mass balance, is close to balance, reflecting its continuing slowdown. The overall positive mass balance may signal an end to the Holocene retreat of these ice streams." Does the +26.8 Gt apply to only the Ross Ice Streams and not to WAIS as a whole?Response:[DB] It's good that you question the 2002 study (as that is the skeptical thing to do). Joughlin does absolutely splendid work and is highly regarded in the field. From Ian Joughin and Slawek Tulaczyk 2002 (3rd to last paragraph in the paper):
This analysis covers only the Ross Sea sector of the ice sheet, and negative imbalances are observed in other areas of West Antarctica such as Pine Island and Thwaites Glaciers.
Emphasis added, obviously.
Anyone who tries to extrapolate this result, especially in lieu of later, continental scale findings like detailed in the OP above or the Intermediate version of this post, is a serious Cherry-Picker.
I would also encourage you to review Rignot's latest work, discussed here. Absolutely fascinating stuff.
Note: Science allows individuals to register for free downloads of the older material, such as the study Joughlin study referenced in this comment. The cherry-pickers and dissemblers of the world count on people not fact-checking their claims.
Don't let them win.
-
John Hartz at 12:48 PM on 22 August 2011GHG emission mitigation solutions - a challenge for the Right?
muoncounter #23: Cap and trade was not "started" by Enron as falsely asserted by Camburn. Your news clip only prooves that Enron was licking its chops over its potential implementation in the US. -
MP3CE at 12:38 PM on 22 August 2011Settled Science - Humans are Raising CO2 Levels
Thank you Alexandre and Doug. Yes, I was using ppm instead of ppmv. Doug, I was not questioning that CO2 sinks into the ocean, that is clear to me. But when I've tried to do calculations from data, I've get obviously wrong result and I wanted to know where I've been wrong. Well, guess I'll have to learn more. -
scaddenp at 12:22 PM on 22 August 2011GHG emission mitigation solutions - a challenge for the Right?
Muon, Camburn. Interesting. I way prefer the pigovian tax to cap and trade anyway and Enron's support makes me like it even less. Suitably right-orientated in theory but lousy in practise. -
scaddenp at 12:19 PM on 22 August 2011GHG emission mitigation solutions - a challenge for the Right?
muon, if they are real skeptics as opposed to deep in denial, then they should be able to accept the challenge? If they cant take the challenge, then we have every reason to doubt the sincerity of their skepticism, and they have every reason to doubt the efficacy of their political beliefs for solving real world problems. I am only asking a hypothetical question - IF you were convinced... I think you should direct "skeptics" to take this challenge when you suspect their skepticism is actually political denial rather than scientific. On the other hand, you might see useful new thinking that would make a positive contribution to the debate on solutions. -
muoncounter at 12:18 PM on 22 August 2011GHG emission mitigation solutions - a challenge for the Right?
Badgersouth#18: " ... poppycock." Actually, I have to go with Camburn on this one (first time!) I worked for a company that had extensive deals with Enron before the bust; those were the anything-for-a-buck days. Washington Post, Jan 13, 2002 On Aug. 4, 1997, Lay and seven other energy executives met with Clinton, Gore, Rubin and other top officials at the White House to discuss the U.S. position at the upcoming conference on global warming in Kyoto, Japan. Lay, in a memo to Enron employees, said there was broad consensus in favor of an emissions-trading system. Enron officials later expressed elation at the results of the Kyoto conference. An internal memo said the Kyoto agreement, if implemented, would "do more to promote Enron's business than almost any other regulatory initiative outside of restructuring the energy and natural gas industries in Europe and the United States." -
schmoepooh at 12:10 PM on 22 August 2011Scott Denning: Reaching Across the Abyss
I see Prof. Denning as somewhat naive in his approach. A bit of a read of the psychology of belief will show that most people hold beliefs for all sorts of reasons and rationality is mainly used for post hoc rationalisation and pursuasion. Perhaps it is justified "just for the record" but his use of the "free market" "libertarian" discourse is seriously misguided. When it comes to scientific facts and the most effective solutions, "left" and "right" do not refer to scientific solutions, they refer to political solutions. Politics will play its part but lets not confuse the two. -
muoncounter at 12:04 PM on 22 August 2011GHG emission mitigation solutions - a challenge for the Right?
scaddenp#21: "You aren't going to convince them ..." Phil, they have already convinced themselves. I don't want to rain on this parade, but: Look at Heartland's environment page. These folks are in deep denial, but physics doesn't care. The global warming scare has fizzled. The sun has entered a new “quiet” phase, and average global temperatures have been stable for 15 years. Look at American Enterprise's page on Energy and Environment. They're even against energy efficiency!: When you dig into proposed "efficiency" measures, you find that usually, there's a good reason why someone has chosen not to perfectly insulate their house, or use fluorescent lights, or drive a compact car, or use a clothes dryer rather than hang their clothes out to dry. Look at Heritage Foundation's Energy and Environment page. The science behind global warming is anything but certain, but one thing is certain: The policies to cap carbon dioxide and mandate “clean” energy production are very expensive. And these are the 'think tanks'. Don't look for any kind of forward-looking leadership to come from this camp; they are only interested in the money they make here and now (well, they will probably get inheritance taxes reduced so their kids will be as fat and happy as they are). When it gets really hot, they'll just turn up the AC. -
scaddenp at 11:17 AM on 22 August 2011GHG emission mitigation solutions - a challenge for the Right?
please, please, do not use thread for criticizing the right. You aren't going to convince them and doesnt add anything constructive. I would ask the moderators to please rule that comments that are primarily criticism or defense of a particular political stance as opposed to discussion of proposed solutions as breach of "no politics" Comments Policy. -
John Hartz at 10:48 AM on 22 August 2011GHG emission mitigation solutions - a challenge for the Right?
AGW has been caused by mankind's activities (primarily the burning of fossil fuels and deforestation)s ince the beginning of the Industrial Revolution. Thus, the actions of numerous prior generations throughout the world collectvely created a global problem. The soultions therefore must be collectively created and applied world-wide Collective action is anathma to many Libertarians and right wing-nuts in the US. We waste our time and energy trying to find ways to accommodate their ideologically-driven belief systems. -
Don Gisselbeck at 10:43 AM on 22 August 2011GHG emission mitigation solutions - a challenge for the Right?
Free Market Capitalism has no mechanism for dealing with long-term existential threats. Its response to overfishing is to continue to overfish. Its response to the threat of a major asteroid strike would be straight out of the Onion http://www.theonion.com/articles/republicans-vote-to-repeal-obamabacked-bill-that-w,19025/. Do we want to survive? Probably not. -
John Hartz at 10:35 AM on 22 August 2011GHG emission mitigation solutions - a challenge for the Right?
@Camburn #2: You state: "The idea of Cap and Trade was started by Enron, endorsed by Goldman Sachs. It was looked at as a money making scheme with government blessings. Goldman Sachs had thought they had found a new gold mine with this." This statement is poppycock. -
Tom Curtis at 10:33 AM on 22 August 2011CO2 effect is saturated
Guinganbresil @173, I'm sorry but you are confusing two issues. The first issue is whether or not there is an enhanced greenhouse effect. The second is will the climate response to an enhanced greenhouse effect result in a net negative or positive feedback. The important point from Haries is that he shows beyond reasonable doubt that there is an enhanced greenhouse effect. Adding more CO2 to the atmosphere will introduce a positive forcing to the temperature, and it is known independently that that forcing is 3.7 W/m^2 for a doubling of CO2 with low uncertainty. Having established that, and this is another of those areas of settled science in climate change; the question becomes, "What is the climate sensitivity?", and we must look to independent evidence for that. Suffice it to say that a range of empirical evidence including recent observations and paleoclimate observations show that the climate sensitivity for a doubling of CO2 is around 3 degrees. Given that you need to look at the likely impacts of such a climate sensitivity. Ignore the impacts for 450 ppm (the current notional limit on CO2 increases for the international community). Rather consider the business as usual (A2) scenario for the end of this century, which will result in over 800 ppm of CO2. At 800 ppm, even with a climate sensitivity of 1.5 degrees C per doubling of CO2, the Earth's temperature will rise over 2 degrees C. At 2 degrees C there is an expected 50/50 chance that the Great Barrier Reef will be destroyed. At 2 degrees C there is an expected 50/50 chance that the Amazon Rainforest will be destroyed. And these are not on/of states. Even if they survive they will survive in severally degraded conditions.
That level of ecosystem collapse is not consistent with a flourishing civilization. If our civilization survives that level of ecosystem collapse, it will be a hard, unpleasant skin of our teeth affair.
And that is for a climate sensitivity so low that we have a less than 1 in 20 chance of being that lucky. More likly we will be looking at a 4.5 degree increase, an increase of the same order as the difference between glacial and interglacial temperatures, and which will have similarly large impacts on ecosystems and habitability.
As an aside, the anvil head thunderstorm does negate the effect of CO2 over the region of the thunderstorm, but only by imposing a much stronger greenhouse effect.
Given that you need to look at the likely impacts of such a climate sensitivity. Ignore the impacts for 450 ppm (the current notional limit on CO2 increases for the international community). Rather consider the business as usual (A2) scenario for the end of this century, which will result in over 800 ppm of CO2. At 800 ppm, even with a climate sensitivity of 1.5 degrees C per doubling of CO2, the Earth's temperature will rise over 2 degrees C. At 2 degrees C there is an expected 50/50 chance that the Great Barrier Reef will be destroyed. At 2 degrees C there is an expected 50/50 chance that the Amazon Rainforest will be destroyed. And these are not on/of states. Even if they survive they will survive in severally degraded conditions.
That level of ecosystem collapse is not consistent with a flourishing civilization. If our civilization survives that level of ecosystem collapse, it will be a hard, unpleasant skin of our teeth affair.
And that is for a climate sensitivity so low that we have a less than 1 in 20 chance of being that lucky. More likly we will be looking at a 4.5 degree increase, an increase of the same order as the difference between glacial and interglacial temperatures, and which will have similarly large impacts on ecosystems and habitability.
As an aside, the anvil head thunderstorm does negate the effect of CO2 over the region of the thunderstorm, but only by imposing a much stronger greenhouse effect.
-
Dave123 at 10:21 AM on 22 August 2011GHG emission mitigation solutions - a challenge for the Right?
rpauli- Species survival? Your typical right winger will respond that the species will survive and adapt....it's our civilization I want to preserve as much of as possible. -
It's waste heat
mullumhillbilly - The only way for energy to leave the Earth climate is as thermal radiation. All else is just re-arrangements of the energy within the climate. Thermal radiation leaves any object at a rate determined by (a) temperature, and (b) the ability of the surface to radiate at that temperature. Please see this Thermal Radiation wiki for an overview. Without GHG's, the surface of the Earth radiating at an emissivity of 0.98 (98% of theoretic max efficiency, as dirt and water are very effective emitters of IR) would be able to match incoming energy at a temperature of ~255K, or -18C. That would be cold. GHG's absorb IR, re-radiate a great deal back to the surface, and most importantly, as GHG concentrations increase, the effective level in the atmosphere where IR can escape is higher and (due to the lapse rate) colder. Therefore less IR escapes at GHG frequencies at any particular temperature. In order to radiate as much energy as is incoming, the Earth has to be warmer. See the following: The smooth curve shows what a 'blackbody' could emit. The notches are where GHG's reduce radiation at any particular temperature.
In order to radiate the same energy as the blackbody, the integrated area of the jagged curve must match the area of the smooth one, and hence the entire curve must be higher - the temperature of the emitting body (in this case the Earth) must be higher to scale it up. In this case, as observed, about 15C. Then outgoing matches incoming energy.
---
If this is not comprehensible, I strongly suggest doing some reading on the basics of the radiative greenhouse effect. There's tons of information out there for you.
The smooth curve shows what a 'blackbody' could emit. The notches are where GHG's reduce radiation at any particular temperature.
In order to radiate the same energy as the blackbody, the integrated area of the jagged curve must match the area of the smooth one, and hence the entire curve must be higher - the temperature of the emitting body (in this case the Earth) must be higher to scale it up. In this case, as observed, about 15C. Then outgoing matches incoming energy.
---
If this is not comprehensible, I strongly suggest doing some reading on the basics of the radiative greenhouse effect. There's tons of information out there for you.
-
barry1487 at 09:55 AM on 22 August 2011Scott Denning: Reaching Across the Abyss
Dave @ 34. I love that theory, but I think it's more like culturally reinforced cognitive inertia. At some point they just tune out when the counter-information weighs too heavily (convincingly) against their perceptions. To quote Dikran;The whole point of laying out the steps one by one was to make the argument as easy to definitively refute as possible - but no takers. ...unwillingness to engage with analogies, or to take up challenges... ...No answer was ever given... ...if truth seeking were the aim, you would have thought they would have been eager to answer, but no
Dikran, you speak my experience exactly. The better you make your case, the less willing they are to engage. But we keep trying there, reaching across the abyss and looking into it. Brrrr. I hate using the word, but maybe denialism is really the most apt. Or rejectionism. -
r.pauli at 09:54 AM on 22 August 2011GHG emission mitigation solutions - a challenge for the Right?
Wait...You aren't really presenting a premise of Adapt OR Mitigate? Are you? Because all the science that I see here and with IPCC models suggests that we face 2 degrees of warming no matter what we do. And now we perilously flirt with runaway tipping points - and all the interesting scientific doubt I see is about whether it is too late to do anything about it. Multigenerational survival requires co-ordinated adaptation combined with mitigation. The political Right and other irrational fringe groups has already foisted politics of distraction based on religion, wishful-thinking and hyper-carbonized materialist greed. The question should not be posed to the right wing deniers - rather a question falls on the majority of the population who know the science and know the inevitable impact to all humans (of any political and religious stripe) - the question is: How do we change? How do we handle the political obstacles that block necessary change? The question is for those who intend to survive. It is not theirs to obstruct, it is ours to face. They will not ever entertain such questions. The ultimate question is have we as a species decided that we want to survive? -
muoncounter at 09:37 AM on 22 August 2011It's waste heat
mullumhillbilly#82: "GHG only operate to trap (delay) the flow when the sun is not shining. " Really? Doesn't the warming surface radiate IR during the daytime? If not, why not? How do the GHG molecules know what time of day it is? -
Tom Curtis at 09:33 AM on 22 August 2011GHG emission mitigation solutions - a challenge for the Right?
scaddenp @14, well yes, but if I bite my tongue any harder I won't have one by this afternoon. -
scaddenp at 09:12 AM on 22 August 2011GHG emission mitigation solutions - a challenge for the Right?
PaulD, arguing whether the left or right is wrong isn't going to help. I would prefer this discussion didnt descend into arguing about politics. What we want to see is solutions that the Right wing think palatable. Camburn is stepping up to the plate and it would be a shame to get distracted. -
mullumhillbilly at 09:10 AM on 22 August 2011It's waste heat
KR@81 >It's not a matter of "energy taking more hours to leave", it's a matter of how fast energy can leave. So "fast" has nothing to do with time? I agree there is near-ground early-evening warming, and I think I understand the essentials of the emissivity picture, S-B & T^4 etc, but the clock is still a factor. If the heat energy is not accumulating daily (on average at the rate of 100:1 GHG energy:combustion energy if you agree with Flanner 2009), then climate sensitivity is not as high as you think it is. Raising the edge of the bucket in a waterfall is not a good analogy because you are talking about continuous flow, whereas GHG only operate to trap (delay) the flow when the sun is not shining.Response:[DB] "whereas GHG only operate to trap (delay) the flow when the sun is not shining"
You are considerably in error on this; GHG's do their thing 24/7/365, rain/shine/by dark of night.
-
Paul D at 08:13 AM on 22 August 2011GHG emission mitigation solutions - a challenge for the Right?
scaddenp in article said: "As far as I can see, libertarian theory struggles with issues where the free action of many individuals results in a violation of the rights of another." Well that is the problem with the libertarian idealism, it works as an intellectual discussion (like all politics) but fails because science tells us that animals don't live as individuals. Humans are manipulated by their peers and hence act as 'many'. Even at the most simple level such as crowd behaviour, this is true. Geez, if we didn't act as many, then most commercial corporations wouldn't be able to function. Big supermarkets would have the wrong food in stock at nay given time. -
garethman at 08:11 AM on 22 August 2011Scott Denning: Reaching Across the Abyss
34. Dave 123, Much appreciated! It makes sense now. -
Doug Mackie at 08:05 AM on 22 August 2011Settled Science - Humans are Raising CO2 Levels
@29: I am glad you asked. Indeed a huge part of the CO2 is 'missing' from the atmosphere. Here is a quote from our post here at SkS from just a few days ago: Where has it gone? Simple: Into the ocean. Evidence? The
observed pH decrease is caused by CO2 forming carbonic acid (H2CO3).
And see also our list from Skeptical Science that shows why we know the CO2 is from human actions.
Where has it gone? Simple: Into the ocean. Evidence? The
observed pH decrease is caused by CO2 forming carbonic acid (H2CO3).
And see also our list from Skeptical Science that shows why we know the CO2 is from human actions.
-
garethman at 08:05 AM on 22 August 2011Polar bear numbers are increasing
I agree with you CB on the habitat loss issue, we should not stand by and let it happen. But I also cannot stand idly by while thousands of bears are shot by “sportsmen” If the population exploded after unlicensed unregulated hunting stopped, we see how hunting can effect a species. Maybe licensed hunting does not impact as much as unlicensed, but it has not preserved fish stocks in Europe and I don’t see why bears will be any different in the long run. If they are endangered, they don’t need the extra pressures on their population. For me, (and this I know is more personal than referenced), it does not make sense to talk about a threatened species, and support hunting it at a high level at the same time. ( -Snip- )Response:[DB] Moderation complaints snipped.
-
Paul D at 08:02 AM on 22 August 2011GHG emission mitigation solutions - a challenge for the Right?
I actually disagree there is a left or right stance on the climate change issue. The science is clear and is independent of politics. What both the left and right have to do is act on the science, how the right or left achieve this is their problem. Do not forget that both 'western' political ideologies grew out of the industrial revolution, so by definition 'capitalism' and 'socialism' resulted in high GHGs and caused climate change. Ideally we need new politics and new economics, whether this will happen is questionable, the second best option is to radically change the existing ideologies. -
Paul D at 07:55 AM on 22 August 2011GHG emission mitigation solutions - a challenge for the Right?
Chris@6 said: "I once engaged a libertarian who objected to the US health care act largely on the grounds that, as it stood at the time, it would have forced individuals to buy insurance or pay tax penalties, and he felt that, as a young and healthy individual, it should be his choice whether to buy insurance or not." This self reliance stuff is largely bull and in any case is based on a particular culture (Anglo-saxon and specifically American). What would this person do if his parents ran into financial trouble in retirement, just ignore them?? Most people are 'forced' to do something, it really is no big deal and libertarians should quit being two faced and start being realistic. -
Utahn at 07:28 AM on 22 August 2011GHG emission mitigation solutions - a challenge for the Right?
Camburn, how would you get those reactors online? That, I am afraid, is the rub... -
scaddenp at 07:21 AM on 22 August 2011GHG emission mitigation solutions - a challenge for the Right?
Camburn, what measures do you propose that would advance an increase in such technologies? (ie what are the barriers and how would you reduce them?). "Part of the reason that you see USA co2 emissions declining is the recession. But a larger part is increases in effiencies of energy consumption." Can you back that assertion please? How much reduction do think efficiency can bring you? -
DSL at 07:16 AM on 22 August 2011Scott Denning: Reaching Across the Abyss
Yes, Arch, I've noted your moniker around the climate blogosphere--at the good places, and the bad and ugly ones as well. It's always hard to tell what's underneath the rocks at some of these places. Often, it all adds up to a blank, and people shooting from the hip turn out to be in thrall to the ecstasy of gold. The basics are pretty simple; one doesn't need a pair of angel eyes to understand it. I've been wanting to get that out of my system for months (since the 3rd of February *wink*).
Prev 1552 1553 1554 1555 1556 1557 1558 1559 1560 1561 1562 1563 1564 1565 1566 1567 Next


