


 Arguments


Recent Comments
Prev 1564 1565 1566 1567 1568 1569 1570 1571 1572 1573 1574 1575 1576 1577 1578 1579 Next
Comments 78551 to 78600:
-
Tom Curtis at 08:28 AM on 25 July 2011Gripping video of Arctic sea ice melting away before your eyes
eldorado2768, a time and date stamp for each frame is in the top left corner. The data also shows the location (latitude and longitude and pitch), but not the internal temperature which I know to be recorded :(. Anyway, the time interval is from early March 22nd to July 22nd, 2011. -
Tom Curtis at 08:23 AM on 25 July 2011Rising Oceans - Too Late to Turn the Tide?
apirate @12, the IPCC projections are not linear, and explicitly exclude melt water from glaciers because they are not sufficiently predictable. Those glaciers will melt, however, or at least a significant amount of the Greenland Ice Sheet and the West Antarctic Ice Sheet will melt although it will probably take centuries to do so. Based on your second graph (from wikipedia, I believe) the sea level rose 115 meters in the 8 thousand years from 16k before present to 8 k before present. That represents a rate of rise of 144 mm/decade, and is a reasonable projection for the rate of rise by the end of this century. That would yield a sea level rise in the order of 650 mm by 2100, and double that for the following centuries until the 6 to 8.5 meter rise above current levels is achieved, assuming we restrict GHG emissions sufficiently to restrict global temperature increases to 2 degrees C. Contrary to many commentators here, I believe that those rates are well withing the economic means for adaption; but I also think sea level rise will cause the least economic hardship globally of the various risks from global warming. -
muoncounter at 08:20 AM on 25 July 2011The Medieval Warm(ish) Period In Pictures
Camburn#56: "I have not seen any rebuttals to the Sargasso Sea temperature proxies." Perhaps not. However, here is an excellent rebuttal to the numerous misrepresentations of Keigwin's Sargasso Sea data that continue to rebound throughout deniersville. Keigwin’s Fig. 4B (K4B) shows a 50-year-averaged time series along with four decades of SST measurements from Station S near Bermuda, demonstrating that the Sargasso Sea is now at its warmest in more than 400 years, and well above the most recent box-core temperature. Taken together, Station S and paleo-temperatures suggest there was an acceleration of warming in the 20th century, though this was not an explicit conclusion of the paper. Keigwin concluded that anthropogenic warming may be superposed on a natural warming trend. ... Keigwin’s Fig. 2 showed that δ18O has increased over the past 6000 years, so SSTs calculated from those data would have a long term decrease. Thus, it is inappropriate to compare present-day SST to a long term mean unless the trend is removed. -- emphasis added This analysis, Misrepresentation of Scientific Data by Hillary Olson at UT, is based on a 2010 GSA talk by Boslough and Keigwin. It features a point-by-point demonstration of the manner in which deniers cherry-pick from a legitimate study, modify, distort and misrepresent. It includes a discussion of how internet memes arise and gain traction despite being factually incomplete or incorrect. This particular 'Saragasso Sea was warmer way back when' meme is traced to the folks behind the Oregon Petition. For the benefit of any skeptical educators, Olson includes the relevant sections from the Texas Essential Knowledge and Skills (TEKS): The student uses critical thinking, scientific reasoning, and problem solving to make informed decisions within and outside the classroom. The student is expected to: (A) in all fields of science, analyze, evaluate, and critique scientific explanations by using empirical evidence, logical reasoning, and experimental and observational testing, including examining all sides of scientific evidence of those scientific explanations, so as to encourage critical thinking by the student; (B) communicate and apply scientific information extracted from various sources such as current events, news reports, published journal articles, and marketing materials; (D) evaluate the impact of research on scientific thought, society, and public policy; It is too bad those skills are in such short supply these days. -
eldorado2768 at 08:12 AM on 25 July 2011Gripping video of Arctic sea ice melting away before your eyes
What timeframe do the spliced images cover? I think that would be helpful information. -
Tom Curtis at 08:04 AM on 25 July 2011China, From the Inside Out
Byron Smith @80, the original for the graph comes from the WBGU report, "Solving the Climate Dilemma: The Budget Approach" (PDF). It is an excellent policy advisory document, and maintains neutrality between various policy options, including an historical responsibility approach, in which each nation has a per capita budget starting in 1990 (which has been already spent in the case of the US and Australia). I tend to ignore it as I do not think it would ever be accepted by the US. I do apologize for the condition of the original graph. I was posting away from home, and did not have access to my favourites bar. Here is a better version from SkS: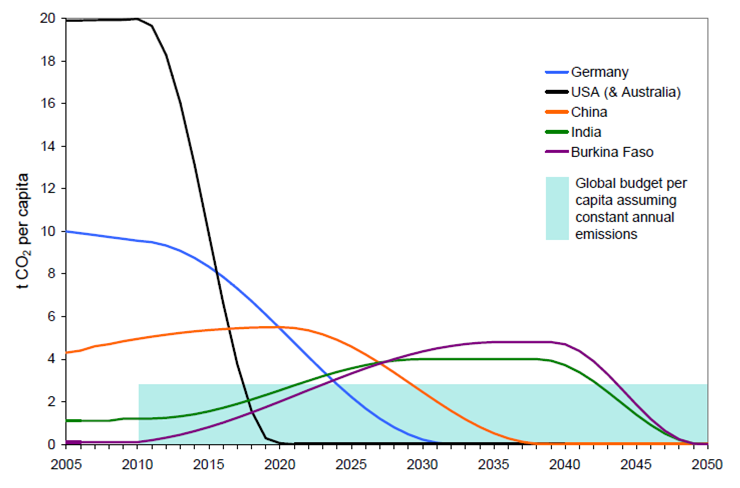
-
Robert Murphy at 07:49 AM on 25 July 2011Human CO2 is a tiny % of CO2 emissions
Ken at 123: "Why doesn't the GHG chart include Water Vapor..." Because it is an emissions chart. Our emissions have no direct effect on global water vapor levels; those levels are a direct function of global temps, and essentially nothing else. Water vapor is the only GHG that will precipitate out of the atmosphere at temps we experience. The other GHG's stay aloft a lot longer, in particular CO2. Water vapor really only acts as a feedback, not as a forcing. Our emissions of other GHG's are forcings. -
michael sweet at 07:48 AM on 25 July 2011Gripping video of Arctic sea ice melting away before your eyes
The melting of the ice shelves on Ellesmere Island show that the Arctic ice is at the lowest level in at least the last 5,000 years. Since 2011 is currently lower than any other year measured, that means 2011 is the lowest for July 24 in at least 5,000 years. A Pirate: can you suggest a 5,000 year cycle that is peaking that would account for this collapse of the ice? If no such cycle can be proposed that indicates that the extraordinary melt this year is not due to natural cycles but instead to human influence. Please provide references to data to support your "natural cycles". It is not enough to suggest "natural cycles". You also have to provide data to suggest they exist. Without data you are just waving your hands. -
apiratelooksat50 at 07:39 AM on 25 July 2011Rising Oceans - Too Late to Turn the Tide?
Muoncounter @ 3 If we go back 130 years we see the basically the same trendline. Going back 24K years we see a sharp rise following the meltwater pulse following the last glacial maximum. That sharp rise leveled out about 8K years ago to what we are experiencing now.
 And, from IPCC 3 we get their sea level projections.
 So, whether we look at 18 years, 120 years, or 8,000 years we are seeing a linear response.
-
Ken at 07:34 AM on 25 July 2011Human CO2 is a tiny % of CO2 emissions
Why doesn't the GHG chart include Water Vapor, which is, I believe, the largest GHG? When Water Vapor is included as a GHG, it represents 95% of the GHGs. I thought it was well established that Water Vapor plays the largest role in keeping the Earth at a temperature that will support life. We do not seem to be considering all the variables here.Moderator Response: See "Water vapor is the most powerful greenhouse gas." -
HK at 07:26 AM on 25 July 2011Milankovitch Cycles
Camburn, if you compare the CO2 levels at Mauna Loa and the South Pole, you will see that they follow each other quite closely, despite the fact that the levels are rising much faster now than at the end of the last ice age. When the SH responds to the change in GHG’s, this response will cause a positive albedo feedback just as in the north, although not as strong. And BTW, one of the Milankovitch cycles, the obliquity or axial tilt, will affect both hemispheres in the same way as both poles get more insolation and the tropics get less. -
Paul Magnus at 07:25 AM on 25 July 2011Rising Oceans - Too Late to Turn the Tide?
I bet no body really believes this, otherwise we would all be clamoring to address it! I wonder how Holland is reacting to these latest findings on the sensitivity of the ice to temp rise? They have opted for defense, but as these data come out surely they will have to reconsider and start thinking about retreat as the main strategy. Where are they all going to go? -
Composer99 at 07:25 AM on 25 July 2011Rising Oceans - Too Late to Turn the Tide?
Climate4All: {citation needed} -
Paul Magnus at 07:20 AM on 25 July 2011Rising Oceans - Too Late to Turn the Tide?
"We expect something quite different for the future because we're not changing things seasonally, we're warming the globe in all seasons," McKay said." Surely the main forcing once warming got underway was GHGs which reenforced the seasonal warming and at some point takes over. Would be interesting to find this point where the ghg feedback takes over from orbital forcing.... -
Byron Smith at 07:15 AM on 25 July 2011China, From the Inside Out
Ah, found it (scroll down). It was used by Potsdam Institute Director Professor Hans Joachim Schellnhuber in his presentation to the "4 Degrees & Beyond" conference in Oxford, 2009. -
Paul Magnus at 07:11 AM on 25 July 2011Rising Oceans - Too Late to Turn the Tide?
"McKay pointed out that even if ocean levels rose to similar heights as during the Last Interglacial, they would do so at a rate of up to three feet per century." err ... how does he come by this. I think he means average rate. The rate is by no means going to be steady. There are documented cases of large SLR over short time scales. Our CO2 forcing is ballistic compared to interglacial ones so I would think we will see spectacular ice collapse maybe sooner than later... "Even though the oceans are absorbing a good deal of the total global warming, the atmosphere is warming faster than the oceans," McKay added. "Moreover, ocean warming is lagging behind the warming of the atmosphere. The melting of large polar ice sheets lags even farther behind." I have seen graphs on this site indicating that most of the warming went in to the ocean. So am a bit confused by this statement..... -
Byron Smith at 07:08 AM on 25 July 2011China, From the Inside Out
BTW, Tom, I know I've seen that figure before, but since I can't remember where it was, can you please link to the source? (The graph currently links to the very informative and important Climate Commission Report "The Critical Decade" which is well worth reading in its own right, but doesn't contain that figure). -
Bob Lacatena at 07:01 AM on 25 July 2011Milankovitch Cycles
25, Camburn, As Dan and Dikran have pointed out... I don't see how your comment makes any sense. The two halves of the planet are quite obviously not separated by a giant, plexiglass divider. If a massive change in albedo in the northern hemisphere due to expanding or retreating year-round snow/ice cover reflects or absorbs a notably different amount of incoming solar radiation, then that is energy the planet loses/gains, period, year after year, for millenia. Once that starts, the feedbacks start. That the change is initiated in one hemisphere only seems entirely inconsequential. The global temperature will rise/fall as a result. -
Dikran Marsupial at 06:44 AM on 25 July 2011Milankovitch Cycles
Camburn IIRC the glaciations are caused by Mlankovic forcing, but the temperature changes are amplified by CO2 feedback. This feedback will apply to both hemispheres as CO2 does diffuse between hemispheres with a lag time of a year or two. Thus as far as I can see, glaciation in both hemispheres is not unduly surprising. -
Camburn at 06:17 AM on 25 July 2011Milankovitch Cycles
HK@24: The problem with this is that glaciation is mutual to both hemispheres. That fact shows the albedo etc links do not function. This is one of the puzzling things about the cycle amongst many others.Response:[DB] The fallacy you fall into is the expectation that hemispherical glaciation is symmetrical, which it is not. Consider the hemispherical distribution of land vs water to gain a sense of the size of the mismatch (and the subsequent relative changes in albedo between glaciation and interglacial).
So your "fact" is completely NOT one.
-
Albatross at 05:38 AM on 25 July 2011Gripping video of Arctic sea ice melting away before your eyes
Daniel @10, This is not "ordinary" melt. Look at the northernmost extent of the September ice minimum. Now compare that with the loss of ice at the location of the web cam. The ice margin is now (in late July) much further north than it is during the northernmost extent of the ice margin typically observed at the September minimum. Tom already made this point back @6, but apparently it needs repeating. The title is not misleading at all. -
Climate4All at 05:28 AM on 25 July 2011Rising Oceans - Too Late to Turn the Tide?
Back in the early 50's, a group of scientists had predicted that sea levels would rise higher than the predictions made by the IPCC 50 years later. Their analysis then was because we are at the end of interglacial period. I don't remember there being any type of hysteria then as opposed to now. Only now though, it's frightening and catastrophic because its man-made. What interesting times we live in. -
Byron Smith at 05:22 AM on 25 July 2011China, From the Inside Out
@Tom Curtis (#78) - Excellent answer, thank you. And that final graph is very important (though unfortunately, the x-axis has been cut off?), even though it is based on the assumption of no reparations for any previous carbon "debt" incurred by the nations that have benefitted most from a long history of emissions, but simply assumes that per capital emissions ought to be equalised from here as quickly as possible while overall emissions drop fast enough to give us a 75% chance of staying below 2ºC rise from pre-industrial temperatures by 2100. (Remember, 2ºC is still a *big* and nasty change, and should not be considered "safe", just not nearly as bad as 3ºC would be. 4ºC? Don't even think about it... (though that's where we're currently headed if all nations follow through on their commitments thus far)). So, to summarise: Australia/US/Canada (Canada fits basically in line with US and Oz for per capita emissions) have the most pressing reasons for reducing carbon emissions as soon as possible and basically as far as possible. -
HK at 05:11 AM on 25 July 2011Milankovitch Cycles
Hi! I have followed skepticalscience for a while without participating in the discussions, and my only contribution so far is the Norwegian translation of The Big Picture. Regarding how the Milankovitch cycles impact the solar insolation globally, I found an interesting graph on page 18 in the paper Target CO2 by James Hansen & Co. As you see, the difference between maximum and minimum global insolation during the last 400,000 years is only about 0.5 Watts/m2 with present day geographical and seasonal distribution of albedo. Assuming a slow-feedback climate sensitivity of 1.5 C / W/m2 gives a total climate change of only 0.75 C, much less than the 5 C difference between LGM and the Holocene. If the albedo was evenly distributed globally and not higher in the northern hemispere, the Milankovitch cycles wouldn’t be able to change the global average insolation at all. The reason why northern hemisphere is controlling the glacial cycles seems obvious to me: It’s not just because Arctic sea ice responds much faster than the Antarctic ice sheet, but because NH hemisphere has much larger areas that undergo positive albedo feedbacks during warming or cooling. Just compare the huge changes in NH ice sheets between LGM (south to about 40 N in North America and 50 N in Eurasia) and today (Greenland) and the much smaller changes in the geographically isolated Antarctica. Then we have the changes in the boreal forests known as the "taiga". During the ice ages the taiga wasn’t just pushed southward and replaced by ice sheets and tundra. The ice age climate was generally dryer than today, so much of the taiga (and also temperate forests) was replaced by open grassland (steppe, prairie etc) which has considerably higher albedo than the dark green coniferous forests that make up most of the taiga. The SH of course has nothing similar to this. And finally we have the snow cover in temperate latitudes in winter. That snow cover would also expand southward and increase the NH albedo even more. Some may argue that this albedo increase wouldn’t matter much because it happens in winter when insolation is low, but at 40 N in late winter the solar elevation angle at noon is about the same as in northern Norway in June. The areas in SH with a cold temperate climate (snow in winter) is negligible compared to NH and would expand far less during an ice age than in the NH. So, the albedo feedback is much stronger in the north than in the south because of the distribution of the continents, and as Sfaerica mentioned above, this will have an effect on levels of CO2 and other GHG’s which will spread the warming (or cooling) to the southern hemispere. -
Daniel J. Andrews at 04:46 AM on 25 July 2011Gripping video of Arctic sea ice melting away before your eyes
I must admit I found the title a bit misleading too although it is technically accurate, and I'm certainly not in the denier category either--I do guest lectures on climate change at the local university for students and tie it in to my field (ecology and biology). Instead, I thought this post might be showing something similar to that fantastic time-lapse video I saw on TED where enormous ice-sheets are melting back over a three-year period, even during the winter. Or new time-lapse video from space showing melting over a decade or more. Those were gripping! Scary too. I didn't expect to see seasonal melting, which in my perhaps northern Canadian-inured opinion, doesn't merit a "gripping", so for me, and maybe me alone, I found the title misleading. Not that you need to change it--if the deniers want, they'll take anything you write, say, do and twist it to suit their narrative anyway (e.g. the whole Jones and no warming thing). -
Andy Skuce at 04:42 AM on 25 July 2011Thinning on top and bulging at the waist: symptoms of an ailing planet
Added: There's a good Scientific American article on the Geoid that's worth a read.
Moderator Response:[DB] Updated link to SA article.
-
Dave123 at 04:38 AM on 25 July 2011Gripping video of Arctic sea ice melting away before your eyes
Kudos to Tom Curtis for driving home the message of the video. The position of the bouy vs annual ice limits and expected timing is why the video is dramatic..although anything with time lapse in it has its own inherent drama... -
Paul Magnus at 04:20 AM on 25 July 2011Gripping video of Arctic sea ice melting away before your eyes
This is a great article... maybe sKs can do some more like it.. http://www.crikey.com.au/2011/03/09/climate-change-cage-match-abbott-debates-abbott/ Not on topic (cant see where to post NOT posts) -
DSL at 04:15 AM on 25 July 2011Rising Oceans - Too Late to Turn the Tide?
aPirate, according to your method, Mt. Everest will be under water in roughly 2.78 million years. Trends are inherently historical. Models are used for prediction. How do you justify using such a simple model (extending the trend line) to predict such a complex event? Arguing from an extended trend line is useless. Get a better analysis--preferably one based in physics (unless your physical model actually predicts the second coming of Noah; if so, that would explain a lot about some of the arguments you've made). -
Andy Skuce at 04:08 AM on 25 July 2011Thinning on top and bulging at the waist: symptoms of an ailing planet
John Russell: The melt water from the ice sheets is distributed (to a first approximation, it's always more complicated!) evenly over the entire ocean surface of the world. The reason the planet's shape changes is because the ice at high latitudes is removed. Simply adding water to the oceans from some other source wouldn't necessarily increase the oblateness. The shape of the Earth, referenced to sea level, the Geoid, is not a smooth or simple geometric surface but is actually lumpy, due to gravity variations arising from the uneven distribution of density in the Earth. It would be harder to visualize the oblateness of the Earth if there were no oceans but the shape of the geoid is a useful and measured quantity, even in the center of continents. Other planets and the Moon (in fact, any body that spins on its axis) also have known oblate shapes, despite having no oceans. -
Rob Honeycutt at 02:45 AM on 25 July 2011Trenberth on Tracking Earth’s energy: A key to climate variability and change
Kevin... Thank you for stopping in to make comments and clarifications. I just want to quickly say that we know you take a lot of fire out there in the media but your hard work and dedication to the science of climate change are greatly appreciated by all. -
Kevin Trenberth at 02:29 AM on 25 July 2011Trenberth on Tracking Earth’s energy: A key to climate variability and change
As has been noted, I have been traveling, and I have quickly gone through the 67 comments. A few responses follow. There seems to be some confusion over Fig. 3. This represents the total net radiation from CERES EBAF and so it does include effects of clouds. It is not just the clear sky component (that is a lot more uncertain). Ironically the working definition of "clear sky" used in the community excludes clouds but includes aerosol. Since aerosols affect clouds (the indirect effect), I find this rather unsatisfactory. Still it does not affect things here. There is discussion in the comments of the supposed finding that increasing aerosol (pollution) from China may be the explanation for the stasis in surface temperatures and I do not believe this for a moment. Similarly, Jim Hansen has discussed the role of aerosol as a source of discrepancy. However, the radiation measurements at the top of the atmosphere from satellites (CERES) include all of the aerosol effects, and so they are not extra. They may well be an important ingredient regionally, and I have no doubt they are, but globally they are not the explanation. How did the imbalance occur (comment 2) can be seen from Fig 3 broken into ASR and OLR (not shown here). ASR increased, suggesting fewer clouds as occurs in La Nina over the tropical Pacific, but OLR decreased. The latter seems to be mainly a temperature signal: colder conditions mean less radiation to space. This is often a complex relationship because the biggest variations occur in the Tropics and there is typically a large offset in OLR and ASR signals in association with variations in convection that largely relate to albedo effects being offset by the radiation to space from tops of clouds. Thus fewer clouds means more ASR and more OLR (since the radiation to space comes from warmer lower levels). But that works only in the tropics. At higher latitudes OLR is dominated by surface temperature effects. Comment 17 asks about "back radiation" which is really "downwelling radiation" that is the downward component emitted from the atmosphere in all directions. Clouds, water vapor, and all the greenhouse gases play a key role and the emissions correspond to the temperature of the air. For clouds, the key temperatures are the cloud top temperature for emissions to space and the cloud bottom temperature for emissions back toward the surface. An important point is that to understand the energy flows (which include radiation), the full three (or really four) dimensional structure of the atmosphere is needed, and the simple Figure 1 does not show the vertical structure of temperature. In response to 26: yes melting permafrost can take up some energy but the amount turns out to be very tiny. The last topic I'll touch on is the ocean heat content (OHC). A couple of references were made to the von Schuckmann and Traon paper, which was nice to see, but has some flaws. For instance the data down to 2000 m in the ocean have increased since 2002 and since the beginning of that analysis, yet their error bars are constant. New analyses will be of considerable interest and are underway. I discussed this in this article here in Nature: Trenberth, K. E., 2010: The ocean is warming, isn't it? Nature, 465, 304. http://www.cgd.ucar.edu/cas/Trenberth/trenberth.papers/NatureNV10.pdf ENSO involves a redistribution of OHC and losses to the atmosphere in the latter part of El Nino, and gains during La Nina, so this is internal to the climate system, not external (comment 31). The southern ocean is clearly playing a role (comments 48, 49)in taking up heat and mixing it deep, even though the magnitude of the observed warming is small. But the data are fragmentary and unsatisfactory in many respects. Nonetheless, the southern oceans, while playing some role, are not the main place where the heat goes in our model. We have a paper submitted that describes and documents that in more detail so it is premature to go into detail here. A nice paper is in press in GRL by Palmer et al (UKMO) using two Hadley climate models that details the relationship between SST and OHC to different levels in their model. Going all the way to the bottom accounts for all of the OHC but the upper OHC in the top 300 m and the SST (which relates to that) are not always good indicators of total OHC. So they also find that energy can go missing into the deeper ocean, and moreover the main phenomenon in their model associated with this is La Nina. [This latter point is not in their article]. The bottom line is that the ocean plays a major role in climate and especially in interannual and decadal variability, and a lot more will be written on this topic. Maintaining an adequate observing system is extremely important. Kevin TrenberthResponse:[DB] Hot-linked URL.
-
John Hartz at 02:21 AM on 25 July 2011Rising Oceans - Too Late to Turn the Tide?
I have alerted the three authors of the paper summarized in this news release about this posting. They may choose to chime in on this comment thread. -
John Hartz at 01:43 AM on 25 July 2011Rising Oceans - Too Late to Turn the Tide?
@Apiratelooksat50#2: Exactly which figures do you disagree with? Have you read the published paper that this news release is summarizing? -
muoncounter at 01:41 AM on 25 July 2011Rising Oceans - Too Late to Turn the Tide?
pirate#2: "I disagree" Let's see, for this study, UA team members analyzed paleoceanic records of global distribution of sea surface temperatures ... then compared the data to results of computer-based climate models simulating ocean temperatures ... The team found that thermal expansion could have contributed no more than 40 centimeters – less than 1.5 feet – to the rising sea levels during that time ... That means almost all of the substantial sea level rise in the Last Interglacial must have come from the large ice sheets For the dissenting 'study,' we see a graph covering an 18 year period and an extrapolation to 89 years. Yeah, I'd say that's disagreeable. -
muoncounter at 01:24 AM on 25 July 2011Gripping video of Arctic sea ice melting away before your eyes
pirate#4: "it is designed to play on emotions ... " Odd. An emotional response to the title of an article? Rather than what is described in that article? "... and imply something other than a natural cycle that occurs annually. " That 'natural cycles' gambit is more of a dead-ender now than the past few times you've trotted it out. It is on you to substantiate those 'cycles'. For example, how does the July 14 Icelights fit into a natural cycle? So far this summer, Arctic sea ice has been melting at a record pace. ... ice extent is currently lower than it was at the same time in 2007, the year that went on to shatter all previous records for low ice extent in September There's something about living more than 2 standard deviations below the mean that just ain't natural. But no doubt you can rationalize that away. And the subtitle to Icelights, 'Your Burning Questions About Ice & Climate,' was surely designed to play on your emotions. -
Bob Lacatena at 01:02 AM on 25 July 2011Milankovitch Cycles
To elaborate on scaddenp's comment at 17 (not sure if this has already been clearly stated elsewhere in the thread), my own understanding is that current theory states that the changes in insolation do not actually affect much themselves except to shorten/cool NH summers at the onset of a glacial, or to lengthen/warm NN summers at the onset of an interglacial. This warming is enough to cause a slow (meaning a lot slower than what we're doing to the Arctic) advance or retreat of northern hemisphere snow cover. Because of the amount of land in the NH, this results in a substantial change in albedo, which of course drops temperatures, and advances/retreats snow cover further. The drop in albedo further results in other feedbacks, primarily CO2, through things such as vegetation changes and ocean temperature changes. These, of course, evoke further feedbacks, as is well described by current climate science literature. The fact that changes in TSI are so minimal, and yet the glacials/interglacials occur, is an important clue that climate sensitivity is high. Ultimately, these effects all combine enough to cause the level of climate change required. The main problem I've seen in the literature is in trying to identify the cause/mechanism behind what appears to be an abrupt release of CO2 (which is both detected in ice core measurements, and also required for the degree of climate change seen) early in the termination of a glacial period. There's a lot of literature to be found just by searching for "CO2 glacial termination."Response:[DB] Fixed original text.
-
Tom Curtis at 00:51 AM on 25 July 2011Gripping video of Arctic sea ice melting away before your eyes
Seeing apirate wants to play silly-buggers, I think it's appropriate to look at the mean sea ice extent for September as shown here (pink line):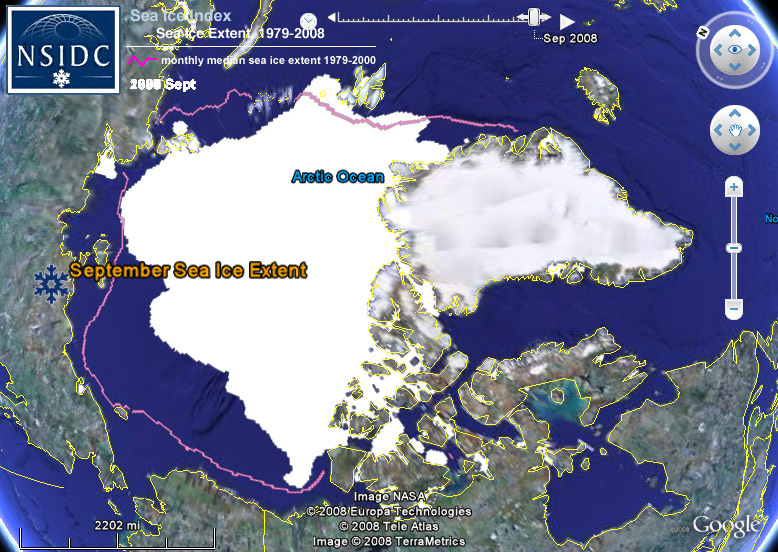 The interesting thing is that the location of the buoy from which the video was made is well inside that pink line. So in late July of 2011, it is already melting back beyond the mean September sea ice extent for 1979 to 2011.
This can be confirmed in the picture below of sea ice extent on July 17th
The interesting thing is that the location of the buoy from which the video was made is well inside that pink line. So in late July of 2011, it is already melting back beyond the mean September sea ice extent for 1979 to 2011.
This can be confirmed in the picture below of sea ice extent on July 17th
Apirate may want to attribute the fact that the summer melt has already reached a stage it normally takes two more months to achieve simply to an annual cycle. Others may suspect, at least a little bit, that if the annual cycle was the sole factor involved than this current melt extent would be the July mean rather than near the September mean.
-
Neven at 00:10 AM on 25 July 2011Gripping video of Arctic sea ice melting away before your eyes
apriatelooksat50, the video is gripping, if you're interested in this kind of stuff. And it does simply show ice melting in the Beaufort Sea. Nothing wrong with that title, unless you're having a hard time thinking things through.Arctic sea ice melting in the summer is hardly news. I am not saying that annual Arctic sea ice extent has not declined.
Indeed, Arctic sea ice has declined in summer. So fast even that it is very big news. Unless you don't want it to be news, of course. -
apiratelooksat50 at 23:29 PM on 24 July 2011Gripping video of Arctic sea ice melting away before your eyes
DB @ 3 When one reads the title "Gripping video of Arctic sea ice melting away before your eyes", it is designed to play on emotions and imply something other than a natural cycle that occurs annually. Note: I am not saying that annual Arctic sea ice extent has not declined.Response:[DB] The title clearly and succinctly tells a story, the story of what the OP is about. It is an example of "Not burying the lead".
When one reads things into that beyond what is actually said, as you do, that is an example of Confirmation Bias/Cognitive Bias. Your intransigence on adhering to a narrative (the "natural cycles" meme) being displayed here is a textbook example of what denialists do: rushing in to defend any perceived real or imaginary attack on anything that endangers their world of rose-coloured skies and green firetrucks.
Well-done, sir. As the Great One said, "It's 5-O'clock Somewhere".
-
apiratelooksat50 at 23:24 PM on 24 July 2011Rising Oceans - Too Late to Turn the Tide?
I disagree with a lot in this paper. Mainly, I don't agree with how they arrived at their figures. If we take empirical data maintained by the University of Colorado, and do some simple math, we get the following (I will even use the upper range). 89 years X 3.6 mm/year = 320.4 mm 320.4 mm = 12.6 inches That is hardly 3 feet.
-
apiratelooksat50 at 23:00 PM on 24 July 2011Gripping video of Arctic sea ice melting away before your eyes
This technology is really impressive. However, arctic sea ice melting in the summer is hardly news.Response:[DB] "arctic sea ice melting in the summer is hardly news"
In your busy waving of straw you conveniently neglect that no one on this post has claimed that it was.
-
Doug Mackie at 21:29 PM on 24 July 2011OA not OK part 9: Henry the 8th I was (*)
Bern, I hope you are not too much like Ken - take a minute to search out some previous comments by Ken (those that moderators did not delete). At the end a booklet with added bonus material, a centrefold widescreen version of figures 13 and 14, and discount coupons will be published here as a free download. Yes, as we said at the outset, this series is intended to allow readers to understand some of the more technical posts here and elsewhere. We saw phrases like "carbonate compensation depth" bandied around and we felt that few would have been able to actually explain or derive it. -
Bern at 21:10 PM on 24 July 2011OA not OK part 9: Henry the 8th I was (*)
I think perhaps Ken, like myself, is falling victim to the instant gratification that is so prevalent in modern society, so having to wait for the whole story to be revealed is almost excruciating... On the other hand, I quite like the pacing of the series of articles, and the bite-sized nature of each post. Are you planning to post an omnibus version when all the installments have been published, or let it stand as linked posts? Re the overall question - well, I think there have been enough studies published on the matter that it's pretty clear the oceans are a net sink of CO2 - and that this series is about explain just why that is so, rather than merely asserting it. -
Bern at 20:58 PM on 24 July 2011Gripping video of Arctic sea ice melting away before your eyes
For those who missed the link in the earlier post, there are some webcams located much closer to the North Pole, which can be seen here. Note that Webcam2 seems to have fallen over at a steep angle yesterday as it's supporting ice melts. This image from a couple of days ago shows plenty of meltwater & open seawater. -
newcrusader at 20:05 PM on 24 July 2011Rising Oceans - Too Late to Turn the Tide?
A foot rise of sea level along the Connecticut coast would prove very costly. Most of the states public parks would be in deep trouble. 1 foot rise would leave Rocky Neck state park http://www.ct.gov/dep/cwp/view.asp?a=2716&q=325256 and Hammonasset Beach State Park, http://www.ct.gov/dep/cwp/view.asp?a=2716&q=325210 Both In deep trouble. Both beaches are now suffering from severe erosion. The cities of New London & Groton (home of the US Sub Base) would face serious flooding during storms. With New London seeing permanent sections under water. New Haven, home to Yale would see flooding from winter storms and sewage problems. Bridgeport would see its deep water port extend into downtown!! With 2 feet of sea rise- possible by 2050. the costs for mitigating this are exponential. Yet we have many in the US Congress fighting over the chump change deficits we have now. Power in the hands of fools. -
Tom Curtis at 18:33 PM on 24 July 2011China, From the Inside Out
Agnostic @74, absolute levels of emissions are the only relevant factor at a global level, but at a national level, per capita emissions are crucial. The alternative thesis, that at a national level absolute emission levels are the only relevant factor leads directly to the absurd conclusion that in whatever final emissions mix is finally negotiated, the Vatican should be permitted the same absolute emissions level as Italy, and that Tuvalu (pop ten thousand) should be permitted the same absolute emissions level as China or the United States. Clearly that supposition is absurd, and the insistence on not using per capita emissions as the metric for international agreements and national targets is equally absurd - and can be shown to be so by simple reasoning about fairness. If, however, we commit to a limited per capita budget of CO2e emissions, then the equation becomes fairly simple: As you can see, on a per capita basis, with a target for only a 2 degree increase above industrial levels, China can increase its total emissions by almost 50%, so long as it peaks around 2020, and eliminates all emissions by 2030. In contrast, the US and Australia need to peak now, and eliminate all emissions by 2020. That rigorous target can be ameliorated by an international trade in emission rights. But if we are not in an a global agreement that provides for such trade, there is no excuse for not reducing emissions to zero in a decade (and that would involve negative economic growth).
In the meantime China is clearly tracking very close to its appropriate target, even without trading. Whether they will continue to do so remains to be seen.
As you can see, on a per capita basis, with a target for only a 2 degree increase above industrial levels, China can increase its total emissions by almost 50%, so long as it peaks around 2020, and eliminates all emissions by 2030. In contrast, the US and Australia need to peak now, and eliminate all emissions by 2020. That rigorous target can be ameliorated by an international trade in emission rights. But if we are not in an a global agreement that provides for such trade, there is no excuse for not reducing emissions to zero in a decade (and that would involve negative economic growth).
In the meantime China is clearly tracking very close to its appropriate target, even without trading. Whether they will continue to do so remains to be seen.
-
scaddenp at 16:23 PM on 24 July 2011Milankovitch Cycles
"Rapid" being 10x slower at least than current warming rates. -
Em at 15:48 PM on 24 July 2011China, From the Inside Out
The lifestyles of those AuStralians is pretty luxurious in comparison as well! -
Em at 15:44 PM on 24 July 2011China, From the Inside Out
I enjoyed the insight into the Chinese way of life. The demonisation of the Chinese in the current Carbon Tax debate has been quite ludicrous when you compare the lifestyle described in the article with that of most Autralians. In relation to the one-up-manship over who is allowed to comment on climate issues based on their personal carbon footprint; while it is pretty obvious that air travel in its current form is not carbon nuetral there is very little that is. I have read in the Guardian that use of the Internet produces 300m tonnes of CO2/yr, so maybe once we have stopped flying anywhere we should also then turn off our computers for ever more as well. And as possibly I don't use my computer as much as Pierre does, do I then get to have more authority to propound my views? My point is that I have no idea what steps Rob or Pierre take in their day to day life to cut or offset their carbon use, but it is possible that Rob has reduced his to a point where a yearly flight to China to maintain family contact can be justified. Is this not what we all have to do? Reduce our carbon footprint, but we can make the choice over what is neccessary to our lives and work our reductions on those that are not. -
Rob Honeycutt at 15:17 PM on 24 July 2011China, From the Inside Out
Agnostic... Definitely not trying to claim that all is well with China. There are clearly massive hurdles that face them. What encourages me is that they are actually doing things. They are taking things seriously while we in the west (yes, mostly the US) are trapped in political discord. My major point is that they are better positioning themselves to address the issue of carbon emissions. It more than ironical when I hear anyone complaining about China and what "they have to do" when we can't manage to do much anything at all. We (US again) are losing incredible opportunities to take action and move forward with every day that passes. China is moving forward every day.
Prev 1564 1565 1566 1567 1568 1569 1570 1571 1572 1573 1574 1575 1576 1577 1578 1579 Next


