


 Arguments


Recent Comments
Prev 1570 1571 1572 1573 1574 1575 1576 1577 1578 1579 1580 1581 1582 1583 1584 1585 Next
Comments 78851 to 78900:
-
DSL at 12:47 PM on 15 August 2011Murry Salby - Confused About The Carbon Cycle
Dale, I never stereotyped you. I responded to the odd logic of your comments and your quite deliberate word choice. I could go a bit further than DB's quite adequate reply, since it's one of my areas of study, but I won't. You've provided nothing resembling a defense of Salby. Your short initial comment was responded to by DM, and you've done nothing but hem-haw and dance around since. What do you think of Salby's work, Dale? Do you accept it? -
alan_marshall at 12:40 PM on 15 August 2011Soil Carbon in the Australian Political Debate (Part 1 of 2)
LazyTeenager @1 Mature forest is of course in equilibrium as far as the carbon cycle is concerned. It is important to preserve them as stores of carbon, but as you point out, sequestration only occurs in growing forests. In Australia, much of our eucalypt forest has been logged, so the secondary growth is a potential carbon sink. Eucalypts are fast growing, and include some of the tallest species of trees on Earth. So there is plenty of "upside". As far as the economics is concerned, my source is "The Cost-Effectiveness of Carbon Sequestration in Harvested and Unharvested Eucalyptus Plantations" by A. J. Richardson. On my website www.climatechangeanswers.org, I have published a cost comparison of carbon sequestration options. I have been a little more conservative than Richardson, estimating the cost of the unharvested eucalypt plantation option at $20 per tonne of CO2. That makes it cheaper than soil carbon, but the land cannot be used for other agricultural purposes. Your other point is also well made. It is estimated that between 70% and 90% of the carbon in crop residue is returned to the atmosphere within a few years, therefore involving minimal sequestration. That is why my post focuses on the gel-like humus, which degrades much more slowly, returning just 2% of stored carbon back to the atmosphere per year. (Forgive me, I am still searching for the scientific paper in which I recently read these figures.) Where land use switches to no-till practices, carbon levels will increase to a point where the fresh humus created each year is in equilibrium with that which is lost. -
muoncounter at 12:38 PM on 15 August 2011Trenberth on Tracking Earth’s energy: A key to climate variability and change
Doug#190: No one said anything of the kind; please try to read carefully. You, on the other hand, have denied the role of solar radiation in the energy balance of the earth. Good luck selling that! Now say goodbye for real. -
DougCotton at 12:31 PM on 15 August 2011Trenberth on Tracking Earth’s energy: A key to climate variability and change
( -Snip- )Response:[DB] Mr. Cotton, as you have previously stated that you wouldn't be back and then rescinded that offer, and have continued (despite able advice to the contrary) to avoid supporting your position with actual physics-based mechanisms with roots in the literature, and since you have expressed being away for 2 weeks on business anyway, it is time for a break.
I'll leave this up for a bit, then your SkS account posting privileges will be suspended until September. You may then resume participating here, but you will still be held to the mandate of basing your comments on scientifically supported basis' and also to "not make stuff up".
-
Dawei at 12:20 PM on 15 August 2011SkS Weekly Digest #11
Hah! I think that's the first toon I've seen that actually made me lol. -
adelady at 12:19 PM on 15 August 2011Trenberth on Tracking Earth’s energy: A key to climate variability and change
One more try. Doug, we've referred to Science of Doom a few times. This page is helpfully titled "Confusion over the basics". It refers to just one of the sections on back-radiation and several other nice expositions on various topics. I've been through most of these myself. You may be like me and sign up for the "skip the equations" club. It makes my life easier - but - it does mean that I'm obliged to take experts at their word on the content and meaning of those equations. (and sometimes just sit back and watch admiringly when they argue about arcane minutiae I've decided not to expend effort on myself.) Either way, you're in for a fair amount of reading. And if you really want to be fully involved in technical discussions, you're in for a lot of detailed note taking and serious brain work. -
muoncounter at 12:17 PM on 15 August 2011Trenberth on Tracking Earth’s energy: A key to climate variability and change
DC#187: "I carefully chose the words "for whatever reason."" Yes, and empty words they are. "Physics tells us " You are using no physics. You are making things up on the fly to suit your preconceived notions. Your analogies are bogus. In other lines of work, that would be called 'fraud' (but not here, because of the Comments Policy). -
DougCotton at 12:11 PM on 15 August 2011Trenberth on Tracking Earth’s energy: A key to climate variability and change
#179 Muon: (a) There is as yet no scientifically proven theory (out of at least half a dozen suggested by various scientists and academics) which explains the natural variations in climate which are part of the historic record. Hence I carefully chose the words "for whatever reason." (b) It is irrelevant what you or anyone calls what I call the "break out" temperature. It is derived by extrapolating the linear trend of the downward temperature gradient from the core to the surface, and so it is the intercept of that trend line at the surface. (c) Physics tells us that the rate of terrestrial heat flow is not what is important - yes it is slow, simply because the rate of conduction of rock and clay etc is slow. So too is the rate of conduction of the heat through the glass in the room. It doesn't matter. There has been plenty of time in the life of the Earth. (d) If you or anyone is trying to tell me that the heat in the oceans is going to affect the heat under the whole of the Earth's surface including the core, rather than vice versa (as Physics dictates) then you are not correct.Response:[DB] Mr. Cotton, I simply cannot tell if you are being intentionally obtuse and evasive or merely relying upon natural ability and giftedness.
In any event, you are completely and utterly wrong here. I suggest starting at square one and grabbing a physics textbook for starters. You are many years of study from being able to get a good handle on climate science.
-
DougCotton at 11:51 AM on 15 August 2011Trenberth on Tracking Earth’s energy: A key to climate variability and change
( -Snip- )Response:[DB] Please note my replies to you upthread in 180 and 184. Tom has already expressed his frustration in dealing with your disingenuousness.
Either follow the direction given or give it a rest.
-
scaddenp at 11:45 AM on 15 August 2011Trenberth on Tracking Earth’s energy: A key to climate variability and change
Sigh - so know we have argument from Personal Incredibility? You have been pointed to papers, articles, had question patiently explained but no, it appears you prefer ignorance to actually finding the answer. You can "suggest" whatever, but I will stick to strong mathematical theory, rigorously tested against empirical data thanks. -
Bern at 11:35 AM on 15 August 2011SkS Weekly Digest #11
newcrusader: that's what all the funding for 'skeptical' scientists is for. So long as there are 'climate scientists' who are preaching that global warming isn't happening, the deniers can point to that and say "but these experts said it wasn't happening!". As for the 'experts' themselves... well, it becomes difficult to prove criminal behaviour without any direct evidence that they knew they were wrong, as opposed to just being wrong, also that they knew their actions would result in significant damage or losses to others. Similarly, there is lots of circumstantial evidence that certain 'experts' were paid a lot of money to cast unsubstantiated doubt on claims that smoking causes cancer, but is it enough to stand up in a court of law? Then you need to have someone actually interested in prosecuting the case. Even if that happens, will they just hide behind the corporate veil, and have the company pay a fine while none of the individuals concerned actually suffer any direct consequences? That seems to be a common outcome - and, to me, is a key argument as to why corporations should not be classed as 'natural persons' legally - they don't share the risks that real people do, such as spending time in prison. Penalties are normally limited to fines, it takes something exceptional for the actual people within a corporation to be punished directly. -
DougCotton at 11:25 AM on 15 August 2011Trenberth on Tracking Earth’s energy: A key to climate variability and change
Tom: Re #181 Just briefly, then I must get on with business matters for 2 weeks: please read my #180 then note .. ( -Snip- )Response:[DB] Please note that posting comments here at SkS is a privilege, not a right. This privilege can and will be rescinded if the posting individual continues to treat adherence to the Comments Policy as optional, rather than the mandatory condition of participating in this online forum.
Moderating this site is a tiresome chore, particularly when commentators repeatedly submit offensive, off-topic posts or intentionally misleading comments and graphics or simply make things up. We really appreciate people's cooperation in abiding by the Comments Policy, which is largely responsible for the quality of this site.
Finally, please understand that moderation policies are not open for discussion. If you find yourself incapable of abiding by these common set of rules that everyone else observes, then a change of venues is in the offing.Please take the time to review the policy and ensure future comments are in full compliance with it. Thanks for your understanding and compliance in this matter, as no further warnings shall be given.
-
Bern at 11:18 AM on 15 August 2011OA not OK part 16: Omega
Hmm... if I've understood this correctly, does this mean that deep coral reefs will start to dissolve first? I have to admit, that's a novel idea for me - I had assumed that increasing atmospheric CO2 would mean surface reefs would be affected first, but I guess that's just not so! Could this undermine some old, 'tall' reefs, leading to some rather dramatic collapses as their foundations literally dissolve away? I imagine any other islands or other pieces of land with significant carbonate content will also have this problem. Could be interesting (in the Chinese proverbial sense). -
Tom Curtis at 11:12 AM on 15 August 2011Trenberth on Tracking Earth’s energy: A key to climate variability and change
"Remember that, according to 2008 NASA diagrams, 5% of total incident insolation is conducted to the atmosphere (not radiated) and then drifts upwards by convection. This may take months to get to the top of the troposphere, for example."
In fact it takes mere days for heat to get to the top of the atmosphere in its optically thick wavelengths by radiation, and mere hours by convection. Again Doug just makes things up with no attempt to check his assumptions against reliable sources. I do not find this game of wack-a-mole amusing. I participate in these threads to counter disinformation for the benefit of interested readers who have not made up their minds to believe anti-science rather than reality. If a denier comes along who just throws out falsehoods as fast as he can imagine them, I cannot keep up, and nor should I have to. We are frequently reminded that posting on Skeptical Science is a privilege, not a right. DougCotton is clearly intent on abusing that privilege. Can I suggest that in future his posts be simply deleted unless he backs every disputed or dubious claim with a reference to either a text book or the peer reviewed literature. For me it is a matter of both good manners and ethical necessity to take reasonable efforts to ensure that the information you provide is accurate (and to correct it when you discover it is not). I think that is a reasonable standard to expect of any poster on this site. I would go further. Anybody who does not accept the obligation to self fact-check shows by their actions that the truth of what they say is of no consequence to them. They value that truth at the same level as the effort they are prepared to expend to ensure that what they say is true, which in DougCotton's case is clearly no effort at all. At that point the question as to whether they are actively dishonest (ie, the knowingly tell untruths) or simply negligently dishonest (ie, they tell untruths because the cannot be bothered to make the effort of telling truths) is purely academic. They are enemies of truth regardless and have no place in public discourse. ( -Snip- )Response:[DB] A-step-too-far snipped.
-
adelady at 11:07 AM on 15 August 2011Trenberth on Tracking Earth’s energy: A key to climate variability and change
This thread may have been annoying and irritating. But. I will treasure forever "data is not a Rorschach test". -
Tom Curtis at 10:56 AM on 15 August 2011Trenberth on Tracking Earth’s energy: A key to climate variability and change
DougCotton @176, data is not a Rorchach Test for you to read in whatever your preferred theory. It carries distinctive information which tends to confirm some theories, and invalidates others. In this case, the observed OLR clearly invalidates any theory that does not acknowledge that CO2 in the atmosphere has a warming effect on the surface. In fact, the observed data is logically inconsistent with any theory that does not include a warming effect from CO2. In order to continue your rorschach approach to science, you focus on the size of the reduction in Outgoing Long wave Radiation as proof that the down welling long wave radiation must be small. It never occurs to you to look at the down welling long wave radiation itself, or to accept its measured values, and the global estimates derived from those measurements. Well, here is some actual data. Anybody committed to following the data rather than imposing their view regardless of the data will clearly see the down welling long wave radiation is very significant: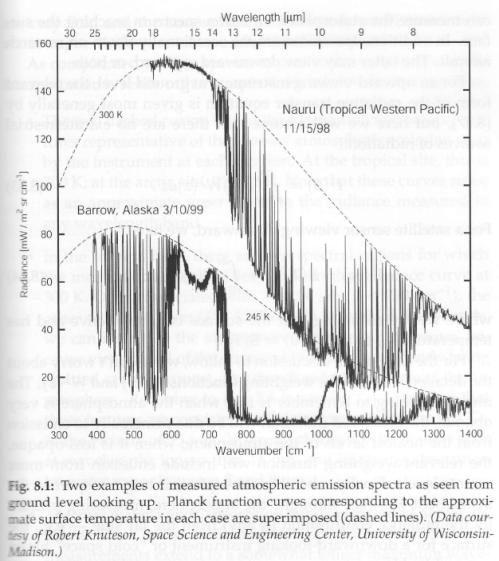

 As can be seen, the down welling long wave radiation is large, particularly in the tropics. In Darwin in winter (June), it still has a mean value of 372 W/m^2. In summer (January) that rises to 430 W/m^2.
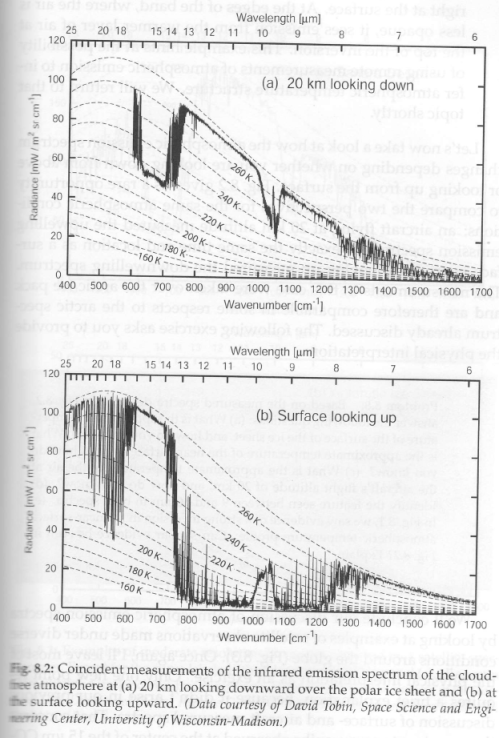
You want to ignore that fact because of the size of the CO2 notch. As can be seen from the following simultaneous spectrums over Barrow Island (in the Arctic) the size of the CO2 notch is not a reliable guide to the amount of back radiation, and certainly does not determine the quantity of that radiation. That you should think so suggests you are again employing your absurd single layer atmosphere model.
As can be seen, the down welling long wave radiation is large, particularly in the tropics. In Darwin in winter (June), it still has a mean value of 372 W/m^2. In summer (January) that rises to 430 W/m^2.
You want to ignore that fact because of the size of the CO2 notch. As can be seen from the following simultaneous spectrums over Barrow Island (in the Arctic) the size of the CO2 notch is not a reliable guide to the amount of back radiation, and certainly does not determine the quantity of that radiation. That you should think so suggests you are again employing your absurd single layer atmosphere model.
 And just to prevent a confusion before it starts, the back radiation has not effect on the long term energy balance, which is governed by the net Top of Atmosphere energy balance. If Back Radiation is high, that just results in more convection carrying heat away from the surface - if it is low, that is compensated for by less convection. In the end the TOA balance governs all.
-
DougCotton at 10:55 AM on 15 August 2011Trenberth on Tracking Earth’s energy: A key to climate variability and change
Just one more thing for you to think about for the next two weeks before I return... Note the conclusion of the quote in #167 about there being inadequate records of all the mentioned factors for climate models. This means that it is impossible to determine whether or not all radiation is escaping to space from empirical measurements of radiative flux, due to the inadequate information we currently have on other factors that could causes differences between incoming and outgoing radiation. I have put forward a sound physical argument (#176) as to why I believe all radiation is escaping. Remember that, according to 2008 NASA diagrams, 5% of total incident insolation is conducted to the atmosphere (not radiated) and then drifts upwards by convection. This may take months to get to the top of the troposphere, for example. The rate at which it does determines the temperature gradient of the atmosphere, not any supposed warming due to CO2 captures. You cannot produce any evidence that all radiation is not escaping, including that originating from the extra energy in any molecules which may have been warmed by CO2 captures. Carbon dioxide is but a small leaking dam at the foot of a mountain which can never cause the gradient of the creeks coming down to alter, and never cause a flood at the top.Response:[DB] "I have put forward a sound physical argument (#176) as to why I believe all radiation is escaping."
Umm, nope, not so much. You have spent many an electron detailing fanciful conjecture with no supportive physics. In short, you are spinning yarns. Fiction. As in "making things up".
This is a science forum wherein interested individuals discuss the science of climate and climate change. Please spend some time trying to learn enough of it to carry on some 2-way dialogue with other parties here.
Muoncounter asked you some excellent questions in number 172 above. I will hold you to answering them before this can go on to other things. As it stands right now, you are wasting others time due to a lack of interest in actually learning.
-
muoncounter at 10:52 AM on 15 August 2011Trenberth on Tracking Earth’s energy: A key to climate variability and change
adelady#178: "Check the definition" Mr. Cotton doesn't need definitions; he prefers making stuff up (break out temperature?) For the rest, we could start with the fact that geothermal forcing is much much less than radiative forcing (its on a prior thread). So his 'small glass in a room/drop in a hot coin' analogy is yet another case of not enough fact, too much hot air. "Vary naturally for whatever reasons"? And this is what we are supposed to believe is physics? -
keithpickering at 10:50 AM on 15 August 2011Blaming nature for the CO2 rise doesn't add up
Make it simple: Murray Salby is violating Conservation of Matter. His paper cannot possibly pass peer-review for that reason. -
adelady at 10:41 AM on 15 August 2011Trenberth on Tracking Earth’s energy: A key to climate variability and change
#177 "It certainly must have done so during ice ages for example." Doug! Check the definition of 'ice age'. I'll leave others to deal with the rest of this one. -
newcrusader at 10:21 AM on 15 August 2011SkS Weekly Digest #11
Funny Cartoon- sadly true. but those who are lying- the question in the future are they criminally going to be responsible? -
Daniel Bailey at 10:05 AM on 15 August 2011SkS Weekly Digest #11
Nice 'toon. I deal with reassured people every day. -
DougCotton at 09:55 AM on 15 August 2011Trenberth on Tracking Earth’s energy: A key to climate variability and change
Tom #173: Regarding your point on thermal inertia, let me start with an analogy which I will come back to at the end: Imagine a small glass of water in an air conditioned room. The water represents the oceans and the room represents the whole of the Earth beneath the surface. Leave the glass for a few hours and the water ends up at the same temperature as the room. Drop a hot coin in the glass (representing the warming by the sun that day) and it also cools down to a "base" temperature supported by the heat in the room. To warm everything you have to alter the air conditioner setting. Now, as we have seen in this Trenberth article, the heat above the crust is contained in (roughly) 90% ocean, 6% land, 4% atmosphere. Compared with all of this, the heat in the rest of the Earth below the surface (and below the floor of the oceans) is many orders of magnitude greater. What the atmosphere and oceans "see" is what I call the "break out" temperature at the surface (or floor of ocean) of the temperature gradient of the heat flow from the core. For example, German borehole data showed 270 deg.C at 9,000 metres with a linear trend down to about 12 deg.C at the surface. (I suggest it would be about 25 deg.C at the equator and well below freezing point at the poles. It is roughly the 4am temperature on a calm night.) I suggest that this "break out" temperature can vary naturally for whatever reasons. It certainly must have done so during ice ages for example. It is the "temperature in the room" in my example, and the natural causes affecting it are the air conditioner. The oceans, the land and the atmosphere are all controlled by it, just as is the temperature of the water in the glass and that of the coin. -
DSL at 09:55 AM on 15 August 2011Murry Salby - Confused About The Carbon Cycle
Dale, seriously. Do you not understand how the economic activity of just ten billion human beings over the course of the last century has significantly altered the biosphere, atmosphere, and geosphere? The published evidence would take days to sort through, but the observable evidence is all around. -
DSL at 09:47 AM on 15 August 2011Murry Salby - Confused About The Carbon Cycle
"The system is so complex that our understanding of how climate inter-relates is still really just scratching the surface." Not really, Dale. Atmospheric composition is well established. The physics of the components are well-established. Cyclical processes are well-understood. Long-term cycles are less well understood, but the range of possible basic mechanisms has been narrowed considerably. "To say that humans are 'almost entirely responsible' . . ." I believe the claim was that humans are responsible for the increase in CO2. Do you not find this to be likely with a very high level of confidence? If so, why not? " . . . for climate change is, IMO, a bit silly considering the power of nature to alter its own course," Yikes, talk about religion. If nature can alter its own course without recourse to its physical 'laws' then we can toss the entire project of science right now. This is why religion and science truly cannot co-exist, unless the deity/ies is/are constrained by their own initial laws. "and the fact we still really don't know how each part of the system inter-relates and feeds back on itself. To not acknowledge these facts is a form of denial itself." We have a very firm grip on this, Dale. Are you suggesting that we stop trying to learn more? Because if you're suggesting that 150 years of our best efforts have ended up fruitless, you truly have a lot to learn. Grab a textbook, dude. -
adelady at 09:33 AM on 15 August 2011Soil Carbon in the Australian Political Debate (Part 1 of 2)
LazyTeenager. If you look at the archeology of terra preta soils you'll see that if manures and other nutrients are combined with charcoal, the structure and carbon content can be retained for millennia. Without using charcoal or biochar, you may not get much more than a century or so. Seeing as farmers are committed to improving their soils on decade/generation timescales, this isn't much of a problem. They already spend bulk money on their current land management practices. It's really a matter of finding ways to make a different regime of land management maintain profitability. (Fertility is not the main issue because higher humus soils are almost automatically more fertile.) The central problem is that this issue has been ignored for such a long time. The research is likely to be playing catch-up (or leap-frog) with implementation for quite a while. The eternal issue in farms and forestry is continuation of good practice when land is sold. Every farming community has horror stories of how a 'beautiful' property was absolutely wrecked by a new owner (or the next generation) overgrazing or denuding vegetation or drying up a creek by their incompetent management. I think it will eventually become a bit like windfarms. A small annual payment for increasing and maintaining carbon values - by some agreed formula for measurement. That word 'agree' will likely ensure that the policy won't be easy or quick to implement. -
DougCotton at 09:28 AM on 15 August 2011Trenberth on Tracking Earth’s energy: A key to climate variability and change
In response to all: Please respect the fact that I am behind with business matters and, whilst I believe I can respond satisfactorarily to all points raised, posts on here are not the place because it will require much more detail. I will be adding a page about all this (you know where) in about two weeks time. In the meantime I shall address the key issue in the final paragraph of #165, because, unless anyone can show sound reasons (based on physics) that what I say there is incorrect, then my case stands. Here then is a more detailed explanation which needs to answer the question ... What happens to back radiation (which I have also called feedback) in particular that from CO2 when it strikes the solid surface? It creates heat which flows into the surface during the "warm-up" phase in the morning and maybe early afternoon. As the night approaches that heat can flow out at a similar rate to which it flowed in. Allowing for cloud cover, there are less than 12 hours of direct sunlight on average, so it has a reasonable, though not certain, probability of cooling off by about 4am (say) half way between summer and winter. In summer it may not cool off entirely, so heat builds up in that hemisphere, particularly in the oceans which hold about 90% of all heat (continents ~6%, atmosphere ~4%.) We know the local surf is warmer in summer. So, what comes in as CO2 frequency photons then becomes heat. Then that heat (along with the heat that came from direct sunlight) is radiated as the surface cools and that radiation contains many other IR frequencies (ie it is "full IR spectrum" near enough.) From the area of the notch in the chart Tom provided, we can see that only a small percentage is captured by CO2. And so, when the process repeats over and over, it rapidly approaches a limit where virtually all go to space. It makes little difference what size that notch is because it is still a small portion of the total area under the curve. -
Tom Curtis at 09:26 AM on 15 August 2011Murry Salby - Confused About The Carbon Cycle
Dale @18, "to preach", according to the Shorter Oxford English Dictionary, is to "pronounce a public discourse about sacred subjects", or "to utter an earnest exhortation, especially moral or religious". Consequently your claim that "preach" is not specifically religious is dubious, and to suggest that the IPCC "Summary for Policy Makers" or the various testimonies of scientists to Congress are preaching is an abuse of the word. It is also clearly suggests their evidence constitutes, at minimum, a moral exhortation rather that what it actually is, the presentation of scientific fact. -
muoncounter at 09:21 AM on 15 August 2011Murry Salby - Confused About The Carbon Cycle
Dale#18: "to preach is to urge or publicly proclaim" Cherrypick! The full definition your cut from (google dictionary): Publicly proclaim or teach (a religious message or belief) -- emphasis added This is not how science is communicated. -
Marcus at 09:19 AM on 15 August 2011Soil Carbon in the Australian Political Debate (Part 1 of 2)
I'm afraid that LazyTeenager is correct. Though Soil Sequestration in an option, certain people have massively overstated its benefits, usually as a means of overlooking the obvious-namely reduction of our use of fossil fuels! -
LazyTeenager at 09:19 AM on 15 August 2011Soil Carbon in the Australian Political Debate (Part 1 of 2)
One crazy idea I had was that soil carbon could be increased by forestry slow burns. As long as the temperature was not hot enough to oxidize the soil and the charcoal yield was high, the sequestration rate would be high and cumulative over time as the process was repeated. Charcoal of course is very resistant to oxidation when buried and so the sequestration time scales should be very long. -
Marcus at 09:14 AM on 15 August 2011Murry Salby - Confused About The Carbon Cycle
Dale, there are very few advocates of AGW who are of the view that climate change has *no* natural component. The problem is that all the recent, natural climate change factors-like Sunspots-should have resulted in a modest cooling, if anything, yet we're currently encountering the most rapid warming we've ever seen in the historical records. Yet we have people like Watts denying that its even happening! -
Dale at 09:10 AM on 15 August 2011Murry Salby - Confused About The Carbon Cycle
@Mod #16 The terms "preach" and "doctrine" do not specifically have religious definitions. To preach is to urge or publicly proclaim (which is exactly what the IPCC "Summary for Policy makers" does as well as scientists in front of Govt hearings), and a doctrine is a position in a branch of knowledge or belief. These terms fit very tightly with AGW, as the position of the branch of knowledge is proclaimed publicly through the urgings of scientists and the IPCC. Doctrine is also the term used for Govt agreements on an International level, which as far as I'm concerned what a lot of all this is about, how we deal with this at a global level. Also, Albatross wrote "The underlying foundation of the theory of AGW, is as the name suggests that we are almost entirely responsible for increasing CO2 (and other GHGs), so to deny that or not accept that is to be a denier of AGW." That humans alter the climate is no argument. That the Earth has warmed is no argument. The extent to which humans are responsible for the warming, IS the argument. The term "almost entirely responsible" is the real unknown in climate science. The system is so complex that our understanding of how climate inter-relates is still really just scratching the surface. To say that humans are "almost entirely responsible" for climate change is, IMO, a bit silly considering the power of nature to alter its own course, and the fact we still really don't know how each part of the system inter-relates and feeds back on itself. To not acknowledge these facts is a form of denial itself.Response:[DB] "the fact we still really don't know how each part of the system inter-relates and feeds back on itself"
When you say "we" you really mean "I". The people who've made a profession of studying climate science actually have a pretty good handle on all of the things you mention. That you characterize it as being (in large part) uncertain merely demonstrates that you haven't put much time and energy into its study.
Albatross, being a working scientist in the field, speaks from a point of strength of knowledge about the subject.
Per Dictionary.com:
preach
[preech]verb (used with object)1. to proclaim or make known by sermon (the gospel, good tidings, etc.).
2. to deliver (a sermon).3. to advocate or inculcate (religious or moral truth, right conduct, etc.) in speech or writing.verb (used without object)4. to deliver a sermon.5. to give earnest advice, as on religious or moral subjects or the like.6. to do this in an obtrusive or tedious way.noun1. a particular principle, position, or policy taught or advocated, as of a religion or government: Catholic doctrines; the Monroe Doctrine.2. something that is taught; teachings collectively: religious doctrine.3. a body or system of teachings relating to a particular subject: the doctrine of the Catholic Church. -
adelady at 09:01 AM on 15 August 2011Trenberth on Tracking Earth’s energy: A key to climate variability and change
Thanks Tom. I started by including some remarks about oceans, but I cut them out to keep my contribution short. (And I've not looked at Doug's site so I had to go on what I've seen here only. I'm not wonderfully well right now and I'm grumpy enough without deliberately seeking things out to worsen my temper.) And Doug. If you were not thrilled with RC 1978, you might do better with an overview like Spencer Weart's. Look through the Contents-Site Map here and you can choose topics that interest you. Follow the references as you come across them. And I heartily endorse the previous referrals to Science of Doom. Lots of good science, presented in digestible amounts. It's not as simple as reading a novel, but it's an excellent self-education resource. -
LazyTeenager at 08:53 AM on 15 August 2011Soil Carbon in the Australian Political Debate (Part 1 of 2)
The whole natural sequestration seems to me to be full of dubious propositions. Sequestration by forestry is one because as far as I can tell a mature forest should have respiration and photosynthesis in balance and therefore no sequestration can occur. The article of course emphasizes humus but I missed any figure for it's actual soil lifetime. A few years ago I buried a large amount of plant matter in the garden and within a year the soil had reverted to clay. I attributed this to the activity of worms. So I am guessing the lifetime of humus is 1 to 5 years. Therefore to maintain humus-based soil carbon would take constant I tensive soil management. i imagine you would get no increase in carbon past the first 1 to 5 years of management. Feel free to provide better figures. -
muoncounter at 08:12 AM on 15 August 2011One Confusedi Bastardi
Sphaerica#2: "Faux News has lots and lots of issues" Issues, yes. How about this headline for a 'review' of Spencer's recent Remote Sensing paper? New NASA Data Blow Gaping Hole in Global Warming Alarmism No bias there. Wereport, youdecide, you swallow it whole. But to illustrate the comprehension level of their audience, I overheard someone in a restaurant saying 'and there's new NASA data that proves CO2 doesn't cause the ozone hole!' -
scaddenp at 08:10 AM on 15 August 2011Trenberth on Tracking Earth’s energy: A key to climate variability and change
DC - Ramanathan & Coatley lay the foundations, and you need to understand these first. Since you have now switched to discussion of feedbacks associated with clouds etc., can we now assume that you accept that the greenhouse effect is real and that these climate scientists do actually understand radiative physics? Changing your website to reflect this would be nice. Discussion of feedbacks (ultimately a discussion about climate sensitivity) is a different proposition and should do that on an appropriate thread. -
muoncounter at 07:59 AM on 15 August 2011OA not OK part 14: Going down
Doug M#3: "denialists are over represented by geologists." I don't think rates of change are the root cause. Consider where many geologists find employment: oil, minerals, coal. Denial comes with that territory. If you want a high proportion of deniers, look at engineers -- especially those who claim to 'understand' thermodynamics. -
Doug Mackie at 07:36 AM on 15 August 2011OA not OK part 14: Going down
It is also my impression that denialists are over represented by geologists. This has been covered many times elsewhere but, briefly, I think the reason is that they are unable or unwilling to understand rates of change. Take the recent glaciations: CO2 changed by ~100 ppm, ranging between 180-280 ppm, with each transition taking 10,000-20,000 years. We have changed CO2 by over 100 ppm, from ~280-393 ppm, in 150 years. Life itself is in no danger – bacteria have run this planet for 21/2 billion years and will continue to run it whatever the Johnny-come-lately multicellular creatures do to the planet – but complex ecosystems cope very poorly with rapid change. One might imagine that because the divisions of geological history are marked by such change events then it would give geologists a head start in appreciating the likely effect of such change. -
DSL at 07:35 AM on 15 August 2011Murry Salby - Confused About The Carbon Cycle
Dale, a true skeptic weighs the evidence and develops an ongoing theory that takes into account as much evidence as possible and a solid physical model. A skeptic can only be on the fence because he/she has yet to work through all of the evidence--or if he/she has done so and has relatively solid reasons for riding a fence. If you have relatively solid reasons for riding the fence, I'd like to hear them. Every day I hope someone presents evidence that throws doubt on the seriousness of this problem. Your reasons, however, can't be "just because." They have to be worked through critically, and the scientific community is the best place to do that work. "preach"? Come now, let's not wander down that bizarre road. After all, if I decided to be a skeptic (or, rather, a so-called skeptic) about the sun rising tomorrow, and you defended the idea of the sun rising tomorrow, you'd be on the same ground as your imagined "preacher." The theory that predicts a rotating Earth and the short-term continued active sun is the best fit for the physics and observations. So too is the theory of AGW for recent warming. Hardly a religion. -
Dale at 06:59 AM on 15 August 2011Murry Salby - Confused About The Carbon Cycle
@Albatross If a "denier" does not accept the AGW argument, and an "advocate" preaches the AGW doctrine and does not accept any natural cause, and a "sceptic" is on-the-fence/unsure/undecided, then what do you call someone who accepts that humans can change the climate but not to the levels claimed? It IS possible to "deny" the mantra but not be a "denier".Response:[DB] Dale, denier in this context is being used for those who deny observable data and trends (indeed, to the point of saying blue is green and the sun orbits the Earth).
At this point, those who say that "this is what the science says" and back it up with links to peer-reviewed published literature are hardly preaching doctrine. That you phrase it in that context is revealing as to the ideology underlying your position. It is a false equivalency to say that in this scientific dialogue that there are "two sides", unless you mean one side that is backed by 200 years of science and physical observations and the other side which is basically saying "no it isn't" without anything to support their nay-saying.
In that regard and context, yes, they are deniers and denialists. QED.
Note further that the resident skeptics who regularly inhabit SkS are nowhere to be found on a thread like this and in the various ongoing discussions with Mr. Cotton; that would violate the "Skeptic's Code". Aargh.
-
Bob Lacatena at 06:55 AM on 15 August 2011One Confusedi Bastardi
As bad as Bastardi is, Fox News should be crucified. To have a "news" outlet that knowingly gives a platform for this cr@p is where the real problem lies. And yes, I know, Faux News has lots and lots of issues, and they rather pathetically cross the line for all of them. But to put on a discredited nonsensical weatherman, present him as an expert on global warming, then let him prattle on with what is utter and complete nonsense is just too much. Fox News needs to be crucified. -
Robert Murphy at 06:09 AM on 15 August 2011One Confusedi Bastardi
He also made up a phony "trend" for the Hadcrut data from 1996 to May 2011 on his WUWT post. He has the correct graph, but he drew a curved line that ends with an arrow pointing down, even though the actual trend for the 15 year period is a rise of .008C/yr, which comes to about .12C in warming over the period. His line is a fabrication. -
Camburn at 01:19 AM on 15 August 2011Global warming stopped in
1998,1995,2002,2007,2010, ????
I sea a game of ice hockey in the near future.... Sharpen your blades and repair the goal.Moderator Response: (DB) I hear spring training has lifeguards. Long term, will be an indoors-only pasttime. -
DSL at 01:12 AM on 15 August 2011Global warming stopped in
1998,1995,2002,2007,2010, ????
Sniff sniff . . . I smell a penguin BBQ. -
Tom Curtis at 01:02 AM on 15 August 2011Trenberth on Tracking Earth’s energy: A key to climate variability and change
Adelady @169, DougCotton appears to believe the that all the heat in the surface layers of the ocean can be dissipated in a matter of seconds, or minutes, so that the only think that preserves the warmth through the night is the feedback loop of back radiation re warming the surface after some heat is initially dissipated. In other words, he has no concept of thermal inertia. It is easily determined that it would take approximately 28 days without sunshine for the surface 100 meters to lose 1 degree C with a net upward flux of 160 Watts/m^2. The 160 W/m^2 is just the average net upward flux from the surface excluding solar radiation, while the 100 meters is an underestimate of the typical depth of the mixed layer, in which turbulence caused by winds keeps temperatures near constant with depth. That being the case, the temperature drop at night in the ocean is negligible, except at the very surface where the heat escapes to the atmosphere quicker than it can be replenished from below. As always, Science of Doom has an excellent post (in fact four) on the subject, and even developed a model of the diurnal temperature range in the ocean: And for some empirical results:
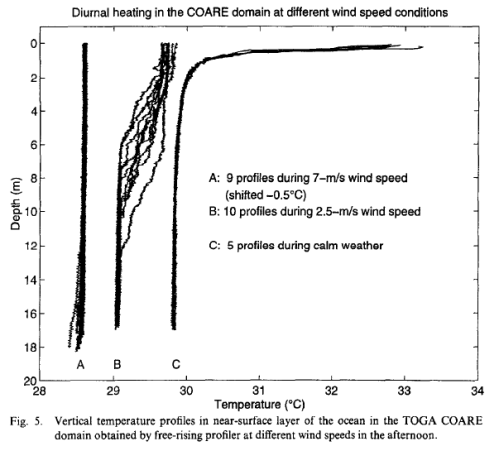 As you can see, even under calm conditions the top most layer only varies in temperature by about 3 degrees at most, for a 40 W/m^2 variation in the surface IR radiation at most. In other words, the up welling IR radiation from the surface is near constant over water, and the dissipating feedback loop imagined by DougCotton is simply unphysical.
Over land, there is substantially greater variation in temperature, but temperatures are normally kept within a narrow range for all that. Because of this, the up welling IR radiation, which is in fact black body radiation from the surface also persists through the night with only minor variation. This can be seen in actual measurements of the surface radiation, in this case over a banana plantation in Brazil:
As you can see, even under calm conditions the top most layer only varies in temperature by about 3 degrees at most, for a 40 W/m^2 variation in the surface IR radiation at most. In other words, the up welling IR radiation from the surface is near constant over water, and the dissipating feedback loop imagined by DougCotton is simply unphysical.
Over land, there is substantially greater variation in temperature, but temperatures are normally kept within a narrow range for all that. Because of this, the up welling IR radiation, which is in fact black body radiation from the surface also persists through the night with only minor variation. This can be seen in actual measurements of the surface radiation, in this case over a banana plantation in Brazil:
 The thing to note is the Net Radiation (Rn), ie, down welling solar radiation minus the up welling IR radiation. At night that becomes just - the up welling IR radiation, and as can be easily seen, it is near constant through the night.
Once again how Doug imagines things to be has no support either in theory or observation.
The thing to note is the Net Radiation (Rn), ie, down welling solar radiation minus the up welling IR radiation. At night that becomes just - the up welling IR radiation, and as can be easily seen, it is near constant through the night.
Once again how Doug imagines things to be has no support either in theory or observation.
-
Daniel Bailey at 00:58 AM on 15 August 2011Global warming stopped in
1998,1995,2002,2007,2010, ????
You know that stuff that ain't happenin'? Still ain't:
 [Source]
Shows over, folks. No warming here, nothing to see.
Response:
[Source]
Shows over, folks. No warming here, nothing to see.
Response:[DB] Fixed images.
-
muoncounter at 23:42 PM on 14 August 2011Trenberth on Tracking Earth’s energy: A key to climate variability and change
DougC: How about a new version of this? It's been such fun playing question time; it is now time for you to provide some answers that are substantiated and based on researched self-consistent science rather than your opinion. Following are questions based on several points in #165. Think of this as your homework assignment; don't come to school without doing it first -- and don't ask someone else to do it for you. 165 #1: In your model, conduction/diffusion 'prevails'. Yet you state there have been cooling periods; cooling requires a heat deficit. What causes this? Your answer must be detailed and not just 'natural cycles;' that's a cop-out of the uninformed. Hint: much is fully explained on other threads. Find them. Read. Learn. 165#2: Why does the surface warm during the day? What happened to the ability of your conduction/diffusion mechanism to 'prevail'? 165#3: Incorrect. Go find out why measuring radiation is not the same as measuring temperature. What have we learned (hint: a great deal) from such radiation curves? Hint: read TomC's excellent comments in this thread - again. 165#4: Incorrect. Go find out why it is the trend in temperature and heat gain that matters. What is that trend over the last 40 years? You state that O2 absorbs UV: Find out how much of the incoming solar energy is UV. Then see if UV even has a place in this discussion. What are 'feedback photons'? Please describe the conversion of heat to 'full spectrum IR.' Why does this 'conversion' only occur at the surface? Is there a difference between IR photons leaving the initially warmed surface vs. those leaving the surface after feedback? Please provide some substantiation that 'all can get out' by '4am'. Include in your answer a discussion of the significance of an increase in nighttime temperatures over a multi-year period. You conflate seasonal temperature variation with the multi-year warming trend. Why does the fact that it cools in the winter not have any significance in this discussion? If, as you've claimed, 'conduction will prevail,' why do we have seasons at all? Until you can answer some questions, in self-consistent detail, your understanding still has gaping holes (and you now know that it does). SkS is not a soapbox; this is a place to test your ideas and accept that others know this science better than you. Sphaerica gives excellent advice. I can add only this: Think about what you read. And more importantly, think about what you are going to say before you write it. Always ask yourself, 'is what I have to say really that new and important or might someone already have this figured out?' Try to avoid adding to the noise; add instead to the useful dialog. -
Bob Lacatena at 22:15 PM on 14 August 2011Trenberth on Tracking Earth’s energy: A key to climate variability and change
Doug, You have wandered through a trail of 100 posts now, hitting everything you can and being soundly refuted at every turn, and yet you keep finding new reasons to ignore what you are told or educating yourself beyond your ignorance. You continue in pursuit of more and more reasons to declare scientists wrong and ignore the problem. If this topic concerns you so much, you need to put more time into studying, and less into posting. When you study, you need to open your mind and learn, instead of starting with a desired outcome and trying to interpret everything in terms of that outcome. You need to recognize that you have a problem, a very serious bias towards arriving at a predetermined conclusion, and that bias keeps you from adequately learning the science. You need to recognize that the science is very, very, very complex. There is a lot to learn, and in a lot of different areas. You need to trust other people, and ask questions to learn instead of trying to score points or find weaknesses for the sake of later scoring points [And after 100 posts your score right now is zero, by the way]. In a nutshell, you need to become a skeptic. A skeptic doesn't believe anything, and refuses to commit until he is sure that he solidly understands and has no doubts. You are not a skeptic. You believe a lot of things, like in the magic of ENSO, which is really nothing more than a global game of oceanic peekaboo. You may actually be on to something in thinking of it as the globe's pressure valve, but if so, it is one that is inadequate to counter the forces that are building beneath it. But this is good evidence of your own approach. When you find a concept you like, you accept it with extreme prejudice and without hesitation, even when you do not have enough facts to quantify the effect enough to justify your own position, and in fact when all evidence points away from your desired conclusion. You also refuse to believe in a lot of things, like the complex and irrefutable physics behind the greenhouse effect. You also, clearly, are not trying to learn everything you can, but rather only those things that you hope will support the result that you'd like to believe is true. Please become a skeptic. Please. Beyond that, this thread has grown extremely tiresome and has wandered way, way off topic. I'm amazed at the patience that all of the (well educated) SkS regulars have shown you here. A large number of people have gone to great lengths to help you, in a carefully reasoned tone that your own hubris and attitude does not mirror. It's time for you to do some serious studying, and to avoid nuthouses like WUWT in the process. Go learn the science. This site is a good place to start, but certainly shouldn't be your only resource. It's actually better as a place to figure out what else you need to learn (in my opinion). But look around, follow tangents, and educate yourself. Until then, you are just confused and passing your confusion to others. The world needs skeptics with the energy to educate themselves, not ignorant ideologues with the energy to broadcast their hoped for assumptions. -
MarkR at 20:27 PM on 14 August 2011Blaming nature for the CO2 rise doesn't add up
15 owl: and that's not all. Why is the ocean acidifying? Is ocean chemistry also wrong? What about CO2 fertilisation? It reminds me of something John published a while back: scientists are saying that if it walks like a duck and quacks like a duck, it's probably a duck. Bastardi is saying that not only is something that isn't a duck walking/quacking like a duck, but someone has hidden the real duck... Or perhaps maths or chemistry are wrong.
Prev 1570 1571 1572 1573 1574 1575 1576 1577 1578 1579 1580 1581 1582 1583 1584 1585 Next


