


 Arguments


Recent Comments
Prev 1570 1571 1572 1573 1574 1575 1576 1577 1578 1579 1580 1581 1582 1583 1584 1585 Next
Comments 78851 to 78900:
-
Steve Brown at 07:35 AM on 10 August 2011The Last Interglacial Part Three - Melting Ice and Rising Seas
Paul - The Kopp et al paper I link to estimates a rate of 5-9 mm per year. muoncounter - you are totally correct if considering just stationary ocean surface topography. Local sea-level can temporarily be much greater than 2 m on a regional basis once you factor in waves and tides. -
scaddenp at 07:35 AM on 10 August 2011Where have all the people gone?
I would have to say that I also share Tom's skepticism over extreme rates of sea level rise. While this is attention-grabbing, I dont think it is supported well by science so far. Even with much higher temperatures, its hard to put much credence on projected sea level rise rates that are higher than peak rate for ice sheet collapse at the last glacial termination. On that basis, I doubt that sea level would be higher than 1m by 2100. While this doesnt have dramatic impact, it should be noted that 0.5m sealevel rise by 2100 is no laughing matter either (see the Stern report), especially for those places already having problems with coastal erosion and salt incursion. The great deltas in particular have a very delicate balance between sediment load and sealevel rise controlling dynamics.Response:[DB] Please note that I at no point (AFAIK) constructed any sort of time frame or amounts of SLR into this post. Or at least into the intro piece.
The intro was meant as a retrospective look at the changes that could took place at some future point in time, looking backwards from that time. It serves(d) as an attention-getting device intended to spur dialogue.
And yes, I was strongly influenced in this by The Road Warrior, The LOTR:FOTR and Earth Abides (by George R.R. Martin George R. Stewart). Stories that will always live in my memories.

-
scaddenp at 07:23 AM on 10 August 2011Climate Denial Video #2: Failed at Science? Attack the Scientists
I think we need a post on Postma. Chris? Doug, any new theory needs to perform at least as well as what it replaces. To start with, it needs to be able make testable predictions. I would like to see how your new theory goes in predicting the lapse rate for Earth, Mars and Venus for a start... -
Bob Lacatena at 06:59 AM on 10 August 2011There is no consensus
374, Eric the Red, If you are getting your numbers from Pidwirny's article on energy balance of the earth where this diagram is just a revision of Trenberth's, substituting percentages for W/m2, then I'm afraid you are reading it incorrectly. In any event your numbers are incomplete. You are only accounting for incoming radiation (340) and not the greenhouse effect (which adds additional energy to the surface that must be accounted for). Either way, how does this in any way support your original contention that "scientists are placing too much emphasis on outgoing radiation effects in the atmosphere as opposed to convection"? Or are you openly withdrawing that comment? -
muoncounter at 06:57 AM on 10 August 2011The Last Interglacial Part Three - Melting Ice and Rising Seas
Minor point: "global sea-level is not the same everywhere and can vary by many metres from region to region" I thought measured ocean surface topography was on the order of 2 meters; most would say that 2 < many. Do the more recent data show more topography than this older satellite?
-
Paul Magnus at 06:44 AM on 10 August 2011The Last Interglacial Part Three - Melting Ice and Rising Seas
How rapid was that SL fall? How rapid can the SL fall? -
John Hartz at 06:44 AM on 10 August 2011Climate Denial Video #1: The Difference between Skepticism and Denial
Bern @62: I actually like hearing Aussies speak in their native tongue. The background music on all of the TH videos was way too loud though. -
Paul Magnus at 06:42 AM on 10 August 2011The Last Interglacial Part Three - Melting Ice and Rising Seas
Excellent posting! Expected rate of SLR? -
adiffer at 06:40 AM on 10 August 2011The Ridley Riddle Part Two: The White Queen
Indeed. It might be worth crafting analogies like this for all the other specious arguments. 8) -
Eric the Red at 06:21 AM on 10 August 2011There is no consensus
Michael Pidwirney of NASA has some different values: Incoming radiation: 340 W/m2 Reflected: 99 W/m2 Absorbed by Atmosphere: 78 W/m2 Absorbed by Surfase: 163 W/m2 Of that absorbed by the surface, his ebergy transfer numbers are: Thermal radiation: 61 W/m2 Convection: 17 W/m2 Evaporation: 85 W/m2 You can stop waving your hands now. -
adiffer at 06:16 AM on 10 August 2011The Ridley Riddle Part One: The Red Queen
People who get too locked up in a left/right description of politics miss out on some of the finer distinctions. For example, there is a group of classical liberals in the US that view the modern liberals as anti-liberal. These classical types are somewhat similar to the older definition of liberal here but have learned a lesson with respect to laissez-faire and the blind trust they used to have in the markets. There is no simple name or party affiliation for the classical liberals, but people do mistake them for libertarians or conservatives now and then. I read Ridley's book a while ago. It was the first one to make me look at the various components of climate projections. One can be skeptical or believing in some components and then switch sides for others. We've been inventing labels for each other to deal with these variations. 8) I can't bring myself to view economics as science. When I am at my most skeptical it is with the economic projections necessary for the climate models. I think the science is good, but I'm learning economics now so I can make a decision based on more than blind trust. The economics academics don't agree on some pretty fundamental stuff and their track record isn't pretty, so the learning experience for me has been a fun one. -
jeff_from_ky at 05:02 AM on 10 August 2011Where have all the people gone?
A couple of other SF books with climate change themes: Mother of Storms - John Barnes Heavy Weather - Bruce Sterling -
jeff_from_ky at 04:55 AM on 10 August 2011Where have all the people gone?
muoncounter #19 Actually, Asimov wrote the short story Nightfall in 1941. 1990 was the novelization by Robert Silverberg. -
michael sweet at 04:00 AM on 10 August 2011Where have all the people gone?
Tom, While much of Miami's waterfront will still be above sea level with a one meter sea level rise, where will they get their water from? Currently they have well fields on the back side of town where they obain water for drinking. Those are located only 3 feet above sea level. If sea level was to rise even 0.8 meters, a small storm surge (or none at all) would innundate the well fields and they would have no source of water. Miami is a special case that grabs the attention of Americans (like me). A better question is what to do with the 17% of Bangladesh that would be innundated by a 1 meter sea level rise. (I noticed that APiratelooksat50 did not mention Bangladesh recently when he listed countries affected by sea level rise, you can make any claims if you ignore the evidence). Millions of subsistance farmers live there. Current increases of sea level have made farmers switch from rice to shrimp. All the arable land nearby is already farmed. Where will they go? Your reference to the World Climate Research Program sea level rise workshop appears dated to me. Much has been learned about sea level rise in the past 2 or 3 years. I note that their graph shows measured sea level rise at or above the maximium they estimate will occur. It will be interesting to see what the next IPCC report says about sea level rise. -
Dikran Marsupial at 03:53 AM on 10 August 2011Where have all the people gone?
Drowned world by J.G. Ballard? Can't remember what the cause of the warming/sea level rise was, but it was published in 1962. Found it a rather dissapointing read though :-( -
muoncounter at 03:44 AM on 10 August 2011Where have all the people gone?
Read Asimov's 'Nightfall.' A highly developed planet with multiple suns and therefore continual daylight; every 2000 years or so, an eclipse causes total darkness. Scientists try to warn the population prior to the eclipse, but a quasi-religious cult interferes. Bad results. All that, written in 1990. -
DSL at 03:31 AM on 10 August 2011Where have all the people gone?
It might be interesting to have an article on climate change in fiction. It's one thing to get the models; it's another to develop a comprehensive narrative of the future from a human perspective. There is the established genre of eco-fiction, but I'm thinking specifically of recent stuff incorporating global warming (e.g. Kim Stanley Robinson). I simply don't have the time right now to do a thorough piece, though I suppose it could wait. I find it interesting that George R.R. Martin's Song of Ice and Fire fantasy series features background tension stemming from the idea that "winter is coming." -
Bob Lacatena at 03:12 AM on 10 August 2011Where have all the people gone?
16, Tom Curtis, Might it not be more correct to measure sea level rise in terms of "per degree Celsius" instead of per year, given that the current rate of temperature change will quickly outstrip that of the past? The 120m sea level rise since the last glacial goes with a roughly 20˚C temperature change in Greenland, but spread over several thousand years such that warming in Greenland appears to have been at best 1˚C per century. Using (probably unrealistically) simplistic, linear projection this implies that another 10˚C temperature change within 100 years could amount to a total sea level rise of 60m (although the annual rate of actual sea level change in response to such rate of warming could be open to argument). Now, admittedly, this is an apples and oranges comparison, because the amount of water locked up in ice, and the configuration by latitude and on land and water is drastically different. But by the same token, this makes an effort to predict sea level rise by year (instead of by degrees C) similarly difficult to do based purely on past sea level rise. I think the situations are just too dramatically different to take too far, but I take no solace in a 20˚C Greenland temperature rise yielding a 120m sea level rise, no matter what the time frame. -
Bob Lacatena at 02:43 AM on 10 August 2011Climate Denial Video #2: Failed at Science? Attack the Scientists
We should go a step further... there should be an MSM Hall of Shame cataloging the utterly ridiculous attempts of some to fabricate and promote their own personal Galilean redefinition of the science (co2isnotevil, Postma, etc.). It's really become a rather entertaining recurring theme. That it happens over and over is what is most amusing. -
muoncounter at 01:36 AM on 10 August 2011Climate Denial Video #2: Failed at Science? Attack the Scientists
A commenter at tamino's offered the phrase 'multiple simultaneous misconceptions;' I propose that we adopt this as the new definition of MSM. The result of too much MSM is 'a strong defense against understanding reality.' That's pure poetry. -
chuckbot at 01:31 AM on 10 August 2011Citizen Science: Climatology for Everyone
One thing I haven't seen much discussion of but could easily be monitored is fungi; they might be worth watching for patterns in precipitation/temperature/etc. I know that Chapel Hill NC tended to get a long rainy spell early each summer, after which mushrooms would flourish in the woods. It seems like microenvironmental effects would play a larger role for fungi than for plants and animals, but careful observation, establishing control plots, GPS/GISS technology etc. could help keep account of these factors. Additionally, there are lots of mycological enthusiasts and clubs who would likely be interested in participating. Does anyone know about such a program? If not, I would like to organize one - anyone know any resources or protips? -
Bob Lacatena at 00:42 AM on 10 August 2011Climate Denial Video #2: Failed at Science? Attack the Scientists
22, Tom Curtis, Agreed. Let him be hoist by his own petard. He has Poe'd his way into a shining example of expert denial at work. -
Tom Curtis at 00:39 AM on 10 August 2011Climate Denial Video #2: Failed at Science? Attack the Scientists
Sphaerica @21, probably, but perhaps those visitors will now know to ask him why he is ignoring (and in fact contradicting) 250,000 data records gathered at a global network of 1600 stations as of 2006. And why they should place such store in the authority of his BSc (Physics) which he places such store in, while ignoring the hundreds of PhD (Physics) scientists who let data, not their credentials do the talking, and whom he contradicts without evidence. -
Bob Lacatena at 23:59 PM on 9 August 2011Climate Denial Video #2: Failed at Science? Attack the Scientists
19, 20, Dikran, Tom, Looks to me like "Doug" was a drive by troll, just trying to draw visitors to his amazingly informative site. -
Bob Lacatena at 23:44 PM on 9 August 2011There is no consensus
370, Eric the Red,...it does show how some scientists are placing to much emphasis on outgoing radiation effects in the atmosphere as opposed to convection.
Evidence, please. This is mere assertion. At the same time, please reference Trenberth's energy budget, which is a careful accounting of exactly how energy is transferred, backed by actual measurements. Coming down: 517 W/m2. Going up (in W/m2)...
Total: 517 Everything balances as measured (in/out/retained). Gee, whiz, those dang scientists really do know what they are talking about... precisely, and without simple assertions and hand waving.Radiation: 396 Convection (thermals): 17 Evapotranspiration: 80 Reflection: 23 Retained: 1 -
Tom Curtis at 23:32 PM on 9 August 2011Climate Denial Video #2: Failed at Science? Attack the Scientists
DougCotton, I am also waiting your proof as asked for by Sphaerica. Having read your site, it appears to me that you are basing your opinions on simple assertion. What is worse, you claim without reference that the IPCC "assumes" things which are actually based on large archives of measured data, such as the Global Energy Balance Archive: The IPCC's "assumptions" are such that they can demonstrate this sort of fit between model and experiment:
 In contrast your level of understanding is such that you make the false (and simplistic) assumption of a single layer atmosphere in order to criticize the results reported by the IPCC.
So, to Sphaerica's question, I add my own. Which text book on atmospheric physics did you read before you set out to demolish an entire branch of physics by waving your hand near a pot? Because from your web site, the answer appears to be none.
In contrast your level of understanding is such that you make the false (and simplistic) assumption of a single layer atmosphere in order to criticize the results reported by the IPCC.
So, to Sphaerica's question, I add my own. Which text book on atmospheric physics did you read before you set out to demolish an entire branch of physics by waving your hand near a pot? Because from your web site, the answer appears to be none.
-
Bern at 23:21 PM on 9 August 2011Climate Denial Video #4: The favourite weapon of deniers, cherry picking
Stevo: "enough evidence has been found to leave 97 out of every 100 climate sceintists in no doubt" That's what scientific consensus is. The problem is that people conflate scientific consensus with everyday consensus, which usually consists of a group having an informal chat about a topic, followed by someone (usually the boss!) proposing a course of action with nobody objecting. Basically, the denier argument against consensus is based around a mistaken idea of what scientific consensus is, and what that consensus represents. Like many denier arguments, it's not based in reality. I like the term "consensus of evidence" that is used here at SkS as well. It's far more convincing, as it takes the human element out of the picture. -
Tom Curtis at 23:06 PM on 9 August 2011There is no consensus
Eric the Red @370, which scientists are "...placing to much emphasis on outgoing radiation effects in the atmosphere as opposed to convection"? It is certainly not the mainstream climate scientists. The importance of convection as a distributor of heat has been central to the theory of the greenhouse effect since Manabe and Wetherald 1967, and is a central feature of GCMs. -
Bern at 23:04 PM on 9 August 2011Climate Denial Video #1: The Difference between Skepticism and Denial
Badgersouth @ 60: perhaps John deliberately chose to not fake an American accent, in order to remind Americans that there's an entire world outside the borders of the US of A? ;-) (although I have to admit to great amusement when asked, in Ohio, whether I was Canadian... I may not have the broadest Aussie accent, but it's definitely *not* Canadian!) Actually, I think it's more likely he just didn't even think of it. Some of us are so used to hearing such a wide variety of accents (e.g. I work with people from Scotland, South Africa, New Zealand, India, Germany, Serbia, the US, and the UK, and I live in a suburb with a high Chinese population), that it doesn't occur to us to change our accent for different audiences. That kind of message-tailoring is more the realm of marketing folks... -
Dikran Marsupial at 22:57 PM on 9 August 2011Climate Denial Video #2: Failed at Science? Attack the Scientists
DougCotton: Scientists need to be self-skeptical; a good scientist would view it as their own task to find the weak points in their own arguments (it is part of research). When they think they have adequately addressed all of the shortcomings of their work, and what remains is still of interest, they then write a paper explaining their theory/findings and submit it to an appropriate journal. The journal will then send it out to several experts in climatology who would submit reports detailing the shortcomings of the paper and suggestions by which it could be improved. Now if you had some confidence in your theory, that is what you would do, rather than calling out a science blog to do your basic research for you. If you dropped the hubristic attitude you might do rather better in encouraging people to discuss your theory; as it is your tone does not suggest that you are at all open to inconvenient truths. -
Tom Curtis at 22:52 PM on 9 August 2011Where have all the people gone?
Agnostic @11, I am curious as to who that economist is. As you know, I am far more skeptical of the threat from sea level rise than most regular commentators here at SkS (excluding deniers). I base that skepticism both on a reasonable trust of the experts, and a belief that the past is the guide to the future. The opinion of the sea level experts (of whom Hansen is not one) can fairly be taken to be represented by that expressed by the World Climate Research Program sea level rise workshop. There estimate for end of century sea level rise including the melting of glaciers and ice sheets is for a rise between 0.6 and 0.8 meters:
 Placed in the perspective of Brisbane, that equates to a change of peak King tides from a minor to a moderate flood level, still a meter lower than the flood experienced in January of this year. Although coastal suburbs would be impacted more, that still means less than 10% of the land area of Brisbane would become untenable for commercial use or inhabitation, assuming no counter measures in the form of sea walls and levees. The cost of that would be approximately to increase the normal cost of construction in replacing aging buildings by 40%, a minor cost against the normal economic life of the city. Sydney would be effected even less by such a rise. Arguably other cities would be effected more. Indeed, I would be surprised if they did not. But purportedly one of the most vulnerable would be Miami, and even there the impact of a 0.8 meter sea rise would be relatively minor as shown by this image of Miami with a 1.25 meter sea level rise (or the impact of a 0.45 meter storm surge with a 0.8 meter sea level rise):
  Much as I enjoyed Daniel's fiction, I think we can safely say Miami will not be below anybody's keel in the next one hundred years. Turning to the past as the guide for the future, it strikes me that during the approximately 140 meter rise in sea levels since the last glacial maximum, sea levels rose at "...an average rate of about 10 mm yr-1 (1 m per century), and with peak rates of about 40 mm yr-1 4 m per century), until about 7,000 years ago" (Church et al, 2008). That one meter per century average pace represents a useful best estimate of the likely rate of sea level rise for a four degree temperature differential between initial and equilibrium temperatures, and hence for peak sea level rise at the end of this century. Going from 0.3 meters per century now to 1 meter per century at the end of the century leaves an average increase over the century of around 0.6 meters.
 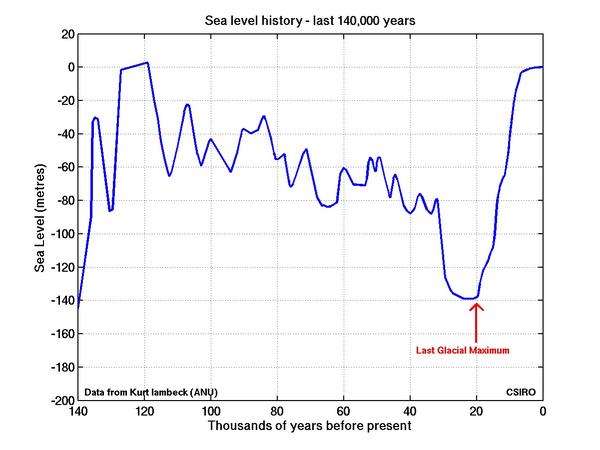 Even in the unlikely event that sea level rises match those before the Eemian, when over a 2.5 thousand year interval, sea levels rose at approximately, 3.5 meters per century, because of the slow rises in the first part of the 21st century, whole century averages are likely to be closer to 1 meter than to 2. So, while I fully expect sea level rises of up to 8 meters in the long run, and up to 20 if, with just a bit of bad luck, we trigger a tipping point, I do not expect sea level rises to be the major climate change story of the 21st century. Compared to the impacts of ecosystem loss, ocean acidification, extreme weather, and extreme heat, the impacts of sea level rises will appear almost inconsequential, although a significant (not crippling) economic burden in their own right.
 -
muoncounter at 22:36 PM on 9 August 2011There is no consensus
EtR#370: "gravitational warmth theory" We heard that one over and over on the 2nd Law threads; its all due to the potential energy released by air molecules falling from the upper atmosphere. That does not rise to the level of 'theory'; call it an idea, a notion, a delusion. "some people like his hand waving over the cooking pot," It's easier than doing actual research. Fewer annoying things like 'data' to worry about. -
Bern at 22:34 PM on 9 August 2011Where have all the people gone?
Eric: hmm, I thought the current rate was more like 3.2mm/yr. But the answer to your question is: non-linear ice-sheet dynamics. There are signs that Greenland & the WAIS are beginning to destabilise. Based on that, and paleoclimate data from previous interglacials, it seems the question is now "how long will it take" rather than "will it happen". -
Bob Lacatena at 22:32 PM on 9 August 2011Climate Denial Video #2: Failed at Science? Attack the Scientists
13, DougCotton,I'm waiting for your proof...
No, Doug. Please lower your hubris dial just a few notches. All of science says that you are wrong. Therefore, it falls to you to prove your position, not vice versa. No one owes you squat, particularly when your statements are (a) totally incredible and (b) totally unsupported by evidence. -
Bob Lacatena at 22:30 PM on 9 August 2011Climate Denial Video #2: Failed at Science? Attack the Scientists
13, DougCotton, You should also recognize that the earth/atmosphere interface is probably the most trivial component in the system. What about the other miles upon miles of atmosphere, where the real action takes place? Where does your personally defined and branded science fit in there? -
Bob Lacatena at 22:29 PM on 9 August 2011Climate Denial Video #2: Failed at Science? Attack the Scientists
13, DougCotton,...heat transfer from solids to gases in equilibrium is (as IPCC claimed) mostly by radiation rather than (as science says) by diffusion (like conduction)...
Citation, please. Prove this point instead of just declaring it. Science says? Please. It does not. If you think it does, you should have no trouble providing a clear reference stating this position. -
Bob Lacatena at 22:26 PM on 9 August 2011Climate Denial Video #2: Failed at Science? Attack the Scientists
13, DougCotton, Your personal interpretation of physics is just so much hand waving. You provide no calculations or observations to prove your position (that more heat transfer must occur by conduction rather than radiation in the atmosphere), which is a flat-out laughable fabrication. You simply wave your hands amidst a gish gallop of physics terms and concepts, and then expect everyone to believe that you are right and the rest of science is wrong. You, Postma, and a host of others are really just out-doing yourselves with your ability to reinterpret science to arrive at a different conclusion from the rest of the world. That you can do it with such intense complexity is a demonstration of the incredible breadth of the human mind. [In the 1980s there was a homeless woman from Korea living in Newark, NJ. She was actually fairly far along in building an ark, on which she was going to return to her native land. Among other things, she had plans for laser cannons for defense at sea. It was really an impressive feat.] It's also comical when you make the IPCC out to be this single-minded nefarious entity against which to launch your assault. Hint: All the IPCC does is to collect and summarize studies and information accumulated by thousands of other scientists, and when you attack the IPCC you are attacking pretty much nothing. -
Eric the Red at 22:25 PM on 9 August 2011Where have all the people gone?
Agnostic, What do you feel will change in the next 40 years to create 1m of SLR? That is a large leap from todays 2-2.5 mm/yr. -
muoncounter at 22:22 PM on 9 August 2011Where have all the people gone?
Bern#7: Look at the 'bright side': Suppose Bachmann (and no doubt some other of her extremists) has her way and EPA is dismantled. Within a few years of burning high sulphur coal and letting the soot fly, our air will be brown again - just like it was before the EPA could regulate pollutants. Higher albedo, global warming problem solved. Chris G#8: Especially when storm clouds are gathering and it looks like a hard rain's gonna fall. -
DougCotton at 22:17 PM on 9 August 2011Climate Denial Video #2: Failed at Science? Attack the Scientists
typo: "unless you can prove ... " PS Try the simple lamp cover experiment near the top of my site. Or, if you're not sure about conduction, try holding an iron rod in a furnace all day. You're going to get your fingers burnt one way or another sooner or later. Also explain how (supposed) radiation just happens to get the temperature right - ie about the same on a calm night as the underground temperature. Is it just a fluke??? Too bad if the humidity trebles from 30% to 90%. If the radiation is busy warming the air molecules (somehow) where is all the energy to send all those photons back down again - almost as many as the IPCC said went up - many more than the sun itself sunk into the surface. http://earth-climate.com/IPCCdiag.com -
CBDunkerson at 22:10 PM on 9 August 2011Where have all the people gone?
Uh oh. Based on the maps above, a 1 meter sea level rise would make the office building where I work part of the Atlantic Ocean. Is it bad to find oneself looking forward to some of global warming's impacts? :] -
DougCotton at 22:09 PM on 9 August 2011Climate Denial Video #2: Failed at Science? Attack the Scientists
Dear John Cook - see my other post or just read http://earth-climate.com I'm waiting for your proof, against what experimemts indicate, what Wikipedia says about "Heat Transfer" and what quantum physics elegantly shows, namely that heat transfer from solids to gases in equilibrium is (as IPCC claimed) mostly by radiation rather than (as science says) by diffusion (like conduction) because, unless you an prove something contrary to accepted peer-reviewed physics and empirical evidence, my site explains why greenhouse warming theory falls apart. Doug Cotton B.Sc.(Physics) ... Manager, Climate Research Centre -
Eric the Red at 21:37 PM on 9 August 2011There is no consensus
The gravitational warmth theory seems to be making the rounds these days. The idea that the Earth would heat itself through gravity in the absense of the sun boggles the mind. Especially after going to great lengths to show how the incoming solar radiation has fluctuated throuhgout history. While some people like his hand waving over the cooking pot, it does show how some scientists are placing to much emphasis on outgoing radiation effects in the atmosphere as opposed to convection. Of course, this is due to the much larger difficulty in measuring the convection effects. -
CBDunkerson at 21:18 PM on 9 August 2011There is no consensus
Tom wrote: "In contrast, Cotton's alternative estimate was made by waving his hand near a cooking pot." LOL! That's taking 'hand waving' arguments to a whole new level. :] -
Riduna at 18:16 PM on 9 August 2011Where have all the people gone?
Odd that most climate scientists seem to be of the view that SLR will be less than 1m by 2100. There are of course exceptions such as Dr Hansen who predict possible decadal doubling of polar ice mass loss producing catastrophic SLR during the last 30 years of this century. I think this minority will be proven right and, on current trends, SLR of 1m is likely to result by 2050. By 2050, global population of ~10 billion is predicted. At least 1 billion will be directly impacted by SLR flooding and a further 5 billion affected by scarcity of life essentials, property losses and economic collapse. But not to worry, we are assured by at least one supposedly informed economists commenting on SkS posts, that humans are resilient and will learn to live with and adapt to SLR. Some may. Billions will not. -
scaddenp at 17:56 PM on 9 August 2011There is no consensus
Well, I had to read it carefully to make sure this guy was serious and not a Poe. So many unphysical things, so little time. You might like to look also at Greenhouse theory violates 2nd Law thread too. Unfortunately, there are a great many "papers" like this around. Appinsys and icecap.us are full of them (often mutually contradictory). The question is ask is "has it been published in a peer-reviewed journal?" (and E&E doesnt count). There is a Nobel prize waiting for someone who can get humanity off the global warming hook. I'd cheer them all the way, but Cotton isn't the man. -
scaddenp at 17:42 PM on 9 August 2011More Carbon Dioxide is not necessarily good for plants.
I fail to see the relevance of massive demonstrations about management of Czech republic forests - all that I am suggesting is that if you have differently managed forests, then you can test the hypothesis. Canada is colder so other factors at work. There is no end to good theories and this might be one, but without supporting data, its just an hypothesis. -
adelady at 17:32 PM on 9 August 2011More Carbon Dioxide is not necessarily good for plants.
Camburn, your example of Kochia and its adaptability is unfortunate. This is a classic case of the kinds of problems that will be exacerbated by climate shifts. Kochia is a declared pest plant in WA because, among other things, it is "Notorious for its large size (shading developing crop plants) and its ability to spread fast. Is resistant to insect attack. Shoots ...toxic to ... grazing animals, due to high levels of oxalate (up to 4.7% soluble and 11.4% total), nitrate (up to 2.2 percent) and alkaloid (up to 1.2 percent). Plants that accumulate more than 1.5 percent by dry matter of nitrate are potentially toxic." There are literally thousands of plant and insect species that threaten productivity of agricultural, pastoral, orchard or market garden activities. The fact that this plant example is one which directly damages both livestock and crops is a mere accident. But it's a perfect illustration of precisely the kind of plant that we'd like to see fail in the evolutionary race being set up by climate change. Seeing as weeds, almost by definition, are plants which succeed where they're not wanted, they look to have an evolutionary advantage in many of those environments. -
Camburn at 15:15 PM on 9 August 2011More Carbon Dioxide is not necessarily good for plants.
Tom: The adaptability of Kochia into sub species....and yes it is actually a new sub species according to NDSU to be able to grow later in the year was/is quit remarkable. This has nothing to do with pesticide, and everything to do with adaptability. You are correct, in that vegitation will respond rapidly to a change and adapt. The trees will not be so lucky, as they are a long life species, and their seed does not move as easily as grass/weed/etc seeds. -
Camburn at 15:12 PM on 9 August 2011More Carbon Dioxide is not necessarily good for plants.
scaddenp: This is from memory, but I believe in The Chec Republic some years ago there were massive demonstrations because of the difference in how some wanted to manage the forests. Also in talking with cousins up north..Canada...they state that where the forest is young and thriveing, the beetle doesn't really do damage, but the older forests that haven't rejuvinated themselves, the beetle is widespread. That is a local observation for what it is worth. I think the thing in Checoslovakia...(spelling)...was much more dramatic and in depth.
Prev 1570 1571 1572 1573 1574 1575 1576 1577 1578 1579 1580 1581 1582 1583 1584 1585 Next


