


 Arguments


Recent Comments
Prev 1580 1581 1582 1583 1584 1585 1586 1587 1588 1589 1590 1591 1592 1593 1594 1595 Next
Comments 79351 to 79400:
-
Byron Smith at 23:28 PM on 13 July 2011OA not OK part 5: Reservoir dogs
ianash - Hope I'm not explaining things that are bleedingly obvious to you here. The diagram (Figure 2) does take a little effort to understand. It is divided schematically into five fields, representing the five main reservoirs of carbon in the global carbon cycle. As stated in the caption, the size of the blue circle represents the mass of carbon in each reservoir in pre-industrial times, while the red circle shows the mass of carbon in the mid-1990s (as noted in the post, things have changed quite a bit since then. Could someone put up some updated numbers? Even an approximation would help.) For some reason, unexploited fossil fuels are shown in a single black dotted circle rather than red and blue ones. In each field, the black circle indicates the scale of change from pre-industrial to mid-1990s. If the black circle appears in a blue circle (as it does for atmosphere and both surface and deep oceans), that reservoir has gained carbon. Soils and plants has a black circle in the red sphere, indicating a loss of carbon (think deforestation, though also other processes). The fossil fuel circle indicates the relative scale of estimated recoverable reserves vs total amount of fossil fuels extracted and exploited (i.e. less than 7%), making the point that there is still plenty of carbon we could potentially dig up and stick in places where its going to mess things around (i.e. the atmosphere and oceans). Numbers give the Gt of carbon represented by each circle and then the % change. (Some have criticised the IPCC's figures for being considerably too rosy about the total reservoir of recoverable carbon from fossil fuels, but even less optimistic figures still give us plenty of scope to keep making more mess.) So the quick take-away message from the figure is that between the industrial revolution and the mid-1990s, we took 283 Gt of carbon from places where it wasn't doing anything particularly bad for us and put it into places where it is.Moderator Response: I should have said: Previous unclear caption was edited. Doug -
Thebadmentor at 23:23 PM on 13 July 2011Neptune is warming
TSI is your argument? Do you really think that its only TSI that affects Plantes Climate? WOW! -
Doug Mackie at 23:02 PM on 13 July 2011OA not OK part 4: The f-word: pH
@DLB From someone who reads recent scientific papers that is a surprising question. What makes you think the dissociation of water would change? -
Ken Lambert at 22:40 PM on 13 July 2011Visions of the Arctic
I have never read a piece by an environmentalist which did not pose a dire warning of some kind about the imminent demise of some form of wildlife. Surely the odds are that some creature somewhere will benefit from a warmer world. In fact the odds are probably even that 50% of creatures will benefit and 50% won't.Moderator Response: [Dikran Marsupial] The odds are almost certainly not 50-50. Most organisms will have adapted to a particular ecological niche, and so any change is likely to mean they are sub-optimally adapted for their conditions. Of course there will be winners and loosers, but the theory of evolution would suggest there will be more loosers than winners, at least in the short-medium term. -
Eric (skeptic) at 22:36 PM on 13 July 2011Trenberth on Tracking Earth’s energy: A key to climate variability and change
Rob #35, if the weather causes a 0.1 or 0.2 rise or fall in GAT in less than a week (although this only happens a few times a year), it is probably one of the more random effects of weather (using a precise definition of random). For this to happen, with either outcome cooling or warming, a lot of weather systems have to complement in both hemispheres which are, for the most part uncoupled. Getting both hemispheres to line up on a short time scale is thus pure chance. Getting a single hemisphere to align in warming or cooling is a little less random due to teleconnections, but those are limited in scope and generally peristent through a season. The topic certainly merits a lot more research. -
Eric the Red at 22:35 PM on 13 July 2011The Medieval Warm(ish) Period In Pictures
scaddenp, You were requesting information on glacial retreat. The first in from Schnidejoch in Central Europe, the second is from Glacier National Park in Montana, and the third is from the Greenland ice cores. http://www.giub.unibe.ch/klimet/docs/climdyn_2007_grosjean_et_al.pdf https://www.cfa.harvard.edu/~wsoon/RajeshKoushik10-d/MacGregoretal10-12900yrSwiftcurrentLakeGlacierNatlPark.pdf ftp://ftp.ncdc.noaa.gov/pub/data/paleo/icecore/greenland/summit/gisp2/isotopes/gisp2_temp_accum_alley2000.txt -
Ken Lambert at 22:21 PM on 13 July 2011Trenberth on Tracking Earth’s energy: A key to climate variability and change
Moderator - Daniel Bailey Do we have any indicaton that Dr Trenberth will participate in discussions on this thread? There are a number of questions which merit some response (and a few which do not), so if there is no one arguing Dr Trenberth's case (chiefly himself) - this thread will wither on the vine.Response:[DB] My understanding was that Dr. Trenberth was travelling abroad for a few weeks. As a service, he provided this article before he left. Given his busy schedule, I would be (happily) surprised if he were able to make an appearance before then.
That being said, perhaps few feel the need to prosecute the case so eloquently presented by an expert, such as Dr. Trenberth?
In any event, questions remaining unanswered should be addressed in a future iteration of this article, so tack any of them up here for posterity. Few threads here at SkS are truly "withered"; many are inactive, but witness the undead 2nd law thread...
-
Eric (skeptic) at 22:21 PM on 13 July 2011Polar bear numbers are increasing
Thanks very much for the update (30 September 2010) on this older post. I just noticed it now and it is much improved in context over the original. -
ianash at 21:58 PM on 13 July 2011OA not OK part 5: Reservoir dogs
I'm not trying to be funny - the diagram just makes no sense to me - sorry for not being substantive enough for you. -
CBDunkerson at 21:49 PM on 13 July 2011Visions of the Arctic
The writeup on the Davis Strait population says: "Ecological covariates associated with survival suggest that the decline may be as a combined result of short-term and local density dependence, stabilization of harp seal (Pagophilus groenlandicus) numbers and declining ice conditions." Ergo, I wouldn't agree with the statement that this was due to hunting. That leaves only three populations (Baffin, Kane, and Lancaster) which are declining primarily due to hunting. The Chukchi Sea population is declining due to both ice loss and illegal hunting, but it isn't clear how much of the decline is due to each factor. -
Tom Curtis at 21:48 PM on 13 July 2011Seawater Equilibria
Further reflection on Eby et al suggests that if we were to stop all emissions instantaneously, CO2 levels would fall to about 315 ppmv after 10 thousand years, but take 50 to 100 years to fall to 350 ppmv. That is, of course, irrelevant. The only target we have a realistic hope of achieving at the moment, and only if we act decisively in the next few years is around 450 ppmv, locking in a 2 degree temperature increase that is likely to last for a century or so, and take over three thousand years to fall back below 1.6 degrees C. -
Tom Curtis at 21:38 PM on 13 July 2011Seawater Equilibria
Eric (skeptic) @91, you may find Eby et al, 2009 more useful than Archer and Brovkin, 2006. They examine the impacts of both smaller, and a wider range of CO2 slugs than to Archer and Brovkin. In particular they examine the impact of a slug of 160 Pg on top of 2000 levels of CO2 in the atmosphere (estimated at around 300 Pg). The slug of CO2 adds an additional 69 ppmv of CO2 to 2000 levels. This slug then decays exponentially so that its contribution to the atmosphere is just 41% of the original after 50 years (34.5 ppmv), just 37% after 100 years (25.5 ppmv), just 35% after 150 years (24.2 ppmv), and 27% after 200 years (18.6 ppmv). After a thousand years it declines to 23% (15.9 ppmv), and after 10 thousand, to about 18% (12.42). These decay rates are an overestimate of expected decay rates for stopping all emissions now. That is because if the CO2 is introduced slowly rather than as a single slug in one year, it has time for some of it to reach enter the deep ocean before emissions cease. Consequently the initial peak of atmospheric CO2 concentration is not as high, but the decay rate from that peak is slower. For example, in the 160-A2+ model run conducted by Ebi et al, peak atmospheric CO2 was just 37.7% of that in the 160 model run. In the 160-A2+ run, CO2 was introduced over several centuries, and the decay pattern follows a similar path to the 160 run from the point where that run decays to 40% of the peak. As it happens, Eby et al ran a control experiment with no emissions after 2000. The result was that after ten thousand years, the CO2 concentration dropped by 55 ppmv from a peak of 376 ppmv. That represents a fall to 33% of the peak increase after ten thousand years. It also suggests that after 150 years of exponentially increasing emissions, 16% of CO2 that would otherwise be stored in the atmosphere has been stored in the deep ocean. -
Eric the Red at 21:36 PM on 13 July 2011Visions of the Arctic
Eric, Recent polar bear populations have been so strongly influenced by hunting that other influences are lost in the noise. There is little doubt that the Oslo agreement has been responsible for an increase in polar bear populations worldwide over the past several decades. Actual values for this increase are open to speculation as early data was difficult to obtain. Even recent numbers are somewhat speculative. Restricting hunting to natives in the affected areas may have resulted in population changes to certain areas (Hudson Bay) that are not representative of the whole. Increases in human populations in these areas have probably been a much larger factor than any other. Recent calls for lifting the ban on polar bear hunting will undoubtedly effect their numbers. Discerning the effects of climate change in relation to hunting is very difficult. -
Eric (skeptic) at 21:31 PM on 13 July 2011Visions of the Arctic
CBDunkerson, I appreciate your well-founded replies to me over the past year. The table that is linked in the post (link above) shows that "most declines due to hunting except Hudson Bay" is well-supported with a modification. There are 6 populations with risk of future decline evaluated at "very high": Baffin Bay, Davis Strait, Kane Basin, Norwegian Bay and the 2 Hudson Bay populations. The first three are declning due to hunting, and the latter three have declining body condition. One other population, Lancaster Sound is listed as "higher" risk of decline, due to hunting. Southern Beaufort Sea is at moderate risk of decline due to declining sea ice. Two populations have very low risk of decline, and the rest have insufficient data (e.g. Russian populations with substantial hunting). I would recommend that people click on each population and read the text. -
CBDunkerson at 21:04 PM on 13 July 2011Visions of the Arctic
'Other marine mammals not impacted': Actually, one of the threats to polar bears from global warming is the danger it poses to their food sources. Ringed and Bearded seals are the primary prey of polar bears... but they den on the ice. As ice melt has accelerated it has become common for newborn pups to have their den melt around them before they are capable of surviving in the water. In the U.S. the conservation status of both species is currently under review to see if they should be listed under the Endangered Species Act. 'Most polar bear population declines are only due to hunting': Eric, as we've discussed before, that isn't supported by the evidence. People wishing to get the real story can do so at the IUCN polar bear status page. The links to each sub-population on that page give information about the causes of population declines... and the claim that it is over-hunting for every group except the Hudson Bay population is just false. -
Arkadiusz Semczyszak at 21:02 PM on 13 July 2011Trenberth on Tracking Earth’s energy: A key to climate variability and change
@Rob Honeycutt Aerosols are mainly India + Pakistan and others are rapidly developing poor countries of Africa and Asia (the use of simple reserves) - not China. I do not “believe” in “... that some unknown systematic error in the Argo float system is causing the flattening ...”. Recently I analyze an interesting paper The HadGEM2-ES implementation of CMIP5 centennial simulations, Jones et al. 2011. (36 coauthors) : I like the Figure 20 there (but also a Figure 19 - of course ...) ... and the chapter begins with this fragment: “Extensive evidence exists from previous long control simulations showing simulated climate possesses large-scale variations on decadal to centennial timescales (Delworth et al., 1993; Delworth and Mann, 2000; Latif et al., 2004; Knight et al., 2005). Typically, these variations are associated with the principal modes of decadal variability of the climate system – the Atlantic Multidecadal Oscillation (AMO) (Enfield et al., 2001) and the Pacific Decadal Oscillation (PDO), sometimes referred to as the Interdecadal Pacific Oscillation (IPO) (Power et al., 1999). The AMO is a North Atlantic-centred mode in which sea surface temperatures (SSTs) vary coherently within the basin on multidecadal to centennial timescales, and which can have far reaching climate impacts (Knight et al., 2006). The PDO/IPO has a characteristic pattern of anomalously warm and cool SSTs in the Pacific Ocean that resembles a modified El Ni˜no pattern, and typically has a shorter timescale of about two decades (Kwon and Deser, 2007). So-called “perfect model” experiments (Collins and Sinha, 2003), in which sections of model control simulations are repeated after small initial perturbations, demonstrate the potential for multidecadal oceanic processes to provide a long-term memory of the initial state.” ... and ending with this sentence: “Future work may explore the response of extra ensemble members which start from deliberately chosen high or low AMO states.” Maybe in a much larger change in energy content in the ocean is responsible underestimated AMO? But then earlier (195? -1999) energetic "effect anthropogenic" would be considered too highly estimated ... I think it's time for these "Future work” ... -
Eric (skeptic) at 20:57 PM on 13 July 2011Seawater Equilibria
scaddenp, finally got that article. It is short and sweet. It confirms everything I have said above, namely "In response to an abrupt elimination of carbon dioxide emissions, global temperatures either remain approximately constant, or cool slightly as natural carbon sinks gradually draw anthropogenic carbon out of the atmosphere at a rate similar to the mixing of heat into the deep ocean" They then conclude that the elimination of CO2 will result in stable temperature. Then they issue a "hopeful" warning that " if we can successfully coordinate international emissions reductions in the coming decades, we can successfully restrict global temperature increases to a level that will prevent dangerous impacts on both human and environmental systems." For future reference, we can call this the "saved by the ocean" scenario. -
BBD at 20:48 PM on 13 July 2011A Detailed Look at Renewable Baseload Energy
Tom # 310 Excellent summary. Agreed! Thanks again. KR # 306 #307 Interesting analysis on power density at Waldpolenz. In order to prevent errors (!) I'd like to take time to consider what you say and it's bearing on Smil. One small point:Using 30% efficient CSP in a 2000 kWh/yr site (>230 Wh/m^2 average from MacKay, not the 200 BBD introduced),
I used 200W/m2 as this is the LAGI estimate. Not trying to muddy the waters... And thanks again to you. -
Eric (skeptic) at 20:11 PM on 13 July 2011Visions of the Arctic
The flip side of decreasing pack ice in Europe, Alaska, and of course Hudson Bay, is the increase in open water season in north certral Canada. One of my first posts on this forum /polar-bears-global-warming.htm#14708 was to point out that while the Hudson Bay populations were doing poorly due to decreasing ice, the other populations were only being impacted by hunting (at a rate of up to 10% per year) but were otherwise doing fine. The fate of an individual polar bear has little scientific relevance. The fate of a population is more concerning because of broader implications, but I don't have much knowledge of the history of historical variations in populations. But I doubt they were always where they are now. Warming in Arctic will favor the populations where the warm season is currently short. -
Eric (skeptic) at 19:43 PM on 13 July 2011Seawater Equilibria
Tom, thanks very much for the reference. I think you had pointed it out before, because it was in my saved papers folder. Reading through it again I see how some people may read it too quickly and conclude that one scenario represents "if we stopped producing CO2 today...." (my academic scenario I described above) But Archer is describing two potential, realistic scenarios, one where a moderate amount of 1000 GtC is released (compared to 2008's 337) and another with 5-6,000 GtC. Both have long tails and the 5-6,000 scenarios is especially long due to positive feedbacks. The first is essentially "we start to take action", the second, BAU. The simple model I use assumes that the CO2 reservoirs are passive. Substantial ocean warming (more than 1-2C) will negate that assumption as would permafrost melting or any other positive feedback. But as it stands, my model incorporates the current state (as of 2008) of all potentially active reservoirs or other positive feedbacks (as measured, not predicted) and the result is not substantially different from what one would expect looking at the diagram in Tom's link: http://earthguide.ucsd.edu/virtualmuseum/images/ReservoirsOfCarbon.html Given a slug of anthro-carbon into the atmospheric reservoir, the atmospheric concentration decays exponentially by migrating into the other reservoirs. Again, that depends on the rest of the system being passive (no substantial positive feedbacks). But exponential decay in that case is incontrovertible. Scaddenp, while I wrote the above I struggled with nature.com trying to purchase the article you linked. I'll comment here once I succeed and have a chance to read it. -
Doug Mackie at 19:12 PM on 13 July 2011OA not OK part 5: Reservoir dogs
Thanks Rob. Yes, at first glance it does look that way. But just because an equation can be written does not mean that all reactions are equal. There is a hierarchy and we discuss it in post 7. -
Rob Painting at 18:39 PM on 13 July 2011OA not OK part 5: Reservoir dogs
Well, I was going to say something about the equations implying more carbonates from ocean acidification, rather than less, but you mention this is covered in later posts. -
Paul D at 18:18 PM on 13 July 2011Visions of the Arctic
Mandas said "I am a wildlife scientist - similar to you I guess" I thought APirate was a school teacher?? -
Paul D at 18:08 PM on 13 July 2011Visions of the Arctic
Pirate said: "DB: Can you or anyone else, other than the photographer (if he is willing), legitimately say that polar bear in that picture is in legitimate duress?" Most wild life is under duress 24/7. And the word legitimate is a meaningless word outside human existence/knowledge. Last time I looked Polar Bears aren't human. Polar bears use sea ice to travel across the sea and hunt for food. They don't have much food sources on land, so the sea is a rich area for them to hunt. As sea ice melts more abruptly as a result of climate change, they are forced to swim more to reach ice flows or to return to land. This causes significant problems especially for a female polar bear with her young following her. Young polar bears can struggle moving from ice to water, especially if food is short. Ok so lets assume the ice goes and polar bears are forced to move in land. What is the impact? Well other species including humans have occupied that land for thousands of years. There is no real positive news for polar bears or for thousands of other species threatened by our behaviour. -
DLB at 17:27 PM on 13 July 2011OA not OK part 4: The f-word: pH
If water dissociated more, would the pH decrease? Intuitively I would have thought it would still be classified as neutral. -
Doug Mackie at 17:15 PM on 13 July 2011OA not OK part 5: Reservoir dogs
@DLB Do you mean "how do we know what pre-industrial ocean pH was?" or do you mean "how is ocean pH measured?" -
Doug Mackie at 17:10 PM on 13 July 2011OA not OK part 5: Reservoir dogs
I'm really looking forward to a substantive comment about the science. -
Tom Curtis at 17:03 PM on 13 July 2011A Detailed Look at Renewable Baseload Energy
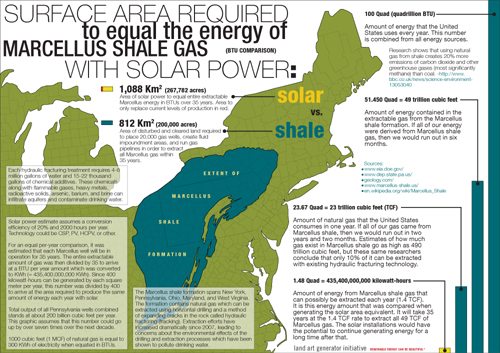
KR @307, you would probably be interested in these comparisons, also at LAGI. Solar vs Tar Sands: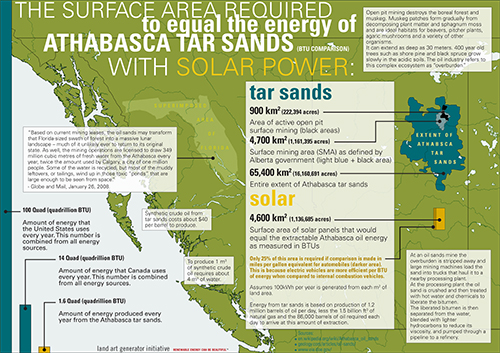 Solar vs Shale Gas:
-
DLB at 17:00 PM on 13 July 2011OA not OK part 5: Reservoir dogs
You say since the beginning of the industrial revolution, H3O+ has increased by 29% in sea water. Has this been measured by some sort of proxy, or is it based on calculations from atmosphere to ocean? -
Tom Curtis at 16:58 PM on 13 July 2011A Detailed Look at Renewable Baseload Energy
BBD @308, let me echo KR's appreciation. Few things improve my opinion of a person as much as a willingness to admit mistakes. IMO what has been established in the LAGI discussion is that: 1) Suitably sited, and counting only collector area, 500,000 km^2 could supply the Earth's entire projected energy needs in 2030. 2) Allowing for the normal ratios between collector area and site area, the area of solar power plants required to supply the Earth's entire projected energy needs in 2030 is 1,500,000 km^2. 3) This precludes the wide spread use of single use solar plants as a power source in densely inhabited regions with in mid or high latitudes, or in very densely inhabited regions (such as Singapore) regardless of location. 4) This does not preclude the wide spread use of solar power generation in those areas so long as dual use of the area is incorporated into the design so that the solar power generation is not precluding other desirable activity. Such use could be a significant (circa 15% as a reasonable estimate) provider of power in northern Europe, but not a primary power supplier, nor a supplier of base load power. 5) This does not preclude the significant generation of solar power in low latitude, low population density areas (South of Spain and North Africa) with power being transmitted to industrialised regions. Such location and transmission raises security issues, but comparable security issues to those currently existing related to majority sourcing of fossil fuel from the middle east. 6) The specific design of collectors, and in particular their tracking mechanism makes a crucial difference to the efficiency of the collector relative to the unit area of the collector (and hence cost). Gains in efficiency by tracking are made with a trade of in reduced collector area to site area ratio. We have not discussed or agreed on whether solar power suitably located could provide base load power, and the economic efficiency of solar power as a major (> 20%) or majority supplier of power requirements. Would you agree with that summary. -
Stevo at 16:49 PM on 13 July 2011Visions of the Arctic
Pirate, the science explaining the melting of the arctic ice cap is well represented at this site. Communicating the consequences of climate to the general public has not been easy. If Florian's photographs and anecdotal story strike an emotional note with the greater public then it is all to the better good. I suspect that keeping the science dry and restricted to the lab and not in front of the public in language and images they can understand is all part of the agenda of those who wish to deny the science and prevent meaningful action from being taken. -
ianash at 15:51 PM on 13 July 2011OA not OK part 5: Reservoir dogs
OK, another question. What are the blue and red circles meant to represent in the diagram? And the black dot? -
ianash at 15:45 PM on 13 July 2011OA not OK part 5: Reservoir dogs
pedantic but "carbonate (CO3–)" in secon para shd be 2- -
co2isnotevil at 15:21 PM on 13 July 2011Trenberth on Tracking Earth’s energy: A key to climate variability and change
( -Moderation Complaints Snipped- )Response:[DB] I deleted your previous comment as it was a rehash of material you had previously submitted - and been responded to - on the 2nd Law thread. That you didn't like the answers you were given does not obviate the fact that you were indeed given answers to your questions there.
Typically, comments challenging the moderation policy are summarily deleted, as posting here at SkS is a privilege; thus the act of posting here is then tacit agreement to comply with the Comments Policy. And repetitive posting is a violation of that policy.
Thanks for your understanding in this matter.
-
muoncounter at 15:01 PM on 13 July 2011Visions of the Arctic
mandas #18: "YOU don't know how far that bear was swimming," Here's how far this bear was swimming: polar bear 20741 decided to leave a remote Beaufort Sea beach. The 7-year-old, nearly 500-pound bear walked north into frigid Arctic Ocean water east of Barrow in search of sea ice. ... She covered 426 miles -- farther than researchers have recorded a polar bear swimming without a break. After nine days, she reached pack ice ... Her body mass was reduced 22 percent and her internal temperature had dropped. Her yearling cub was gone, likely drowned. So what have we established? Bears can swim a heck of a long way when they have to. Their cubs, not so much. I'm no biologist, but when cubs die, isn't that bad news for the bears? But whether one reacts emotionally or not is unimportant. What is important here is that sea ice is disappearing before our eyes. The fate of these particular bears is just one more pesky piece of that consistent evidence. -
scaddenp at 14:00 PM on 13 July 2011Seawater Equilibria
Eric, care to comment on comparison of your model with that of Matthews & Weaver zero emission scenario? -
Artful Dodger at 13:56 PM on 13 July 2011Over the tipping point
Joe Romm posted on this today: Climate Change Reducing Ocean’s Carbon Dioxide Uptake -
scaddenp at 13:53 PM on 13 July 2011The Medieval Warm(ish) Period In Pictures
The issues with Loehle are well known - merely citing it should be a red flag that denialist site is involved somewhere. (Actually its fun to look at who has cited it Scholar and in what publication). -
Tom Curtis at 13:51 PM on 13 July 2011Seawater Equilibria
Eric (skeptic) @88, based on recent research, if we add 1 to 2 thousand Gigatonnes of Carbon to the atmosphere, atmospheric CO2 will still be 22% of the amount added above the pre-industrial average. If we add 4 to 5 Gigatonnes, the amospheric CO2 levels would increase by 34% of the amount added once full ocean equilibrium is reached. Even though the 5 thousand Gigatonnes represents just 11.6% of the total quickly equilibrating reservoirs of Carbon (Ocean 40,000 GT, Soil 1600 Gt, Atmosphere 750 Gigatonnes, Biosphere 610 Gt), the additional CO2 changes the Ph balance of the Ocean, reducing the amount of carbon it can hold. Thus with total emissions of 5,000 Gt, we are looking at atmospheric levels of CO2 that are 3.25 times preindustrial levels for many thousands of years into the future. Indeed, we are looking at 4.8 times preindustrial CO2 out to a thousand years from now, and 2.9 times preindustrial levels out to ten thousand years from now. -
mandas at 13:50 PM on 13 July 2011Visions of the Arctic
Apiratelooksat50 I am a wildlife scientist - similar to you I guess - and you are correct in your assertion that polar bears swim for miles in the ocean ocean. But then, no-one is denying that fact. But if you are a scientist, then you will know that the statement you made in #2 was just shockingly wrong, and should be retracted: ".....That polar bear is no more swimming for his life than I was this morning at the local YMCA. Polar bears are marine mammals and routinely swim many miles in open ocean...." How do you know? The polar bear MAY have been perfectly safe, but you don't know where the photo was taken, nor do you know the circumstances of that particular bear was facing. Evidence my dear chap, evidence. If you don't want to be branded a denier, then you should make statements based on evidence, and not on a knee jerk reaction to something. You said it best yourself in post #4: "....DB, do you know how far that bear was swimming? Do you know how far apart his meals were? Or, are you emotionally reacting to a "snapshot" and a tagline?..." You were 100% correct to point those things out to DB. But you should have taken a piece of your own advice. Quite simply, YOU don't know how far that bear was swimming, nor how far apart his meals were. YOU were the one who was emotionally reacting to a snapshot and a tagline.Response:[DB] I plead guilty to a somewhat emotional reaction to a serial dissembler.
Mea culpa. ;-)
-
Camburn at 13:00 PM on 13 July 2011The Medieval Warm(ish) Period In Pictures
Thank you DB. Anyways, the fig 1 is the temp pattern for the MWP unless I am misunderstanding it. It is very obvious that the Saragasso Sea was warmer during this period than depicted on fig 1. This does throw a large amount of uncertainty into the reanalysis presented.Response:[DB] "This does throw a large amount of uncertainty into the reanalysis presented."
Not on the basis of any information you have presented. Your link shows that the area of the Sargasso Sea was warmer at various periods of time than it was at the most recent data point in the graph - 385+ years prior to 1966.
Which is odd, given that Keigwin 1966 includes station data for the period 1924-1966, which are not shown in the source you provide. As constituted, the totality of the warming post-1880 is unrepresented.
Either way, you are still conflating a regional proxy into global effects.

[Source]
-
Eric (skeptic) at 12:36 PM on 13 July 2011Seawater Equilibria
One more note (and I promise the last for tonight), which is that 337 GtC (I was using MtC in post 87 but mistakenly labeled it GtC) that we added is mostly fossil fuel origin, taken out of long term storage. It was added to the 597 GtC in the atmosphere and 1000 Gt in the surface ocean, and slowly mixed into the 40,000 Gt in the combined ocean and atmosphere reservoirs. But it is more complex since the ocean overturning is slow, less mixing is possible with the deep ocean reservoir. So our added 337 represents as much as a 18% (atmosphere + surface ocean) or as little as 1% (atmos plus entire ocean) addition to the total existing reservoirs (depending on mixing). That is how our new equilibrium is calculated if we stopped emitting today (and it would require a long exponential decay to get there). We've bumped surface carbon up a notch (the notch height depending on ocean mixing) and continue to do so. -
Michael Hauber at 12:23 PM on 13 July 2011What we know and what we don't know
We also know that a warmer temperature will result in a larger capacity of the atmosphere to hold water. If the actual amount of water held in the atmosphere changes at a similar rate to the change in capacity then we have positive water vapour feedback. To avoid water vapour feedback we require that the relative humditity of the atmosphere goes down as temperature increases, and therefore goes up as temperature increases. Although there is not obvious reason this cannot happen for small changes in temperature, for large enough changes in temperature this will eventually require that the atmosphere either store more than its total possible capacity, or that the relative humidity drops to values lower than the driest desert observed on earth today. It would seem impossible for water vapour feedback to be negative over large enough changes of temperature, and only possible over a restricted range. For a negative feedback to be possible we require that such a range exists, and that we are lucky enough that this range overlaps the temperature change we are now undergoing. -
Eric (skeptic) at 12:17 PM on 13 July 2011Seawater Equilibria
Please allow me a complementary (and hopefully much simpler) explanation of the idea in post 86. Humans added 337,000 Gt of carbon to the atmosphere from 1750 to 2008 of which 224,000 Gt remained in the atmosphere as of 2008. The rest was "sequestered" in the ocean. I use quotes around sequestered because as hfranzen points out in post 81, it is still ready to escape back into the atmosphere. However, as with the "sequestered" atmospheric warming, the ocean effectively sequesters CO2 and warmth on decade to century time scales through overturning. Furthermore it is ultimately diluted through most of the ocean depths thus lowering the P(CO2) overall (including the surface), so it will end up at an equilibrium with the (almost) full ocean and atmosphere. I certainly welcome and appreciate any response and corrections. Also there are caveats, my model assumes no ocean warming (each 1C will add about 10ppm, other things being equal). -
Rob Honeycutt at 12:17 PM on 13 July 2011The Medieval Warm(ish) Period In Pictures
Dave... You might note where the Loehle paper is published, and just as important, where it's not published. I don't think there was much in the way of review there. If I'm not mistaken that paper got rejected all down the line, fairly aggressively, before landing at E&E. -
Marvin Gardens at 12:16 PM on 13 July 2011Visions of the Arctic
Tom Curtis @ 16: 2nd paragraph If changes in habitat occur then all flora and fauna in the area will have to adapt or perish. That is evolution, is it not? Not that it has anything to do with AGW, but keeping in vein with this post - changes in habitat led to the evolution/adaptation of brown bears into polar bears. -
Dave123 at 11:58 AM on 13 July 2011The Medieval Warm(ish) Period In Pictures
I looked at the Loehle paper a while ago. He simply averages the different proxy deviations from normal, and does a bunch of slight of hand to claim the average is robust. There was to my reading no attempt to weight the individual proxies for geographic area covered or test non-MWP 'knowns' for statistical similarity or difference from the few non-northern hemisphere proxies. For the life of me I can't understand why such weren't demanded in peer review....although I do get the point that the paper wasn't in a truly peer reviewed journal. Unless someone can show otherwise, just collecting a bunch of proxies without geographic weighting simply isn't legit. And I'd still like to know what was driving the alledged MWP. I've yet to see a hypothesis for such. It's not enough to flap your arms and say "It's natural". -
Tom Curtis at 11:56 AM on 13 July 2011Visions of the Arctic
From Peru @ 6, in Hudson Bay and the Canadian Archipelago, Sea ice is kept close to land by being sheltered from break up by the archipelago. I suspect sea ice also forms easily in that area, particularly in Hudson Bay due to a lower salinity. Therefore it is unsafe to assume the current precarious survival of Polar Bears in those regions to Russian (and Alaskan) conditions. Further, and more importantly, what seems to be missing in the polar bear debate is any knowledge of evolution. With warming, not only will the ice melt, restricting polar bears to land; but the land will also warm, extending the range of Brown bears and Grizzlies (and humans). Most species easily survive their natural environmental conditions, and survive quite well in adverse conditions. What they do not survive is competition from other species better adapted to conditions they find adverse. The warming world will bring about such competition between Grizzlies and Polar bears. It will also increase human inhabitation in polar bear ranges. Both factors are likely to push stressed populations into extinction. -
Tom Curtis at 11:43 AM on 13 July 2011What we know and what we don't know
Begging the moderators indulgence. Eric the Red @17, In 1986 the economic system of the Soviet Union collapsed, leading to a very sharp contraction in Soviet emissions, and a contraction in world emissions. This was reinforced by similar collapses in production in former Soviet satellites, including East Germany. The contraction was sufficiently rapid to more than offset China's rapid growth in emissions in the period. The effect was reinforced by a sharp reduction in global temperatures due to Mount Pinatubo. Note that while the combined emissions of the US, the former USSR, and China contracted (entirely due to the former USSR as US and Chinese emissions continued to grow) in this period, world emissions continued to rise, as did CO2 concentrations. Former Soviet Union (now the Commonwealth of Independent States) stabilised their economies and hence emissions around 1996, allowing the underlying growth in world emissions to reassert itself again. This was reinforced by the 1997/98 El Nino. Around 1999 Chinese emissions took a sharp turn upwards, doubling in around 10 years (which requires around a 7% per annum growth rate). That rapid growth in Chinese emissions is ongoing. So, unless you are predicting a similar collapse to industrial output in Europe or the US to that which occured in former Soviet states during the collapse of the Soviet Union in the next decade, and another collapse for whichever did not collapse in the following decade, the reduction in the growth rate of CO2 concentrations in the 1990s is an aberration and not projectable.
If we consider the 1970's and 1980s, they exhibit more than exponential growth. If we consider the 2000's, they exhibit more than exponential growth. If we consider the pattern over the whole period, 1975 to 2010, it exhibits more than exponential growth. The only way you are able to see merely exponential growth in the curve is to focus on two highly unusual, and very sharp economic contractions.
Given that, and given that emissions growth is currently tracking the A1 and B2 range, the sensible projection, given no radical changes of policy are either the A1B scenario (if China follows through with its policy of reducing emissions intensity, and India, Brazil and/or Africa do not experience a similar economic renaissance), or the A2 scenario if China does not follow through.
So, unless you are predicting a similar collapse to industrial output in Europe or the US to that which occured in former Soviet states during the collapse of the Soviet Union in the next decade, and another collapse for whichever did not collapse in the following decade, the reduction in the growth rate of CO2 concentrations in the 1990s is an aberration and not projectable.
If we consider the 1970's and 1980s, they exhibit more than exponential growth. If we consider the 2000's, they exhibit more than exponential growth. If we consider the pattern over the whole period, 1975 to 2010, it exhibits more than exponential growth. The only way you are able to see merely exponential growth in the curve is to focus on two highly unusual, and very sharp economic contractions.
Given that, and given that emissions growth is currently tracking the A1 and B2 range, the sensible projection, given no radical changes of policy are either the A1B scenario (if China follows through with its policy of reducing emissions intensity, and India, Brazil and/or Africa do not experience a similar economic renaissance), or the A2 scenario if China does not follow through.
 There have been several comments on SS lately about the futility of "chartism" (normally using Tamino's less polite term), ie, of trying to predict trends without understanding of the underlying causes. I think "chartism" is exactly what you are indulging in. As can be seen, if underlying causes are looked at chartism about CO2 increases is revealed for the nonsense it always is.
As an (IMO) irrelevant addendum, and only because you asked:
Based on my last post and the evidence, I would expect stronger than linear growth, and stronger than the best fit trend growth for 2010 because of the recovery from the GFC, and a strong El Nino. That is, I would expect a sharp up tick for the next datum on Tamino's graph (the second) above. If no strong El Nino develops in the last months of 2011, I would expect the ongoing recovery plus the strong La Nina to result in a lower growth than 2010 but higher than in 2009, resulting approximately in an ongoing linear trend in the growth of the growth rate for the period 2007-2011, and hence exponential growth in concentration. Continued warming in 2012 will result in that becoming faster than exponential growth in concentration from 2012.
Having said that, the recovery is on very shaky legs in Europe and the US at the moment (for different reasons), and a strong tropical could erupt tomorrow. Predicting short term trends beyond continuing growth is a mugs game. Medium term, all the evidence suggests continued faster than exponential growth. Long term is up to us.
As noted, I consider this discussion of short term predictions irrelevant for reasons given, and will not indulge it any further in later comments.
There have been several comments on SS lately about the futility of "chartism" (normally using Tamino's less polite term), ie, of trying to predict trends without understanding of the underlying causes. I think "chartism" is exactly what you are indulging in. As can be seen, if underlying causes are looked at chartism about CO2 increases is revealed for the nonsense it always is.
As an (IMO) irrelevant addendum, and only because you asked:
Based on my last post and the evidence, I would expect stronger than linear growth, and stronger than the best fit trend growth for 2010 because of the recovery from the GFC, and a strong El Nino. That is, I would expect a sharp up tick for the next datum on Tamino's graph (the second) above. If no strong El Nino develops in the last months of 2011, I would expect the ongoing recovery plus the strong La Nina to result in a lower growth than 2010 but higher than in 2009, resulting approximately in an ongoing linear trend in the growth of the growth rate for the period 2007-2011, and hence exponential growth in concentration. Continued warming in 2012 will result in that becoming faster than exponential growth in concentration from 2012.
Having said that, the recovery is on very shaky legs in Europe and the US at the moment (for different reasons), and a strong tropical could erupt tomorrow. Predicting short term trends beyond continuing growth is a mugs game. Medium term, all the evidence suggests continued faster than exponential growth. Long term is up to us.
As noted, I consider this discussion of short term predictions irrelevant for reasons given, and will not indulge it any further in later comments.
-
Eric (skeptic) at 11:38 AM on 13 July 2011Seawater Equilibria
DB, in response to your response here http://skepticalscience.com/news.php?n=870#57760 we are talking about two different scenarios. Mine was the hypothetical ceasing of all emissions (I should have added the caveat including cement making and deforestation) in response to the comment that even ceasing emissions will result in CO2 rising. In this case it some sort of decrease in CO2 that is being proposed. I would note that my scenario is completely academic , we are not going to cease fossil fuel burning, deforestation and cement making. But it is quite true that if did cease adding CO2 to the atmosphere, the CO2 amounts would drop immediately despite the ocean outgassing that is described above. My model (linked in this post /argument.php?p=2&t=113&&a=80#54888 incorporates all current ocean outgassing (it has to since I am modeling the rise in atmospheric CO2). The model shows an exponential decay that fits the data and results in a drop to 350 ppm in about 40 years. Obviously such a rapid drop won't be sustained after that and it will never drop below about 300 (best case) due to our total added CO2 from previously sequestered sources. Now I do understand the point hfranzen is making in 81, he is proposing a hypothetical drop to 350, essentially instantly (this could be done by both stopping fossil fuel use and launching a massive sequestering operation). At that point the surface ocean would outgas to undo about 1/2 of that drop. However, the ocean would not be able to sustain that outgassing beyond that. Furthermore that scenario is just as academic as my scenario. Finally, the ceasing of CO2 production in his scenario would still result in the same exponential decay as I described above which would, in a matter of a decade or two take us back down through 350ppm.Response:[DB] Not wanting to be the mouthpiece for Artful Dodger (as he is an extremely learned individual in his own right), Dodger was referring to the inertia of the Arctic as it struggles to reach temperature equilibria with the forcings acting upon it. This means the ongoing melting of the Arctic Sea Ice cap, the land-based permafrost and the observed melting of sub-seafloor clathrates, which will continue to happen for many decades/centuries even after (should it ever occur) after antropogenic GHG emissions cease).
While Dodger was venturing his opinion (which many who have taken the time to adequately research the matter share to some degree or fashion but choose not to publicly air those concerns), do not think that there is no scientific basis to his rationale.
In the absence of inertias, perhaps the case regarding CO2 concentrations would follow the route you outline. But as you indicate, that is primarily an academic exercise, rendered moot in the face of record GHG releases (30+ Gt in 2010) with no plan in place to even taper off said emissions (remember the old saw: "Those who fail to plan, plan to fail").
But thank you for taking the time to read furnished links and to place ensuaint comments on relevant threads. That is an utter delight, from a moderation perspective.
Prev 1580 1581 1582 1583 1584 1585 1586 1587 1588 1589 1590 1591 1592 1593 1594 1595 Next


