


 Arguments


Recent Comments
Prev 1592 1593 1594 1595 1596 1597 1598 1599 1600 1601 1602 1603 1604 1605 1606 1607 Next
Comments 79951 to 80000:
-
Paul D at 22:49 PM on 7 July 2011Great Barrier Reef Part 2: Climate Change Impacts
Tom - The weather observation directive I think pre-dates the Victorian Challenger voyage. I tacked on the comment about Challenger in addition to my initial comment. -
Eric (skeptic) at 22:48 PM on 7 July 20112010 - 2011: Earth's most extreme weather since 1816?
Here's an interesting paper about hail trends in China: http://iprc.soest.hawaii.edu/users/yqwang/xie_zhang_wang_grl08.pdf While the long term trend in CAPE is up, the freezing level heights are also rising and vertical sheer is dropping. Consequently the long term trend in annual hail days is down. -
les at 22:46 PM on 7 July 2011Climategate CRU emails suggest conspiracy
58 - JMurphy - yes, I was nodding in the direction of your post. I've been racking my mind to think of any organisation - publicly or privately funded - which tackles complaints in general and misconduct in particular, with anything but an internal panel of professionals from around the organisation; given that the complaint isn't a violation of national law. ...and I mean examples from within the modern western democracies - I'm not, of course, including the USSR, Maoist China etc. I'm sure no one on any part of the mainstream political spectrum would want to encourage political interference anywhere near that level... -
cynicus at 22:45 PM on 7 July 2011Lessons from Past Climate Predictions: Syun-Ichi Akasofu
Dana, thanks for the response. I've glanced through the paper again and notice that Akasofu also uses an 'interpreted' dataset for his 'theory', so I guess choosing the WfT Index seems warranted and perhaps even a better one. Although it clearly doesn't matter in light of the other criticisms. @14 Alex C, I don't know how I came to think that Akasofu used HadCRUT only. Now that I read it again this is clearly not the case. Must have had a blackout or something. Thanks for pointing it out. -
Papy at 22:26 PM on 7 July 2011Global warming stopped in
1998,1995,2002,2007,2010, ????
New study about chinese aerosol/sulphur cooling effect during the 2000s : (Reconciling anthropogenic climate change with observed temperature 1998–2008) "Given the widely noted increase in the warming effects of rising greenhouse gas concentrations, it has been unclear why global surface temperatures did not rise between 1998 and 2008" Are they aware of the exceptionnaly warm 1998-niño-year flaw in their decadal trend ? -
JMurphy at 22:18 PM on 7 July 2011Google It - Clean Energy is Good for the Economy
Good to see Cornwall (in the UK) doing its bit to provide clean energy (with more coming soon), while re-using an old tin mine : Solar park goes live Every little helps... -
Tom Curtis at 22:04 PM on 7 July 20112010 - 2011: Earth's most extreme weather since 1816?
Norman @283, while accepting the point about equilibrium, I should point out that although the temperatures peak in August, the difference in temperatures between north and south is greatest in winter, and greater in Spring than in Summer. I just made the comparison between Austin, Texas, and Chicago, Illinois (below); but I suspect it is a general feature: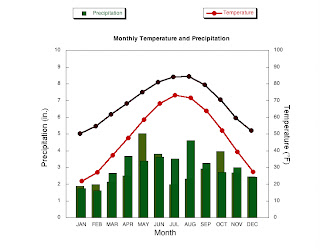 (Austin Temp - black; Precipitation - olive; Chicago Temp - red; Precipitation - Green)
Therefore we would expect the forces driving climate towards equilibrium would be stronger in winter and spring than in summer in the American mid-west.
Despite this, thunderstorms and tornadoes are generally associated with warmer weather. The logical conclusion is that they will be more frequent in spring than in summer, ie, when it is warm enough for super cells to form, but before the strong north south temperature gradient dissipates.
(Austin Temp - black; Precipitation - olive; Chicago Temp - red; Precipitation - Green)
Therefore we would expect the forces driving climate towards equilibrium would be stronger in winter and spring than in summer in the American mid-west.
Despite this, thunderstorms and tornadoes are generally associated with warmer weather. The logical conclusion is that they will be more frequent in spring than in summer, ie, when it is warm enough for super cells to form, but before the strong north south temperature gradient dissipates.
-
DLB at 21:39 PM on 7 July 2011Great Barrier Reef Part 2: Climate Change Impacts
After reading this article I am left with more questions than any answers to coral bleaching and the fate of the GBR. I have just read the Osborne paper (2011) and in it they describe how bleaching has had minimal effect on the GBR between 1995-2008 with coral loss quickly recovering after such events when compared to recovery from Crown of Thorns Starfish or storms. They also mention widespread bleaching events in 1998 and 2002 from which the coral quickly recovered. Looking at Fig. 5 (coral sea summer temp anomalies) for 1998 and 2002 were 0.4C and 0.3C warmer than the long term average. In most of the subsequent years SSTs have been well above 0.4C but I have not heard of any wide spread bleaching events during these other years? I found Fig.2 intriguing it is obvious that the reefs near the continental shelf were not bleached but why? Is it because there is mixing with deeper cooler water or is it due to some other reason like this region is nutrient poor? The bleached outer-barrier between Townville and Cairns was an exception. It made me think a warm current was running up the coast and exiting in this region. If the 1998 bleaching is due to warm waters temps I’d say it is probably due unusually strong solar heating of shallow water than anything to do with global warming. Finally I have had direct experience with coral bleaching. Around 2010 I was in the Capricorn Group at the Sth end of the Reef, it was the middle of winter and about 10-20% of the coral was bleached. The bleaching was not species specific nor was it depth related as coral just under the surface or 3m down exhibited the same amount of bleaching. Again it left me with more questions than answers -
Eric (skeptic) at 20:55 PM on 7 July 20112010 - 2011: Earth's most extreme weather since 1816?
Tom, #289, I would note that the Canadian Arctic is not as cold as it used to be last century. If that temperature is truly a factor in our severe weather, it could help explain why the incidence of strong tornadoes is dropping. -
CBDunkerson at 20:47 PM on 7 July 2011Over the tipping point
Ranyl wrote: "Wonder what weather changes the rapid loss of arctic summer ice will bring?" Yeah, that's the looming question. The problem is, as the article notes, it is just such a huge change that we can't tell what will happen. Will the removal of the sea ice allow a strong Pacific to Atlantic current to develop through the Arctic ocean? Will that change the course of the Gulf Stream and thus replace warm North Atlantic waters pulled up from the equator with frigid waters pulled down from the North Pole? Will the albedo shift be enough to warm Arctic waters to the point that clathrates release large amounts of methane into the atmosphere? What will all these changes do to the melt rate of the Greenland ice cap? And if the weather has been on a crazy roller-coaster ride for the past couple of decades what will a fundamental change to the planet's climate system provoke? The whole world is about to get a first hand demonstration of why the saying, 'May you live in interesting times', is considered a curse. -
Eric (skeptic) at 20:43 PM on 7 July 20112010 - 2011: Earth's most extreme weather since 1816?
Albatross, in this post on a related thread you mentioned Stanley Changnon. His paper on hail trends is here: http://journals.ametsoc.org/doi/abs/10.1175/1520-0442%282000%29013%3C0658%3ALTFIHI%3E2.0.CO%3B2 First the caveats: he has the typical selection bias found in many studies: "high quality". That's unfortunately often different from "randomly selected" or "representative". Second, his study shows hail increasing in the Plains and SE U.S. where hail is more common. Third, the study period ends in 1995. Fourth it's all hail, not severe hail. That said, he claims that overall U.S. hail incidences peaked in mid-century. -
Tom Curtis at 20:42 PM on 7 July 20112010 - 2011: Earth's most extreme weather since 1816?
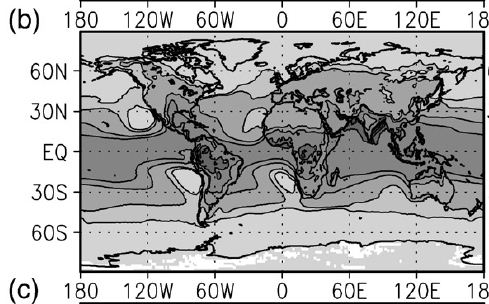
Albatross @269, first and most importantly, thanks. However, I still have some questions. It has always been my understanding that the US midwest has the most severe thunderstorms on Earth, something I could have been clearer about in my 258. However, I have also understood this to be a more or less unique feature of the US as a result of its unusual geography, specifically the very cold canadian arctic linked to the very warm caribbean. I notice that the Argentine plains are also noted for intense storms. However, I suspect that this is again due to peculiarities of geography, specifically the conjunction of cold dry winds aloft due to the Humboldt current and the Andes, and warm humid conditions below due, in part, to the Brazil Current. My question is, to what extent do these regions owe there intense thunderstorms to their peculiar geography, and to what extent to their mid-latitude location? Or perhaps better, are storms more frequent and intense in the tropics except under unusual geographical circumstances which promote thunderstorm and tornado formation? I continue to believe the lightning map gives a reasonable representation of thunderstorm frequency and intensity. As can be seen above, within the US lightning frequency (top) correlates well with tornado frequency (bottom). (Norman should also note that tornado frequency increases with greater warmth, and also with proximity to the Rockies.) Clearly it needs to be interpreted more cautiously than I did before, in that either different types of storms having different frequencies of strikes, and/or differences of seasonality can distort the result, especially given the clearly stronger CAPE in tropical regions:
-
JMurphy at 20:15 PM on 7 July 2011Climategate CRU emails suggest conspiracy
Very true, les. Having posted a link previously to the guidelines for such a enquiry (To establish a means to handle inquiries and/or investigations into questions of ethics related to research and other scholarly activities), it would appear that such guidelines are fine for everyone except those like Dr Mann, who, presumably, should be subject to the full force of criminal law - as long as it leads to serious consequences for him. If such a legal route were also to acquit him, then the legal route must also be dismissed as biased and part of that all-encompassing conspiracy, Mann will then be judged by the blog 'scientists' and commentariat, and their followers, in the docks of the Denialosphere. In the end, nothing will satisfy some people except the public humiliation of climate scientists, following a show-trial decided by debate and a show of hands... -
les at 19:46 PM on 7 July 2011Climategate CRU emails suggest conspiracy
It would seem a large number of people would like PennState to break the law over this. Universities function under three things: National laws, their bylaws/regulations and their charter, given them by the government. Their regulations state how accusations of misconduct (in teaching or research) should be treated. This comes under the terms of their charter and if they do not respect those procedures the government can have an external enquiry, remove their charter and they're out of business. On the other hand, any acts which violate national law is prosecuted in court. Justice is blind. No one can decide, outside of the described terms, that some situation is big enough or annoying enough or news-worthy enough to treat in a special or partial way. That is corruption. What batvette and others are advocating is that people should act corruptly and treat some complaints differently to others because, well, they just feel they should. Pointing at the system and saying "well, that looks like 'good 'ole boy' culture" either has to be substantiated and tackled under national law or has to be seen as a bit of a 'look! rabbit!' trick to distract from their desire for lynch-mob 'justice'. -
les at 19:31 PM on 7 July 2011Peer review process was corrupted
Interesting article on Soon: Climate sceptic Willie Soon received $1m from oil companies, papers show -
Tom Curtis at 18:57 PM on 7 July 2011Great Barrier Reef Part 2: Climate Change Impacts
PaulD @2, the observations may well have been for scientific reasons. If they were ordered by Rear Admiral Sir Francis Beaufort then a scientific motivation was certainly of great (though not exclusive) importance in ordering the observations. The secondary reason, and the reason the British Navy funded the many expeditions Beaufort ordered (including that of the Beagle), was to both chart the waters of the world, and likely sea conditions so that the British Navy could operate confidently in all the waters of the world. However, I have to disagree with Adelady's initial observation. Although wide spread bleaching would have been obvious to ships in a given area, many areas including most of the Great Barrier Reef were not frequented by ships until the late 19th century. The most efficient routes from Australia to England (and back) where along Austalia's southern coast. Those ships travelling north would have stuck to the main channels. As it is, it is difficult to get a 19th century cyclone history of Queensland waters, still less a bleaching history (assuming there was any bleaching). -
adelady at 18:40 PM on 7 July 2011Great Barrier Reef Part 2: Climate Change Impacts
I guess it wasn't for scientific reasons... Not as we understand it. But there were 2 driving forces at the time. The prime one being survival. Sailors take a great deal of notice of changes in their environment. Either to recognise something unusual in familiar circumstances - is it dangerous? does it affect the fishing? does it affect tides/currents/weather? Or second. Old-fashioned naturalists noted observations of all sorts of things. Modern people do the same. First sighting of the season of certain birds, date of budburst or harvest dates for crops. For sailors, what indicates land is near but out of sight. What does or doesn't indicate fish, or desirable fish, in the area? Which waters are clear, murky, turbulent at various times of the year - does it matter just now? Knowing the best winds and currents was a matter of profit. Knowing the best time to venture into the best fishing grounds likewise. A lot of general knowledge was gained for the purpose of power or profit. But it was knowledge nevertheless. And of course, some of the expeditions were designated as scientific. A lot of mapping was related to power relations and claims on territory, but a lot was also an expression of what we now recognise as straightforward scientific curiosity. -
Paul D at 18:03 PM on 7 July 2011Great Barrier Reef Part 2: Climate Change Impacts
Adelady, I think it was a formal part of a Royal Navy captains job to make weather measurements on a daily basis. Failure to do so was a dereliction of duty. I guess it wasn't for scientific reasons, the need for such information was related to political power and domination of the seas. I only recently found out about the Challenger exhibition: http://en.wikipedia.org/wiki/Challenger_expedition I had never heard of it before until it was mentioned on a TV documentary. -
DLB at 17:49 PM on 7 July 2011Great Barrier Reef Part 1: Current Conditions and Human Impacts
John, I tend to agree with you about the effects on the reef of deforestation but I would imagine much of the clearing for cane and dairying was late 19th to early 20th Century. -
adelady at 17:29 PM on 7 July 2011Great Barrier Reef Part 2: Climate Change Impacts
"...mass coral bleaching events may have occurred in the past but we've only just begun to notice them. ..Firstly, mass coral bleaching events are hard not to notice. When a reef undergoes mass coral bleaching, there is a brilliant white colour that can be seen from passing satellites. Secondly, these events cover hundreds of square kilometres of territory when they occur,..." No need for satellites, or even planes. We should remember that in earlier times, naval, merchant, scientific, fishing and whaling vessels made formal detailed observations in their logs. In the case of Britain, worldwide observations for centuries. Where such formal recordings were lacking, informal conversations with other sailors in shore based pubs and the like would surely have spread the word on weird and wonderful things observed on various voyages. Fishing and coastal merchant vessels often travel the same routes repeatedly. They would surely have noticed such extreme changes in the areas they know in detail. -
les at 17:11 PM on 7 July 20112010 - 2011: Earth's most extreme weather since 1816?
With reference to the post 283 - Norman*. "The above is an example of chemical equilibrium but in my view I think it is a Universal concept that applies to many branches of science." For a start; not all chemical reactions are equilibrium; and for those who are fond of Wiki...
Non-equilibrium thermodynamics is a branch of thermodynamics that deals with systems that are not in thermodynamic equilibrium. Most systems found in nature are not in thermodynamic equilibrium
"My understanding of weather and most physical systems is that as they get closer to equilibrium, intensity is diminished."
In physics two kinds of dynamics exist which may be though of as static equilibrium and dynamic equilibrium. An example of the former is a bicycle at rest; its stable point is when it falls on its side. An example of the latter is a bicycle in motion; it's stable point - upright - is still a minimum but requires work input.
There's no natural fact of the matter that all systems are one or there other (any more than all systems are 'predictable' as in Newtonian dynamics).
Often, but not always, non-equilibrium dynamics is closely linked to chaotic systems. Due to friction etc., most systems which exhibit chaotic dynamics will drop out of chaotic mode unless energy is input... but when energy is input; the systems can remain around fixed attractors ... they are in dynamic equilibrium.
I'd suggest that the weather is, indeed, a dynamic system with many equilibria points amongst which bits of it switch. IMHO appeal to and faith in equilibrium dynamics is equivalent to the same error as the 'predictability' discussion.
*Note: I'm not addressing this to Norman since it's clear that when people post things which contradict his fundamental understanding of how the world works, he just ignores it; as in the case of the predictability of systems. This is for general discussion and consideration of the general reader.
and for those who are fond of Wiki...
Non-equilibrium thermodynamics is a branch of thermodynamics that deals with systems that are not in thermodynamic equilibrium. Most systems found in nature are not in thermodynamic equilibrium
"My understanding of weather and most physical systems is that as they get closer to equilibrium, intensity is diminished."
In physics two kinds of dynamics exist which may be though of as static equilibrium and dynamic equilibrium. An example of the former is a bicycle at rest; its stable point is when it falls on its side. An example of the latter is a bicycle in motion; it's stable point - upright - is still a minimum but requires work input.
There's no natural fact of the matter that all systems are one or there other (any more than all systems are 'predictable' as in Newtonian dynamics).
Often, but not always, non-equilibrium dynamics is closely linked to chaotic systems. Due to friction etc., most systems which exhibit chaotic dynamics will drop out of chaotic mode unless energy is input... but when energy is input; the systems can remain around fixed attractors ... they are in dynamic equilibrium.
I'd suggest that the weather is, indeed, a dynamic system with many equilibria points amongst which bits of it switch. IMHO appeal to and faith in equilibrium dynamics is equivalent to the same error as the 'predictability' discussion.
*Note: I'm not addressing this to Norman since it's clear that when people post things which contradict his fundamental understanding of how the world works, he just ignores it; as in the case of the predictability of systems. This is for general discussion and consideration of the general reader.
-
batvette at 16:53 PM on 7 July 2011Climategate CRU emails suggest conspiracy
@JMurphy: The only disinformation is your continued accusation that's what I am doing when I state: "Michael Mann's conduct was examined by an internal, not independent, review board of the entity which employed him and stood to lose credibility if it were revealed he acted improperly." Which I simply asked you to point out what about it was such- you could not, [inflamatory deleted] [inflamatory deleted] ... that because University of Pennsylvania faculty members are from different departments than Dr. Mann, this constitutes an unbiased form of review in a matter which could place the institution's reputation at stake, but buying I'm not. This form of review which is standard at large universities is fine and dandy for matters of scope on a scale of student-teacher interactions, academic controversies like scoring papers, etc. When their work becomes influential enough that it leads to national and international policy affecting all of our lives being forged down the road, it is wholly inadequate and amounts to "good 'ole boy" culture of corrupt justice. You provide a passage which supports just what I am saying, inasmuch as it describes how these faculty members should not have a "conflict of interest", if you can describe how they all do not share the same interests of being faculty members under the employ of the same institution I'm all ears.Moderator Response: [Dikran Marsupial] Please acquaint yourself with the comments policy; any more of this inflamatory tone from any participant on this thread and I will start deleting posts. -
Albatross at 14:52 PM on 7 July 20112010 - 2011: Earth's most extreme weather since 1816?
Norman @285, Sigh. Some of us have tried really, really hard to inform you on the science, but its seems a lost cause I'm afraid. Norman, I know hail pretty damn well. I can't say why that is, but I urge you to please take my word for it. Now with that in mind, you are glibly dismissing a peer-reviewed journal paper because of something that you read on Wikipedia. Wikipedia can be OK, but the following statement is not accurate and perpetuates at least two popular myths (can you spot them?): "Unlike ice pellets, hail stones are layered and can be irregular and clumped together. Hail is composed of transparent ice or alternating layers of transparent and translucent ice at least 1 millimetre (0.039 in) thick, which are deposited upon the hail stone as it cycles through the cloud, suspended aloft by air with strong upward motion until its weight overcomes the updraft and falls to the ground". As for the claim about freezing levels, that is true, but only to a point and in fact when one actually looks at the physics and thermodynamics the freezing level is not that critical severe hail because the high terminal velocities of the large hailstones results in them having a relatively short residence time below the melting level. Florida storms have produced severe hail with ridiculously high freezing levels and relatively weak ambient lapse rates. And last but not least Norman, had you bothered to look at the sounding I showed in my post @269 (you know the one for the almost 3 inch diameter hail), you will have noticed that the ambient freezing level was over 14400 ft! One reason for the paucity of hail in the tropical regions is that those environments have very weak lapse rates (especially over the oceans) and as a result they have what we call "skinny CAPE", which means that the CAPE is distributed over a great depth and that the mean difference between the updraft temperature and the ambient air is relatively small-- the end result is relatively weak updrafts despite high CAPE. Any hail that is then produced in the short-lived updraft is relatively small and much more likely to melt before reaching the ground. I can back this all up with references, but I am not willing to waste more time on this only to have contrarians repeatedly and glibly dismiss the science. Now I suppose someone in the know is going to have to try and fix that Wikipedia page.... -
scaddenp at 14:49 PM on 7 July 20112010 - 2011: Earth's most extreme weather since 1816?
"I have not yet seen a tipping point in any yearly cycle. Everything seems to change gradually." Why would you expect otherwise? CO2 changes gradually too. "Tipping point" ideas arent really mainstream science. Best one I can think of would be arctic melt where beyond a certain point, change in albedo might make for feedback loop that would require substantial drop in other forcing to reverse. Another might be catastrophic release of hydrates but these are highly debatable points. I see no expectation of tipping points in original article or in these discussions. -
Norman at 14:14 PM on 7 July 20112010 - 2011: Earth's most extreme weather since 1816?
Albatross @ 269 "Extrapolations of the historical relations between hailstorm damage and weather indicators under climate change scenarios project a considerable increase in future hailstorm damage." I am not sure how this gentleman came up with this conclusion. Based upon what actually is happening with hail... "Hail is most common within continental interiors of the mid-latitudes, as hail formation is considerably more likely when the freezing level is below the altitude of 11,000 feet (3,400 m).[13] Movement of dry air into strong thunderstorms over continents can increase the frequency of hail by promoting evaporational cooling which lowers the freezing level of thunderstorm clouds giving hail a larger volume to grow in. Accordingly, hail is actually less common in the tropics despite a much higher frequency of thunderstorms than in the mid-latitudes because the atmosphere over the tropics tends to be warmer over a much greater depth. Hail in the tropics occurs mainly at higher elevations.[14]" Hail. Based upon the places hail falls, it would seem a warmer climate would inhibit hail from reaching the ground. -
Norman at 14:10 PM on 7 July 20112010 - 2011: Earth's most extreme weather since 1816?
Side note I almost forgot about. Half the globe experiences extreme global warming every year. 41.4 F in US from Winter to Summer. We can observe the behavior of extreme global warming every year. I have not yet seen a tipping point in any yearly cycle. Everything seems to change gradually. It is not winter one day then spring then summer. All the changes are gradual. There is not a light switch flip on climate change to every indicate the realtiy of a tipping point mechanism. There may be a few days that are way above normal or below in the gradual cycle but no tipping point at all. -
Norman at 14:05 PM on 7 July 20112010 - 2011: Earth's most extreme weather since 1816?
DB and Dikran Marsupial, Research I have conducted tonight to try and demonstrate why I am of the opinion that Global warming will not necessarily increase severe weather. I do believe Global Warming will produce Climate Change. I have evidence of that every year. One half of the globe warms drastically every year and the climate changes drastically with this warming. It is a fact and one I do not argue. Severe weather is the point I am not convinced off. The physical reason behind this postiion I take. It is based upon my understanding of equilibrium. Example of Chemical equilibrium. The above is an example of chemical equilibrium but in my view I think it is a Universal concept that applies to many branches of science. When a system is far from equilibrium the reaction rate is more intense, as the system approaches equilibrium things slow down, the reaction rate slows down until it final show no action. Weather is driven by a system far from equilibrium. Very cold poles in relation to a warm equator. Cold air get dense and heavy while warmer air gets lighter and rises. These differences in air density vs temperature drive the weather patterns. Adding moisture to the mix increases the complexity but does not change the fundamentals of equilibrium science. Air moves from the north (at ground level) to the south as it is heavier (in Northern Hemisphere) and south to north in the upper atmophere and drives the weather cycles. If all points on Earth were at the same temperature there would be no weather since it would have reached equilibrium. Now to determine if the physics behind this thinking have any relationship to the real world. I went to the NOAA site to get the average temperature of the US. (The region of the US is the test field to demonstrate that the physics of equilibrium does play a strong role in weather). Page I obtained average US monthly temps. Jan: 32.5 F (all temps in Fahrenheit scale) Feb: 34.7 (20th Century Mean temps) March: 42.4 April: 52.0 May: 61.0 June: 69.3 July: 74.2 August: 72.8 Sept: 65.4 Oct: 54.8 Nov: 42.5 Dec: 33.4 Because the month's of July and August and have the most atmospheric energy, Jeff Masters hypothesis would indicate that these two months should have the most severe storms. Further information to reinforce this concept. In Albatross's excellent post on thunderstorms above in 269 "The important part. Crook (1996) showed that by manipulating equation (1)increasing the low moisture by 1 g/kg increases the CAPE by 2.5 the amount as a 1 C warming of the low-level air would. So changes in near surface specific humidity of 10% or so of typical background values can have a huge impact on the buoyancy available to a storm, and in turn the maximum updraft strength-- as found by the papers I cited in one of my posts above." And his conclusion based upon this data. "So the short of it is that increasing the low-level moisture is likely to increase the chances for more intense/severe thunderstorms, and perhaps larger hail too." Here are two more links with Albatross's information. Check chart with Gulf of Mexico water temp. This chart shows July and August have the warmest Gulf Coast water. Next data group. Humidity in 100 US cities. Humidity of 100 US cities by month. If you click on May and August then check out Kansas City it is 54% for both months. I am using Kansas city as one point in an overall thesis to demonstrate a point. Any city will do I have already listed the average temps of the US above. This spot check is for moisture related test. Kansas City monthly temps. Fairly similar to the National average. Local temp May is 12 F cooler than August. National average May is 11.8 F cooer than August. This is significant when considering Albatross's quote on severe thunderstorms. Kansas City Monthly precipitation. Kansas City has almost an inch more of rain in May and June as compared to July and August. July and August would have much more potential energy for more severe weather than May. The Relative Humidity of May and August are the same but the temp is over 12F warmer. That means the August air is holding much more moisture and latent energy that can drive storms. Yet the preciptiation is lower. Also the source of the fuel, the gulf stream, is warmer meaning more moisture can be evaporated for storms in August. Now back to the National stats. I have posted the National monthly average temperature above. Now here is a really good proxy for severe thunderstorms. Number of tornadoes. Look at May and June then at July and August (this is for the whole Nation so it is not the isolated Kansas City topic) Total count of tornadoes in the US. So May has many more tornadoes than August, yet August has far more energy than May. What causes this? My understanding of weather and most physical systems is that as they get closer to equilibrium, intensity is diminished. To demonstrate. The average May temp of Yellowknife, Canada (way up North) is 41F. Atlanta, Georgia (one of the warm southern spots that air moves across to fuel severe storms) is 69.75F. Difference in temp is 28.75F In July the diference between these points 19.5F and in August it is 20.9F. The difference between the hot and cold air is less and is closer to equilibrium. That is why I feel the weather will not get more intense. I think the number of severe storms in May and June bring up a lot of latent heat to higher elevation warming that air mass. This reduces the instability of the air. The air was cooled during winter and as the warm moist air from the Gulf moves into this unstable air (cold uppper level air that allows for strong upward acceleration of warm moist air). So the very nature of the most severe thunderstorms, bringing latent heat to upper levels of the troposphere, actually bring equilibrium and suppress what should be the most severe weather in July and August as this is the air with the most potential energy. Also the temperature difference between Northern and Southern air is more extreme in May than August. This will lead to stronger winds that are moving to achieve an equilibrium. As the air masses come closer in temperature the winds are not as intense and there are less supercell storm formation. That is why I have a very difficult time accepting the models that project more intense storms as the globe warms. That was my point with Dikran Marsupial and science. If a climate model cannot predict in the range it is designed for then it is a useless scientific tool. Even if I am not adept at chaos theory or it subtle behavior, my lack of knowledge of this subject would not make a bad model good. With the nature of CO2 forced warming, it is acting in a way that should very much suppress, not inflate severe weather patterns. The poles are warming faster than the equator. This means the air is reaching an equilibrium state faster than seasonal cycles will propel it.Response:[DB] "One half of the globe warms drastically every year and the climate changes drastically with this warming."
You refer to the seasons here, which are part and parcel of the climate, and do not change it. You set up a straw man and proceed with tedium to knock it down. Think not that you can convince through dissembling volume what you cannot achieve through logic and merit of argument.
Until you can mount a position of substance based on sound analysis and rooted in physical processes, which you have not yet demonstrated to date, others would be well advised to ignore your contrarian efforts to further derail this thread.
-
Eric (skeptic) at 12:57 PM on 7 July 20112010 - 2011: Earth's most extreme weather since 1816?
From my local (Northern Virginia) forecast discussion: "this will place the area on the srn periphery of stronger westerlies and nrn periphery of a moist-unstable airmass. with this setup...we will have to monitor the potential for MCS activity next week." (weather.gov) Now that strong spring and early summer fronts are pretty much history, our severe weather would mostly come from thunderstorm complexes that move SE with the jet stream carrying their own supply of cooler, drier air like a well defined front would have. In contrast the next week's forecast further south (Georgia) is nothing much (too much warm air aloft for thunderstorms). This pretty much follows our pattern of a peak in severe TS in spring (early south, later north) followed by sporadic severe TS in summer. -
Norman at 12:32 PM on 7 July 20112010 - 2011: Earth's most extreme weather since 1816?
DB @ 267 "But unless you can prove that these extremes currently being experienced are NOT due to human-influence and that you have physics-based hypothesis' supplemented by solid statistical analysis to back up your contentions, then you are just being contrarian and most here will no longer waste any of their valuable time trying to help you gain understanding." Good point. It does take time to develop ideas. My point of posting on this website was to gather information to learn what is already out there and progress with the concept I am developing in greater depth. I come here with some hope. Conspiracy sites are nothing but HAARP, media web sites are only some person's opinion. No depth, no science, no research. So many webpages are making the claim weather is intensifying and it is because of Global warming but no one is offering mechanisms of why they think this. I read Jeff Masters article. He is a PhD in meterology and I was hoping to read some mechanisms or behind the scenes physics but it was much the same. The idea of a warming world does go against what I have come to know about the weather via experience and observation. This does not mean that what I know is valid or correct. I may be working on a wrong assumption. I have been on this site awhile and have read many posts. It seems that many intelligent and knowledgeable people post and this would be a place to test ideas and theories. If they are wrong the errors will be pointed out. If I have become dull or "thick-headed" with my posts, I apologize. I do have reasons for them. -
Doug Mackie at 12:17 PM on 7 July 2011OA not OK part 2: Thermodynamic duo
Thanks Hugo, we appreciate your interest, but please be patient. This is post 2 of 18. We will get there. It would be fair to say that one of the many motivations to write this series was what we see as misconceptions in your seawater equilibria post at Skeptical Science. Most of the responses to your thoughts, here and in that post, can be addressed by responding to a single point. You said:Taking a solution of dissolved carbon dioxide, bicarbonate, carbonate, calcium ion and water ... to be in equilibrium with solid calcium carbonate and gaseous carbon dioxide...
While equilibrium chemistry is indeed quite simple, it is an inconvenient fact that the ocean is not in such an equilibrium. It is very important to remember that non-equilibrium systems behave quite differently to equilibrium systems. This fact changes much of what you have said here and in your previous posts. -
Eric the Red at 11:52 AM on 7 July 2011Lessons from Past Climate Predictions: Syun-Ichi Akasofu
wingding, The temperature anomly is a 5-year moving average. The GISS 5-year moving average has been ~0.55 for the past 8 years, Had CRUT was about 0.1C lower 8 years ago, and has declined slightly since. If you go back to Figure 2, most of the proxies hit a low point in the early 19th century, and have shown a similar increase in both the 19th and 20th centuries. -
Michael Hauber at 11:21 AM on 7 July 2011Lessons from Past Climate Predictions: Syun-Ichi Akasofu
Shorter Akasofu: Assume that the warming trend from 1880 to now was caused by natural causes. Therefore this warming cannot have been caused by human emmitted Co2. Even though humans have been emmitting Co2 over this entire time period. -
Bern at 11:00 AM on 7 July 2011Lessons from Past Climate Predictions: Syun-Ichi Akasofu
Icarus: Very good point. I liken this sort of 'LIA Recovery = linear upward trend' argument, to a man standing on the beach at mid-tide, screaming in panic because the water is rising and soon the entire world will be flooded... Although I'm sure there will be plenty of deniers who would twist that around the other way when talking about climate science, the obvious point is that a model based on curve-fitting a short period of data can give you very bad results, while a model based on an understanding of the physical mechanisms that drive the tide will tell you to walk five paces up the beach and relax. The difference now, of course, is that the curve-fitters are the ones telling us to relax, while the folks looking at the physical mechanisms driving climate have got seriously worried looks on their faces... -
Eric (skeptic) at 10:55 AM on 7 July 20112010 - 2011: Earth's most extreme weather since 1816?
Albatross, thanks for the links. I read through Dai and it shows an upward trend in RH and paints a bigger trend for the central U.S. (fig 10a) where we have plenty of thunderstorms. On top of that trend are the fluctuations from the patterns, particularly ENSO (basically lower RH in La Nina and higher in El Nino). That may be primarily due to the relationship with temperature. I'm not sure how well severe convection correlates with the trend and the fluctuations. There are many different papers with various measurements and fluctuations but I have yet to find one with a clear or even tentative correlation with the RH trend and fluctuations shown by Dai. -
Bern at 10:33 AM on 7 July 2011Over the tipping point
@villabolo: don't forget CO2 emissions from concrete and steel manufacture also. Certainly they're a relatively small part, compared to the electricity generation. And they'd certainly be manageable. There are even alternatives for steel - e.g. direct reduced iron instead of coke-fired blast furnaces. Either way, a wind turbine produced using the dirtiest of brown-coal-fired electricity is *still* one of the lowest-carbon sources of electricity we have available to us. It's certainly an awful lot better than continuing to burn that brown coal... -
Bob Lacatena at 10:17 AM on 7 July 2011Lessons from Past Climate Predictions: Syun-Ichi Akasofu
12, dana1981, Alas, I cannot take credit for "climastrology." skywatcher just introduced the term over on a comment over at "What does past climate change tell us about global warming." He goes on to say a quick google shows he's not the first either. And then I came here, and low and behold, it was the perfect example of climastrology in action. The timing was just too good. -
Bob Lacatena at 10:12 AM on 7 July 2011Climate's changed before
Sorry, I meant climastrologist sighting, not climatologist sighting. -
wingding at 10:10 AM on 7 July 2011Lessons from Past Climate Predictions: Syun-Ichi Akasofu
Comment #1 claims that Akasofu used HadCRUT. I am quite sure he actually used GISTEMP land only. The red line on his chart continues at the same slope through the 2000s. The 2010 anomaly was 0.83C, which if anything appears to be *above* the top end of his drawn "IPCC prediction curve". In the public paper he's switched to using NOAA land+ocean. The circle for 2008 is still there although it is plotted incorrectly at the position of 2011. Akasofu's cycle also now peaks around 2010 in the published paper rather than 2000 as it does in the unpublished graph above. Similarly the IPCC "coned" projection is shifted along to begin around 2010 rather than 2000. -
BBD at 08:42 AM on 7 July 2011Lessons from Past Climate Predictions: Syun-Ichi Akasofu
Eric the Red #9 WfT is a data visualisation tool that we are lucky to have. Its pro bono creator Paul Clark makes his methodology transparent. Let's not get carried away. -
ifonly at 08:33 AM on 7 July 2011Climate Cherry Pickers: Falling sea levels in 2010
One big problem for layman is that Goddard using data up to March 2010 if asked would have said in 12 months time the oceans will most likely be lower and John Cook would have said the oceans most likely will be higher. So, just as picking a longshot horse or stock doesn't make you an expert (you may just be lucky) people will pay attention to "winners" until their predictions are shown to be wrong.Jason1 -
scaddenp at 08:04 AM on 7 July 2011Increasing CO2 has little to no effect
"What big error bars you have". Yep, climate models are for forecasting climate. They are no good at shorter scales because the climate system has a lot of internal variability. They are good for 30 year trends, not next years temperature. I think this discussion belongs in models are unreliable. -
scaddenp at 08:00 AM on 7 July 2011Increasing CO2 has little to no effect
"So the statement “model parameters can be adjusted to match any set of temperature observations" is not true? " Of course not. Even a brief look at papers on model parameterisation, or a look at the FAQ at realclimate would show that model parameters are not "fitted" to temperature. This is a common denialist assertion repeated without a shred of supporting evidence. If you are going to repeat it, then I do not think it unreasonable to ask for a paper showing a model parameter that was tuned to global temperature. I would also suggest looking at RC post on what IPCC models really say. You might also consider how successful Wally Broecker was at forecasting 2010 temperature in 1975, using results from a model so primitive that it didnt have parameterizations. -
Icarus at 07:56 AM on 7 July 2011Lessons from Past Climate Predictions: Syun-Ichi Akasofu
Akasofu's data is wrong in *both* directions (i.e. both the recent temperature trend, which is still upwards, and the temperature before 1880) -
-
Riccardo at 07:51 AM on 7 July 2011Lessons from Past Climate Predictions: Syun-Ichi Akasofu
Eric the Red Akasofu did not use any particular dataset to make his projection. He added a multidecadal (armonic?) oscillation (PDO) to a linear fit (recovery from LIA), that's it. If his "model" is so sensitive to the choice between two very similar datasets (I invite you to compare the two) I'd say that the "model" is weak, to say the least. Anyways, this discussion leads us nowhere, there are much more solid reasons to dismiss the "model", as highlighted in this post and by others in the comments. -
KR at 07:24 AM on 7 July 2011Lessons from Past Climate Predictions: Syun-Ichi Akasofu
Eric the Red - "Whether his predictions is based on physics or not will not matter..." That, Eric, is a horrifying statement to read in a scientifically oriented discussion. It gives me roughly zero confidence in your critical and analytic abilities. Curve fitting without physics is just numerology, or "chimps and buckets", as Dikran noted. It has no predictive power, no scientific insights, as it doesn't contain any cause-effect relationships, or even statistical correlations. As many of the causes of climate change (anthropogenic gases come to mind, for some reason) aren't changing along a NNN year repeating sine wave, extracted curves just aren't going to be helpful for predictions. Cause-effect relationships, on the other hand, are. Akasofu has not explained the 'linear warming' since the LIA (which, incidentally, isn't linear, as the OP points out), and in fact makes no attempt to connect to causes or physics. It's just curve fitting, and with enough degrees of freedom you can fit anything. But predict, no. If you have the cause-effect relationships understood, you can predict what will happen to the climate as the causes (emissions in particular) change. With a close fit of something that doesn't have violent trajectory changes (like global temperature averages, sufficiently smoothed) even the simplest curve fit will fit for a brief while. But that's not predictive of cause and effect, just a symptom of limits to the rate of trajectory change. It tells us nothing about long term behavior of the climate system. This is a very sad, very bad paper.Moderator Response: (DB) ETR's comment was deleted for trolling for the reasons you mention. -
Eric the Red at 07:08 AM on 7 July 2011Lessons from Past Climate Predictions: Syun-Ichi Akasofu
FYI, the temperature graph in Figure 5 above is referenced as NOAA in the recent paper. http://www.climatewatch.noaa.gov/article/2009/climate-change-global-temperature -
dana1981 at 06:35 AM on 7 July 2011Lessons from Past Climate Predictions: Syun-Ichi Akasofu
Very good point Jeff T - if there were such a thing, the global temperature has already "recovered" from the LIA, and overshot that recovery. -
Jeff T at 06:15 AM on 7 July 2011Lessons from Past Climate Predictions: Syun-Ichi Akasofu
Akasofu has a serious internal contradiction. If the temperature increase over the last two centuries is a "recovery," then one can estimate how close it is to fully recovered from the (downward!) curvature of the data. If the data are truly linear, as Akasofu claims, the system is far from fully recovered. In that case the recovery will take temperature far above even the highest claims for medieval warming. But a temperature far above the previous maximum can hardly be considered a recovery. In fact, as others have said, the curvature actually appears to be upward. Thus, the "recovery" seems still to be starting and is headed a long way up. -
BKsea at 06:04 AM on 7 July 2011History Matters: Carbon Emissions in Context
To me, the conceptual problem is that we draw the bathtub around just the atmosphere. In reality, the bathtub contains the atmosphere, the ocean (OA anyone?), and the plants. Very little CO2 is coming out of this tub and human emissions of CO2 are by far the main input to the bathtub. Something has to overflow. -
villabolo at 06:04 AM on 7 July 2011Over the tipping point
@3. Paul D "Wind turbines are not zero carbon systems, they are very low carbon systems, as are most renewables and sustainable systems." Paul, the necessity to burn FF to produce any form of alternative power is an initial cost only. Once we get to the point where a substantial fraction of our energy comes from alternative sources, the clean energy they generate will make a substantial contribution to the manufacture of any further windmills etc. Therefore, clean energy will get to the point where it will produce more clean energy while reducing and soon replacing all FF.
Prev 1592 1593 1594 1595 1596 1597 1598 1599 1600 1601 1602 1603 1604 1605 1606 1607 Next


