


 Arguments


Recent Comments
Prev 1593 1594 1595 1596 1597 1598 1599 1600 1601 1602 1603 1604 1605 1606 1607 1608 Next
Comments 80001 to 80050:
-
Alex C at 05:38 AM on 7 July 2011Lessons from Past Climate Predictions: Syun-Ichi Akasofu
@cynicus at 00:19 AM on 7 July, 2011: Akasofu used HadCRUT? I recall him referencing several temperature datasets in his paper, and the figure in the article above (the red/blue "cycle" one, Figure 1) is an interpretation based off of GISS, HadCRUT3, NOAA, so on, but I don't think that he specifically used HadCRUT for any major conclusions of his. For the more general audience, in any case, since it was Riccardo who had used HadCRUT in his article that Dana referenced, the accusation of a cherry pick toward that choice is rather weak, and calling the usage of an average of datasets a cherry pick itself is even weaker and simply silly. In the context that the HadCRUT data was used as well, it isn't obvious to me that the choice of data is even relevant, since the principle of trend choice still applies. Without a physical justification for a trend, and thus with trend order being arbitrary, the residuals will show a cycle within a certain trend and not show it in others. To say there's even a well-defined cycle at all is specious. No matter the data set you're using, this will still apply, especially in the case where the different data sets are so similar in behavior over the time period. -
AuntSally at 05:23 AM on 7 July 2011Lessons from Past Climate Predictions: Syun-Ichi Akasofu
Nice deconstruction. It's also worth noting that the journal in which the pared-down paper was finally published (Natural Science) is not on the ISI listing -- which is to say, does not meet the accepted standard as a for bona-fide peer-reviewed journal. This isn't too surprising, as I'm guessing many of the issues raised by Dana's analysis would (or perhaps did) prevent publication in an actual journal. -
dana1981 at 05:05 AM on 7 July 2011Lessons from Past Climate Predictions: Syun-Ichi Akasofu
Eric #9 - Sphaerica and Dikran have already done a good job responding to your rather absurd comment. If you think physics doesn't matter, I'm not sure why you're reading a science-based site like SkS to begin with. And if you think taking the composite of 4 datasets is cherrypicking, I suggest you look up the definition of the term. Also see my response to comment #1. By the way Sphaerica, I like your term "climastrology". That gave me a good chuckle. -
JMurphy at 04:19 AM on 7 July 2011Increasing CO2 has little to no effect
thepoodlebites, how do the error bars affect that black line you can see in the first graph, which is labelled 'IPCC Ensemble', and around which the actual temperature records are congregating ? -
les at 04:12 AM on 7 July 2011Climate's changed before
What I don't understan is why Mr. Cotton didn't post on the Akasofu thread to protest that his epicycles are more true then those epicycles. I mean, they can't both be right, surely? Without physical reality as the final arbitrator, it should be a good bit of sophistry. -
les at 04:03 AM on 7 July 2011Climate's changed before
Yes, well if climatologists are anti-science (lets say) than what better term to use to describe the sighting in 180? -
Bob Lacatena at 03:56 AM on 7 July 2011Climate's changed before
Climatologist sighting on the Akasofu thread! -
Bob Lacatena at 03:55 AM on 7 July 2011Lessons from Past Climate Predictions: Syun-Ichi Akasofu
9, Eric the Red, Oh, and on top of everything else, there's no reason for you to try to use a disparaging term like "tree hugger." That's just an elitist "I hate environmentalists of all flavors" attitude that serves no purpose except to expose your underlying ideologies. Last... would you like to try to justify your unsubstantiated claim that "the recovery from the LIA is loosely tied to phsyics"? -
Bob Lacatena at 03:52 AM on 7 July 2011Lessons from Past Climate Predictions: Syun-Ichi Akasofu
9, Eric the Red, Can you have posted a more patently offensive comment? First, how does the woodfortrees index make it "tree hugger"? It incorporates the satellite data as well as GISS and HadCRUT. Your label of it being cherry picked seems to be pulled randomly itself out of thin air. Second, how is this a "cherry pick"? He used what he felt was a representative record, one which incorporates multiple measurements. Do you have actual evidence that another choice -- HadCRUT -- would have yielded noticeably different results? Last, but not least, you are wrong, basing predictions on physics does matter more than anything. It makes all the difference in the world. Physics/mechanics based theories are science. Correlations and "look! squirrel!" based theories are climastrology. They are worthless. If you can't see the difference there, you must consider yourself to be hopelessly lost in the issues until you can see and understand that fact. -
Albatross at 03:28 AM on 7 July 20112010 - 2011: Earth's most extreme weather since 1816?
Skywatcher @272, Thanks, and you are welcome :) -
Eric the Red at 03:27 AM on 7 July 2011Lessons from Past Climate Predictions: Syun-Ichi Akasofu
Whether his predictions is based on physics or not will not matter (although recovery fro, the LIA is loosely tied to physics). Dana is using a cherry pick above when moving from CRU data to tree hugger.Moderator Response: [Dikran Marsupial] If he had been picking cherries, dana would have chosen a ripe one, e.g. GISSTEMP. Picking an average also has good statistical justification (c.f. Bayesian model averaging). Akasofu on the other hand has picked the ripest cherry for his own argument. The "tree hugger" comment does you no favours either. Please review the comments policy. -
Albatross at 03:26 AM on 7 July 20112010 - 2011: Earth's most extreme weather since 1816?
Eric @273, "Or is that not what you meant?" Correct, I did not mean that. "But the increase in moisture is a worldwide average, not necessarily some local area prone to thunderstorms." Not true. Areas prone to thunderstorms, including intense/severe thunderstorms have experienced an increase in near surface specific humidity. See references below. "The patterns dictate the moisture levels, not the GAT." Not entirely true, see references below-- increases in specific humidity are closely correlated with warming in most regions, inlcuding regions with thunderstorms. Dai (2006), noted an increase in annual surface specific humidity over most land areas, see his Fig 9b. "The data show increases in specific humidity of several percent per decade, and increases in dewpoint of several tenths of a degree per decade, over most of the country in winter, spring, and summer. Nighttime humidity trends are larger than daytime trends. The specific humidity increases are consistent with upward temperature trends." Here is a relatively old study for the USA by Gaffen and Ross (1999): "The data show increases in specific humidity of several percent per decade, and increases in dewpoint of several tenths of a degree per decade, over most of the country in winter, spring, and summer. Nighttime humidity trends are larger than daytime trends. The specific humidity increases are consistent with upward temperature trends." Here is a study for Canada by Vincent et al. (2007): "After accounting for these discontinuities, the results of trend analysis show evidence of an increase in air moisture content associated with the warming observed in the country. During winter and spring, the significant warming in the western and southern regions is accompanied by an increase in dewpoint and specific humidity and by a decrease in relative humidity; in summer, warming is observed in the southeast and it is associated with significant positive trends in dewpoint and specific humidity." And another for China by Wang and Gaffen (2001): "Moisture increases are observed over most of China. The increases are several percent per decade for specific humidity, and several tenths of a degree per decade for temperature and dewpoint." -
thepoodlebites at 03:10 AM on 7 July 2011Increasing CO2 has little to no effect
#53 Make that JMurphy, not KMurphy. A typo and a copy typo, nothing more. No conspiracy or hidden agenda, just the facts please. -
Dikran Marsupial at 03:07 AM on 7 July 2011Lessons from Past Climate Predictions: Syun-Ichi Akasofu
rand15 yes, a prediction can be accurate without being based on any particular theory; however predictions made by chimps trained to pick the numbers out of a bucket can be accurate as well. The point is that predictions based on physical theory are more likely to prove accurate, at least that is what history tells us (hence the name of the series of articles). There is a heirarchy in the strength of arguments: physics > statistics > chimps & buckets chimps + buckets provides no insight statistics provdes insight into correlations physics offers insight into causal relationships If you have identified the causal relationships correctly, your predictions will be good, whateve the circumstances the model is used in. You can't say the same for a statistcal model based on correllations; they can only be expected to be accurate in the region of the calibration data. The "chimps & buckets" model is equally accurate in all circumstances, but not in a good way ;o) Akasofu is somewhere between "statistics" and "chimps & buckets" (as his statistical methodology is questionable). -
thepoodlebites at 03:05 AM on 7 July 2011Increasing CO2 has little to no effect
#51 KMurphy Ulterior motives? Surely you're joking Mr. KMurphy. Justed wanted to access precisely what scaddenp referenced, so there would be no misunderstandings. I'm now visiting the website now, for the first time. Wow, what big error bars you have, +-0.4C. -
thepoodlebites at 02:51 AM on 7 July 2011Increasing CO2 has little to no effect
#50 belay my last: too many nots, sorry. My guess is that the model temperature predictions based on CO2 rise alone will not match the observed temperature record since 2000. If that is the case then the radiative forcing components that Meehl used in 2004 were not accurate and that forcing from natural climate variability has not been properly accounted for. Or to put it another way, the temperature record for the last decade can not be reproduced in the model with anthropogenic forcing alone. -
skywatcher at 02:33 AM on 7 July 2011Climate's changed before
Turns out I'm not first with the word (bah!) - a google search on 'climastrology' comes up with all sorts of nasty anti-Gore, anti-science stuff. But I would certainly say it fits very well for people who think they can predict climate using some flavour or combination of 'cycles' rather than the well-understood and well-verified radiative physics, just like your example Sphaerica. -
ranyl at 02:31 AM on 7 July 2011Over the tipping point
 Wonder what weather changes the rapid loss of arctic summer ice will bring?
-
Philippe Chantreau at 02:23 AM on 7 July 2011The Last Interglacial - An Analogue for the Future?
That's a very long and wordy post that seems to be tending in the direction "we don't know" and "it's natural cycles", although this is actually not clearly stated nor defended in the post. I'm sure some will find your mini lecture on D.O. events informative but there are better sources for that. The same applies to the other types of events mentioned. I'll restate that there has not been a D.O. event in over 20K years. The periodicity of Bond events has not been established. Bond argues of approximately 1500 years, +- 500 years. It is not clear whether there actually is a cycle. If the timing of Bond event #1 is correct (450AD), then another should be underway now, or should be/have been, anywhere between 500 years ago and 500 years from now. But how much would that concern us? It is possible that the LIA was a Bond event (they are cold episodes), but perhaps it was not. If it was, it would confirm the lack of a global character of these events. The vast majority of them do not correspond to any clear climate signal, especially on a global scale. There is little indication that the LIA was a global event. Milliken, for instance, failed to find a clear signature for it in the SHALDRIL cores. I find that these purported cycles are of little to no relevance to the current warming event. I don't see how you demonstrate otherwise. -
dana1981 at 02:18 AM on 7 July 2011Lessons from Past Climate Predictions: Syun-Ichi Akasofu
thanks CBD, figure numbering corrected. I agree, "LIA recovery" is one of my favorites because it's just so ridiculous, like the climate just bounces around some natural equilibrium for no apparent reason. As I noted in the rebuttal to "LIA recovery" linked in the post, the factors which caused LIA cooling are not currently causing warming, so again, it's a completly unphysical argument. -
dana1981 at 02:15 AM on 7 July 2011Lessons from Past Climate Predictions: Syun-Ichi Akasofu
rand15 - you're free to object, but the fact is that Akasofu's prediction is not based on physics at all. "Recovery from the LIA" is not physics. Akasofu did not even attempt to identify the physical cause of the warming trend, other than a throwaway reference to cosmic rays in the published version of the paper. -
CBDunkerson at 02:14 AM on 7 July 2011Lessons from Past Climate Predictions: Syun-Ichi Akasofu
You've got two items labelled as 'Figure 4'. Last two images should be changed to 'Figure 5' and 'Figure 6'. I always love the 'recovering from the Little Ice Age' explanation... as if it were completely reasonable to identify an effect without a cause. -
Steve Brown at 02:12 AM on 7 July 2011The Last Interglacial Part Two - Why was it so warm?
#9 - The paper you link to just provides further confirmation that some regions had continental climates during the Eemian due to the orbital configuration and Arctic sea-ice / albedo feedback. I touched on this in Part 1 of the series. I'm afraid it doesn't provide any support for #1. -
_rand15_ at 02:03 AM on 7 July 2011Lessons from Past Climate Predictions: Syun-Ichi Akasofu
@dana1981 [dana1981] No you're missing the point. Akasofu's prediction is inaccurate because it's not based on physics. I really object to this notion. A prediction can be perfectly accurate without being based on any specific theory. And a prediction can be inaccurate even though based on "physics", if it is based on a faulty analysis or if some important factor has been omitted. Should a prediction turn out to be inaccurate, you can then say "oh, well, what do you expect? It wasn't based on physics." Should it turn out to be accurate, then you want to find out why, which may be coincidence or may be new physics, or previously overlooked factors. -
JMurphy at 01:29 AM on 7 July 2011Increasing CO2 has little to no effect
thepoodlebites wrote : "When you get a chance, can you please point me to RC’s regularly updated model-data comparisons?" You obviously have some ulterior motive for asking that because a few seconds of searching found this, up to the end of 2010 : Real Climate 2010 updates to model-data comparisons Were you looking for something else ? -
BBD at 01:27 AM on 7 July 2011A Detailed Look at Renewable Baseload Energy
CBDunkerson 1) Shutting down nuclear plant if there are demonstrable safety concerns is a Good Thing. In the wake of Fukushima, this may accelerate, and that would be a Good Thing too. What is not a good thing is when arguments based on accidents at old plant (Chernobyl and Fukushima) are used to try and prevent construction of Generation III plant. That's illogical. Remove logic and what is left? 2) See #96.SEGS: - 1,600 acres of the Mohave - best insolation in US - Capacity 354MW - Output (unverified) 75MWe - Load factor 21% See the problem? You aren't going to power the planet with solar. It's wishful thinking.
You did not respond. The footprint of low-density energy technologies is a serious constraint on solar and wind. Interconnectivity and security of same over wide areas is another (even for the US, long-distance HVDC interconnectors represent a security of supply risk). Variability is another. See also Mark Harrigan at #171. Actual insolation is another (thanks again, Mark Harrigan; you said it for me). We've been through the European DESERTEC handwaving upthread. It was not resolved satisfactorily eg #81 ff. You say:The fact that one power company says it does not make it true.
Well, who do we listen to? The chief exec of E.ON UK (and every other energy expert who says the same), or you? Especially since your response rests on SEGS, which as MH has helpfully pointed out, is an irrelevance for the UK. Solar is an irrelevance at mid/high latitudes generally. Huge pumped hydro resources are the best bet, but you are in trouble if they do not exist and you are forced to engineer them. Again, we've been through all this earlier in the thread. At what point do proponents of renewables finally concede that their case is actually weak and unpersuasive? Perhaps after reading the critiques of Jacobson & Delucchi? -
Mark Harrigan at 01:23 AM on 7 July 2011Lessons from Past Climate Predictions: Syun-Ichi Akasofu
If you are a Scientific American subscriber you might want to look at this article from July Scientific American Paleocene-Eocene Thermal Maximum (actually the link works even if you're not a subscriber) which reports a new study from this period that shows how over a period of about 20,000 years natural events contributed to huge greenhouse gas emssions that raised global temps by almost 8 degrees C. Have a look at the graph on the 4th page of the article. It draws a precise analogue with the amount of CO2 we are injecting into the atmosphere today in a tiny fraction of that time. If we keep doing business as usual it suggests if anything current warnings are a gross UNDER estimate of what might happen. Worth a Read - and very sobering. So denialist models like Akasofu's be damned - here is solid evidence what happens if the CO2 levels go up like they are -
thepoodlebites at 01:12 AM on 7 July 2011Increasing CO2 has little to no effect
#49 scaddenp So the statement “model parameters can be adjusted to match any set of temperature observations" is not true? I don’t consider “put up or shut up” or “do it yourself” as compelling arguments in a debate on the scientific issues. And for the record, I have never said that CO2 is irrelevant. The question remains climate sensitivity to CO2 rise. I was specifically addressing the radiative forcing components that Meehl used. The conclusion that “the negative and positive forcings are roughly equal and cancel each other out, and the natural forcings over the past half century have also been approximately zero” to be extremely convenient. So if “radiative forcing from CO2 alone gives us a good estimate as to how much we expect to see the Earth's surface temperature change,” why not run Meehl’s 2004 model again with the same forcings and include observations from the last decade. My guess is that the model temperature predictions based on CO2 rise alone will not match the observed temperature record since 2000. If that is the case then the radiative forcing components that Meehl used in 2004 were not accurate and that forcing from natural climate variability has not been not properly accounted for. Or to put it another way, the temperature record for the last decade can not be reproduced in the model with anthropogenic forcing alone. When you get a chance, can you please point me to RC’s regularly updated model-data comparisons? -
Eric the Red at 01:01 AM on 7 July 2011Lessons from Past Climate Predictions: Syun-Ichi Akasofu
cynicus, I agree that including a new average is inconsistent. The 5-year moving average (centered around Jan., 2000) shows a very slight decline from 0.43 in 2000 to 0.41 today (5 years averaged around Dec., 2008). The CRU 5-year moving average reached a maximum of 0.46 in mid 2004. Since the most recent moving average is only tabulated to the end of 2008, Figure 5 is quite accurate so far. Any claims of an inaccurate prediction are premature. We need to wait another few years to see if it holds.Response:[dana1981] No you're missing the point. Akasofu's prediction is inaccurate because it's not based on physics. As I noted in the article, even if Akasofu gets lucky and his prediction turns out to be close to the actual temperature change, it won't be because he was right, it will be because he was lucky.
-
Bob Lacatena at 00:43 AM on 7 July 2011Climate's changed before
176, skywatcher, 177, les, Climastrology I like it. It's actually better than mathturbation, and more appropriate (in that mathturbation is clearly an important "skill" needed by climastrologists, but doesn't describe the overall, full version of alchemy in which they indulge). I'd personally like to recommend that we begin using the word where ever it applies... today's post by Dana on climastrologist Syun-Ichi Akasofu being a perfect case. -
DSL at 00:38 AM on 7 July 2011History Matters: Carbon Emissions in Context
Daisym, you don't really want a number, do you? There are plenty of numbers out there. I suspect that you'll argue with the basis of whatever number you get--argue to the point of convincing yourself that it's not accurate enough. But this is not about getting what you pay for. It's about paying for what you already have. This is a problem that extends beyond the average lifespan of an individual human. That makes it fair game for middle-class denial. After all, why should you personally pay for something that will primarily benefit future generations, living long after you're ashes or in a box in the ground? Why? If your morality is based on social justice and general human welfare, the answer is obvious. However, if your morality (or perhaps ethics in this case) is based on contracts and market responsibility, then you are now confronted with two problems. One, your current quality of life is largely based on over a century's worth of cheap fossil fuel use. All of the debt that can be paid for this use (setting aside the quite serious post-colonial reparations argument) is and has been paid, excepting one critical externalized cost. Aerosol pollution is an externalized cost that is being and has been paid for through regulation and the resulting market mechanics, and you'll probably agree that life is better without lead, SO2, and mercury raining down on us, even if we can't place an accurate number on the benefits. CO2 is the external cost that has not been paid for, has never been paid for. We've been cranking it out for the last century, and no one has taken responsibility for it. Ultimately, you'd have to agree, the responsibility lies with us to clean up the mess our irresponsible ancestors left us. They've given us wonderful things, but there's a skeleton in the closet--and it's beginning to move, and it has a baseball bat in its grip. That leads us to number 2: if you decide to pass on the responsibility, then you become irresponsible. If you decide to continue with business as usual, refusing to recognize the CO2 external cost, then you are buying something without fully paying for it. Basically, the modern world has had a free lunch for a century, and you're now being asked to pay for it. And now you want the same free lunch and want to make my grandchildren pay for it? Nope. And the longer the check remains unpaid, the more expensive it gets. -
Bob Lacatena at 00:31 AM on 7 July 2011Antarctica is too cold to lose ice
5, Steve, Just to highlight the obvious to anyone, in case it's not... what all of this means is that the IPCC AR4 underestimated sea level rise, because it counted on a negative rather than a positive contribution from Antarctica. This means that things are, once again, worse than expected, and the IPCC was too conservative (= non-alarmist) in its projections. -
cynicus at 00:19 AM on 7 July 2011Lessons from Past Climate Predictions: Syun-Ichi Akasofu
Dana, why are you changing from HadCRUT to WoodForTrees Index during the article while Akasofu uses HadCRUT? As a sidenote: HadCRUT does show 0.05°C warming over the 2000-2011 period although I immediately add that only 10 years of temperature data is way too short to have confidence in this linear trend. Also, HadCRUT does not include the Arctic which might cause it to underestimate the (warming) trend. But my main point is that I think you should stick with a single record throughout the article next time to maintain consistency. Or have you choosen the WfT Index because you think it is more accurate (if so, do you have a link to a discussion about this)?Response:[dana1981] Using HadCRUT is a cherrypick. It shows the least amount of warming since 2000 because it excludes the Arctic. Frankly I'd prefer to use GISTemp because I think it's probably the most accurate, but then 'skeptics' would accuse me of cherrypicking as well. I chose the WfT Index because it's a composite of the four most popular global temp datasets. Using a composite eliminates all accusations of cherrypicked datasets.
-
Mark Harrigan at 00:15 AM on 7 July 2011A Detailed Look at Renewable Baseload Energy
@ CBD #170. I really don't think your rebutaal of BBD at #169 stands scrutiny. 1st because the example he is talking about is Wind as a reliable renewable and your example of SEGS is solar (CST). Second I'd like to see evidence that SEGS can provide baseload 24/7 for 365 because I don't think it can yet, The link on this site SEGS performance suggests it can only operate reliably for 65% of the year - that doesn't really cut it? But if you can source a link that shows otherwise would love to see it - so I would like to challenge your "Only 10% of the baseload power it supplies comes from natural gas backups" figure? It doesn't seem credible to me? (happy to be proven wrong though) finally - BBD is talking in the context of the UK - where solar is not nearly so viable an option and wind is the "viable" UK alternative. So, really, I think you are comparing your apple with his orange and the comparison is flawed (not to mention that I think your apple is a little bruised by exaggeration) -
les at 00:03 AM on 7 July 2011Climate's changed before
176 - skywatcher... "climastrology" :-D Tamino should add that to this discussion. Anyway, I have the strong suspicion that 174 is spam... but if you get a reply, it's probably because Mars is exerting a strong influence. -
Arkadiusz Semczyszak at 23:35 PM on 6 July 2011The Last Interglacial Part Two - Why was it so warm?
Interesting facts to prove what is written in a post 1. The Inconvenient Skeptic; I found here: Evolution of the seasonal temperature cycle in a transient Holocene simulation: orbital forcing and sea-ice, Fischer and Jungclaus, 2011. -
John Bruno at 23:31 PM on 6 July 2011Great Barrier Reef Part 1: Current Conditions and Human Impacts
Fair point DLB. It is a tricky subject, due in large part to the fact that the science budget for biological monitoring is a tiny little fraction of what is spent to monitor physical parameters. The evidence that has really persuaded me is recent - sadly as yet unpublished - work in John Pandolfi's lab at UQ: they are finding lots of evidence of coastal reefs that were buried by sediment around the time Queens was deforested. -
skywatcher at 23:29 PM on 6 July 2011Climate's changed before
#174: would it be like these 60-ish year and non-significant fluctuations, discussed by Tamino? There's a good discussion of periodicity and the detection of cycles within. People can pretend that the world's climate is driven by something nicely uncontrollable like planetary movements (climastrology?), but back in the real world, it's the radiative forcings that dominate, and the biggest forcing factor is indeed 'controlled' by humans. -
CBDunkerson at 23:18 PM on 6 July 2011A Detailed Look at Renewable Baseload Energy
Tom Curtis #152: I agree that it's a Catch-22: They can't get newer power plants built because of public fears over accidents at outdated power plants... and they can't shut down the outdated power plants because they can't get new ones built. However, that's the reality and the only way they are going to break out of the cycle is to shut down those older plants. Yes, they lose their revenue stream in the short term... but then have the opportunity for much greater revenues in the future. BDD #169: The fact that one power company says it does not make it true. Again, SEGS. Largest solar plant in the world. More than 20 years old. Only 10% of the baseload power it supplies comes from natural gas backups. Ergo, E.ON's claim that renewable energy can't provide baseload power without 90% fossil fuel backup is directly contradicted by established reality. -
Dikran Marsupial at 23:06 PM on 6 July 20112010 - 2011: Earth's most extreme weather since 1816?
Eric@276 All of the indices are correlations between actual observations and the downscaled results from the GCM runs, so all are comparing the model with reality. While pav and pint are indeed "merely daily rainfall", flood events in most parts of the UK are multi-day events, so the ability to predict day-to-day rainfall is actually quite helpful in predicting extreme events leading to floods. Pq90 is a test of the ability of the system to predict the 90th centile of precipitation. In other words, it is a test of the ability of the system to model the upper tail of the distribution of rainfall. As I said, multi-day rainfall events are important for most (but not all) parts of the UK, so the relevance of px5d is faily obvious, it is those sort of events that will lead to flooding. Pnl90 is not *that* interesting - how many extreme events do we get in one season? Note for pfl90 if you have a very wet season, with rain on most days, then the fraction of rainfall due to extreme events will be lower than in a more normal season, even if the extrem events are the same. Pxcdd is a measure of the ability of the downscaled model to predict the maximum number of consecutive dry days. This is reasonable as the most extreme drought in any season will be the longest one (that is pretty much the definition of a drought). If the model predicts a maximum dry spell of a couple of days, and the observations have 10 or 20 days, then you will get a low value for the pxcdd statistic, which is exactly what you would want to see how good the model is at predicting extreme droughts. There is a good reason why all of the statistics were used in the study; they are all relevant, and it is a mistake to pick and choose as it ignores important context. I should also note that only one of the models was deliberately designed for predicting extreme events on a day-to-day basis, namely MLPR, but none of the indices used are really intended for that sort of resolution (because it isn't important in climatological studies, where it is the longer term statistcs that are of interest). -
CBDunkerson at 22:59 PM on 6 July 2011Over the tipping point
The PIOMAS ice volume model results were recently updated through the end of June and now show an anomaly of about -9800 km^3... breaking the previous record low anomaly set last year by about 600 km^3. If volume loss from now through September followed the long term average, such that the anomaly remained -9800 km^3, that'd result in a September monthly average of just 2500 km^3... well below even last year's (record low) one day minimum of 4400 k^3. To me this suggests that the sharply falling volume trend of the past five years or so has not been 'just an anomaly' or 'caused by export of thick ice'. Rather, it suggests that alot of the volume loss has been due to ice melting in situ due to warmer ocean waters... which if correct would mean that the trend should only continue to accelerate (rather than reversing if it was a statistical anomaly or leveling off if it was due to export of thick ice which no longer exists). This would also suggest that 'the ice stays gone' view is more likely correct than the 'comes and goes' idea from Amstrup's 2010 study in Nature. Interestingly, while the volume is currently about 3300 km^3 lower than at the same point in 2007 the ice extents are nearly identical. This demonstrates how great the disconnect between the two measurements can be. That said, zero volume perforce means zero extent... so as we get closer to zero volume we should start to see extent dropping dramatically. -
Marcus at 22:58 PM on 6 July 2011Glickstein and WUWT's Confusion about Reasoned Skepticism
What temperature dip in the 1970's? The anomaly at the start of the decade was +0.03 degrees, & the decade ended on +0.08 degrees. In between times the temperatures just kind of bobbed up & down-though there was an overall *warming* trend for the decade of +0.06 degrees. Seriously, does Watts *always* just make stuff up as he goes? -
Tor B at 22:55 PM on 6 July 2011Database of peer-reviewed papers: classification problematics
A discussion over at Real Climate.org - see comment #24 - identifies a website with information about debunked anti-AGW publications (agwobserver.wordpress.com). A subsequent post by deconvoluter included “I think it is a mistake to include a minority of papers classified with a little (M) meaning a misunderstood main stream paper. They should be put into a separate list to avoid confusion. Otherwise it won’t be long before you see the authors of such (M) papers claimed by contrarians as supporting their position.” This information may be useful here. I have only superficially checked the referenced website, but it looks credible - like I'm the expert :) -
Eric (skeptic) at 22:26 PM on 6 July 20112010 - 2011: Earth's most extreme weather since 1816?
Dikran, I will try to pay more attention. Obviously I am still learning this area, but I think there is a forest and trees issue here (a region is still just part of the forest). Looking at each statistic from table 1, and ignoring any results: pav and pint are merely precipitation. I am not sure what pq90 means. px5d appears to be a measure of extremes, except that it is only the excessive px5d's that matter. We would need to measure separate statistics for those. pxcdd is a good measure for drought provided we compare the excessive pxcdd from the model to reality. Showing there is a good match for pxcdd for a few days does not necessarily mean there is a good match for pxcdd for 10 or 20 days (or whatever might be considered a drought). Both pf90 and pnl90 appear to be good indications of extremes or a proxy for extremes. -
BBD at 22:25 PM on 6 July 2011A Detailed Look at Renewable Baseload Energy
adelady #160 I'm open to the idea of using the combined electric fleet as backup for renewables intermittency. Some claim this is feasible with smart chargers; others that it is yet more evidence of the fundamental 'perpetual motion machine' fallacy at the heart of all high-renewables projections. In other words, there's never enough energy to go around in the long run and catastrophic capacity shortfalls will occur. In the UK, current planning is for an installed capacity of ca 33GW of mainly offshore wind by ca 2020. The 'battery sceptics' point out that winter anticyclones can effectively stop national wind production for several days. The national electrified fleet might be a workable energetic reservoir for short bursts of backup but it could not cope with this. This is why policy currently leans strongly towards new gas-fired plant as spinning reserve for installed wind capacity once it exceeds 10% of the national energy mix. This is part of the background that informs this short but very revealing piece in the Guardian (see originally #124):One of Britain's leading energy providers warned yesterday that Britain will need substantial fossil fuel generation to back up the renewable energy it needs to meet European Union targets. The UK has to meet a target of 15% of energy from renewables by 2020. E.ON said that it could take 50 gigawatts of renewable electricity generation to meet the EU target. But it would require up to 90% of this amount as backup from coal and gas plants to ensure supply when intermittent renewable supplies were not available. That would push Britain's installed power base from the existing 76 gigawatts to 120 gigawatts. Paul Golby, E.ON UK's chief executive, declined to be drawn on how much the expansion would cost, beyond saying it would be "significant". Industry sources estimate the bill for additional generation could be well in excess of £50bn. E.ON's calculations are part of what the company calls its energy manifesto - designed to draw attention to what Golby described as Britain's "trilemma" - balancing the priorities of carbon, costs and energy security. "We are calling for a new balanced and honest debate about the UK's energy needs, one that truly assesses the consequences in terms of carbon, cost and security of our energy choices. E.ON is investing or has plans to invest in a series of new generation projects including wind, marine, gas and coal and has indicated interest in new nuclear stations. Golby said he wanted to to confront single-issue campaigners. "It is easy to say 'no' to coal, easy to say 'no' to nuclear. I'm quite interested in what they are going to say 'yes' to."
As an end note, that's a significant spinning reserve, and it will emit significant amounts of CO2. -
Dikran Marsupial at 22:03 PM on 6 July 20112010 - 2011: Earth's most extreme weather since 1816?
Eric (skeptic) Pfl90 is not a measure of ability to predict "bona fide" extreme events, it is the fraction of total precipitation due to predicted events over the observed 90th centile. You are just cherry picking the statistic to find one that gives you a reason not to accept the utility of statistical downscaling. Care to explain why the fraction of total rainfall due to events over the observed 90th centile is more informative than the prediction of the 90th centile itself (pq90)? Also for floods on the SE England, five-day precipitation is what causes floods, so why not look at px5d? I have already explained, repeatedly, that return periods can be constructed for regions as well as particular locations. It is also possible to detect trends in return periods using well understood statistical methods (Extreme Value Theory) Thus your second paragraph is (a) wrong and (b) inidcates you are not paying sufficient attention to my posts. -
JMurphy at 21:53 PM on 6 July 2011History Matters: Carbon Emissions in Context
daisym wrote : "Money should never be spent on any CO2 reduction scheme unless and until taxpayers are informed of the quantifiable benefit that would result. Ironically, this isn't happening and will never happen, will it?" With regard to Australia, you could do worse than start here for further information : Carbon Pollution Reduction Scheme -
Mark Harrigan at 21:28 PM on 6 July 2011A Detailed Look at Renewable Baseload Energy
@BBD #166. Thanks for the link BBD - no apology necessary - I understand (believe me!). I'm disappointed :( - but not surprised alas - at the comprehensive torching this link gives to yet another wishful thinking 100% renewables plan. I wish advocates of renewables would try and be more realistic - ultimately they do the case for moving to lower emissions more harm than good by proposing unrealistic feelgood wishful thinking scenariois that can be so comprehensively shown to be impractical. Because then what ends up happening is that any "good" bits get ignored too. I think I stand by my post #161 above - we need to acknowledge that the reliability and cost of renewables remain a significant challenge. Let's focus on how to address that issue rather than pretending it doesn't exist. @adelady #163 - I have to agree with BBD somewhat - if you examine the real cost of Solar PV and Wind they are currently some of the MOST expensive ways to abate CO2 emissions available - do a bit of googling and you will see what I mean. That doesn't mean I reject them as alternatives - only that we need to be realistic about what they can do. Yes improved volume will help but the cost curve reduction is not linear - there are limits. Mind you - there are some other options emerging Paint on Solar But there's a LONG LONG road to commercialisation -
Arkadiusz Semczyszak at 21:23 PM on 6 July 2011The Last Interglacial Part Two - Why was it so warm?
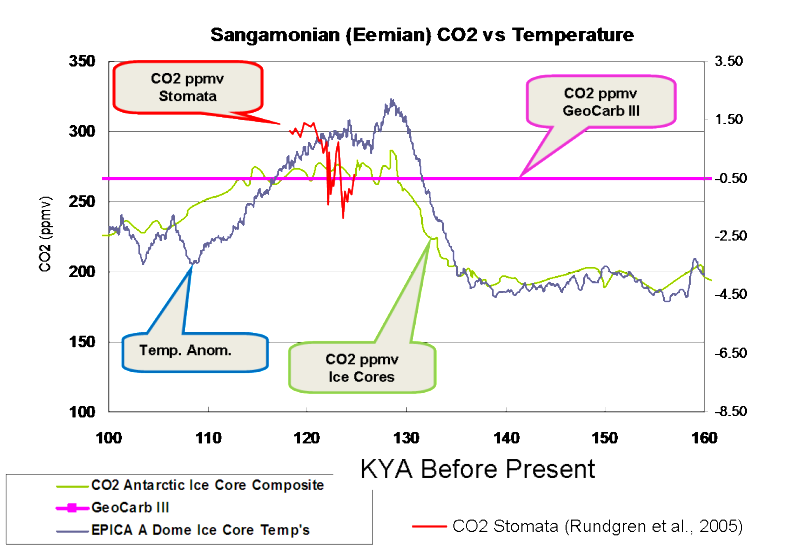
General note: sentient in the previous post “talked” about the MIS 11. It is worth noting that most researchers believe that: “MIS 11 can be considered an analogue for future natural climate changes.” ( Loutre, 2003.) Not Eemian. Rohling et al., 2010.: “MIS-11 is often considered as a potential analogue for future climate development because of relatively similar orbital climate forcing ...” “However [even the here], there is an obvious difference in that the current interglacial (Holocene) spans a single insolation maximum (summer, 65°N), while MIS-11 spanned two (weak) astronomical precessiondriven insolation maxima separated by a minor minimum (due to coincidence of a minimum in 400-ky orbital eccentricity with a maximum in the Earth's axial tilt ...” “In itself, this additional warming from the Sun is too small and too regional to fully explain all the observed warming during the period. It's likely that lowered albedo, increasing CO2 and other carbon feedbacks have amplified this warming from the orbital pacemaker.” Effect of CO2 can explain temperature changes during interglacials, but it is a relationship far more complicated than we think. “It is only when insolation and CO2 act together towards a cooling, i.e. they both decrease together, that the climate enters quickly into glaciation and that the interglacial may be short. Otherwise each forcing alone is not able to drive the system into glaciation and the climate remains in an interglacial state. The same situation applies for the future. However, we already know that CO2 and insolation do not play together. (Loutre, 2003.). By Rohling et al., 2010. “more controversial” is the possibility “variability in the planetary energy balance during Pleistocene glacial cycles was dominated by greenhouse gas and albedo related feedback mechanisms, and that the role of insolation was limited to only triggering the feedback responses (Hansen et al., 2008).” Why "more controversial" - could it be for the reasons referred here ( Schwartz et al., 2010 )? Is worth to draw attention - Rundgren et al., 2005. - on Figure 4 - "raw" data. Together with a possible range of deviations - fluctuations of CO2 are possible (and in a relatively short time) between 160 and 350 ppmv CO2. Changes in the Eemian p.CO2 may thus be significantly underestimated. Only by adopting this latest conclusion, We can answer the question of the Eemian - Why was it so warm? just like Hansen: “... greenhouse gas and albedo related feedback mechanisms ...” -
Eric (skeptic) at 21:22 PM on 6 July 20112010 - 2011: Earth's most extreme weather since 1816?
Dikran, I finally read through the paper in your post 224 It is pretty clear that downscaling does not work well for extremes. There is poor correlation in the bonafide extreme events (e.g. pf90) particularly during the times of year that they matter (spring and summer). In fact almost no correlation between the model downscaling and reality. Furthermore, no matter how many times you insist, the return period statistics are not a valid analysis of increasing risk of extreme events. Sure, they are great for any particular flash-flood or river flood prone area. But to conclude anything about a broader trend in extreme events requires looking at every single possible extreme area statistic. Anything less is a cherry pick. For example, we were briefed on the Toowoomba flash floods above, and a return period statistic may inform the Toowoombians. But what about all the other places that didn't flash flood? Without adding their return period statistics (which may be decreasing) into a whole, there can be no conclusion about any trend. That is why Master's post above comes up short. Sorry to be so blunt, your statistics are strong and I appreciate your criticism of my errors. But in this particular case, I believe you are incorrect.
Prev 1593 1594 1595 1596 1597 1598 1599 1600 1601 1602 1603 1604 1605 1606 1607 1608 Next


