


 Arguments


Recent Comments
Prev 1599 1600 1601 1602 1603 1604 1605 1606 1607 1608 1609 1610 1611 1612 1613 1614 Next
Comments 80301 to 80350:
-
Ken Lambert at 00:19 AM on 4 July 2011Uncertainty in Global Warming Science
KR #81 "However, we have the track record of global temperatures, and a decent record of forcing changes both natural and human. We can see when the climate is gaining or losing energy over the last few hundred years. Global temperatures have gone both down and up over that period, which immediately tells us that we've seen forcings both above and below equilibrium - that the area under the forcing curve has gone both positive and negative." Please expand on the 'cooling' we have seen over the last 'few hundred' years and the reasons for same. S-B is a fourth power function of T so you would see most of the effect in the last 50 years or so. -
BBD at 00:12 AM on 4 July 2011A Detailed Look at Renewable Baseload Energy
Tom Curtis 114 Thanks for the amusing attempt to forcibly alter Hansen's meaning. Good try. Now, let's go back to the true sense of the letter:Energy efficiency, renewable energies, and an improved grid deserve priority and there is a hope that they could provide all of our electric power requirements. However, the greatest threat to the planet may be the potential gap between that presumption (100% “soft” energy) and reality, with the gap filled by continued use of coal-fired power. Therefore it is important to undertake urgent focused R&D programs in both next generation nuclear power and carbon capture and sequestration. These programs could be carried out most rapidly and effectively in full cooperation with China and/or India, and other countries. Given appropriate priority and resources, the option of secure, low-waste 4th generation nuclear power (see below) could be available within a decade. If, by then, wind, solar, other renewables, and an improved grid prove that they are capable of handling all of our electrical energy needs, then there may be no need to construct nuclear plants in the United States. Many energy experts consider an all-renewable scenario to be implausible in the time-frame when coal emissions must be phased out, but it is not necessary to debate that matter. However, it would be exceedingly dangerous to make the presumption today that we will soon have all-renewable electric power. Also it would be inappropriate to impose a similar presumption on China and India. Both countries project large increases in their energy needs, both countries have highly polluted atmospheres primarily due to excessive coal use, and both countries stand to suffer inordinately if global climate change continues.
Hansen's carefully worded caution to President Obama is that there is no need to debate about whether renewables can displace coal. Rather, we should get on with R&D including Gen IV nuclear and when renewables fail to deliver on the hype (as Hansen clearly believes is likely) we can still get on with the over-arching business of decarbonising the energy mix and attempting to stave of climate disaster. I do think you need to mull this over carefully. It's terrifyingly important, and wishful thinking about renewables is starting to look like a serious impediment to good energy policy-making. So serious that no less than James Hansen wrote an open letter to the President warning him about it. -
BBD at 23:58 PM on 3 July 2011A Detailed Look at Renewable Baseload Energy
Tom Curtis 113From 101: a) 64.6 trillion kWh of electricity produced by nuclear; b) 2 INES 7 events; Therefore, c) 1 INES 7 event per 32.3 trillion kWh produced by nuclear; From 69: d) 11.5 Terrawatts of clean energy capacity required; Or e) 100 trillion kWh of electricity if produced at peak capacity; Or 50 trillion kWh of electricity allowing for a peak to zero capacity cycle everyday; So F) An expected 1.5 IES 7 events per annum if fossil fuels are replaced by nuclear at current safety standards.
Sophistry old chap. You seem to have forgotten that the Chernobyl and Fukushima events were caused by abysmally poor design and afflicted plant many decades old. So your projection breaks. Amusing, coming from someone who repeatedly says things like this:Again you are throwing up a wall of numbers without carrying it through to an actual analysis, just as you did on your first full post on the topic.
Your pop at Brook omits one inconvenient fact: nobody died at Fukushima. But do carry on with the anti-nuclear propaganda anyway.I don't care whose numbers they where, you quoted them, and you drew an implication from them. Therefore either you defend them, or you withdraw the implication.
The 'implication' - which is actually a blindingly obvious logistical problem - speaks for itself. And I can tell that you don't like that at all. Either stop fulminating about Griffith's numbers or rebut them.You do not get to both disavow the "evidence" and retain it as bolstering your argument, at least not if your purpose is rational discussion or analysis rather than propaganda.
As I have said, I have provided a great deal of practical input on this thread. Not propaganda. In responses here I seen nothing that supports the claim that renewables will play a significant role in displacing coal from the global energy mix. If there is bias, denial and zeal anywhere, it is coming from the pro-renewables lobby. -
BBD at 23:45 PM on 3 July 2011A Detailed Look at Renewable Baseload Energy
JMurphy #112 You are transparently anti-nuclear. It is evident from the tone and content of your responses. Why deny it? You do not seriously address the points I raise at 101, so I will return the discourtesy. However, the INES 7 ratings for Chernobyl and Fukushima are puzzling. I invited you to refresh your memory on the facts concerning Chernobyl, but evidently you haven't yet had time. When you do get a minute to review the evidence, you can see for yourself that the INES 7 rating for Fukushima may have been an over-reaction. After all, Fukushima has caused no fatalities, and resulted in no life-threatening exposure to radiation. Odd, isn't it? You close with this:The fact that you try to lessen the seriousness, speaks volumes.
This is incorrect and strategically dishonest, which is in line with much else you say here. As time is limited, I do not think there is much point in continuing this exchange. -
Mark Harrigan at 23:42 PM on 3 July 2011It hasn't warmed since 1998
Oops - for "show that a linear trend is still valid" I should have said - "show that a FLAT trend is still valid". I wish they could show such a thing - I'd love to discover AGW isn't a real problem! I wish it wasn't! But wishing doesn't make it so and good scientists don't fall for the "is/ought" fallacy. So I am betting they won't and can't. -
Mark Harrigan at 23:38 PM on 3 July 2011It hasn't warmed since 1998
@#104 - Thanks Dikram. Really appreciate your comprehensive reply. I think this just about knocks it on the head - it's good to have such a clear, albeit somewhat arcane and technical, discussion. In summary I would argue this paper can be safely dismissed because #1) After two years it hasn't been published - suggesting a problem with its acceptance #2) It has been submitted to a forecasting journal which, whilst reputable and purports to cover climate forecasting, does so as only as one out of a long list of forecasting topics which are predominantly economic and social in nature (in other words it's light on hard science) - which means there is actually very little climate science expertise within the journal #3) It contains no physics or science arguments what-so-ever as to what may actually be the mechanisms it purports to reveal or forecast. The above 3 really make it clear it is hardly a paper about climate in the first place #4) It's approach is statistically invalid since the test it applies assumes a gaussian noise distribution in the data when that is not the case (due to the multiple impacts of noise from cyclical drivers of climate of different periods and variabilities) #5) It's approach is invalid on the physics of climate because of the above #6) It's invalid on the physics anyway since it is established beyond reasonable doubt that increased atmospheric levels of CO2 produce an increased green house effect #6) It's approach is statistically invalid because of the multiple hypothesis testing problem - i.e. it is highly likely to generate false positives in the statistical analysis of the data - especially when it ignore the underlying physics - in other words the so-called linear trend they forecast is likely to be plain wrong #7) It fails to remove the effects of things like ENSO and volcanos from the data in order to analyse the temperature effects of increasing CO2 in the atmosphere - particularly egregious when the ENSO of 1997/98 was known to be one of the largest ever #8) It actually fundamentally fails to address the central tenet of AGW - that increasing levels of human generated atmospheric CO2 are contributing to a warming of the planet independent of other (natural) factors sufficient to cause substantial climate change that will most likely be deleterious. have I missed any? If they want to come back on any of that all they have to do is re-analyse the data accounting for ENSO etc (as per your graph) and then show that a linear trend is still valid and is not a false positive - and of course get that accepted in peer review. If they were honest scientists that's what they'd do. I hope I get the chance to put that to them :) -
neilrieck at 22:41 PM on 3 July 2011Roy Spencer on Climate Sensitivity - Again
Not sure how many people know that the industry sponsored deniers were at it again in Washington D.C. (June-30 to July-1) climateconference.heartland.org The usual suspects include: Roy Spencer, Harrison Schmitt, Willie Soon, Anthony Watts, S. Fred Singer, to only name a few -
Dikran Marsupial at 22:41 PM on 3 July 2011It hasn't warmed since 1998
@mark The central limit theorem does indeed suggest that the averaging of temperatures at stations at different location means that a Gaussian noise model is appropriate, but only for a particular time point. To see why this is the case, imagine some AM radios that are affected by mains hum. Each will have a noise component that is due to the electronic components in the radio, these are independent, so the noise for the average signal over many such radios will have a corresponding Gaussian component. However, the mains hum on all the radios will be in phase and will be reinforced in the averaged signal, and will have the same [scaled] distribution as the mains hum measured at any one of the radios. Another way of looking at it, cyclical data is easily confusable with data containing a step change, but how likely is it to see a cyclic pattern in Gaussian white noise? A lot less likely than in data with autocorrelation or cyclical noise. You are not being at all dense, the central limit theorem is hardly stats 101! I checked the archive at the Journal of Forecasting, it hasn't been published yet. For the multiple hypothesis testing issue, there are standard methods to deal with this, but they are generally overly optimistic or pessimistic. What I would do is generate a large number of model runs using a GCM where the only forcing was from CO2 and see how many produced a non-significant trend at some point during a 40 year period via the models internal variability. The forty year period is chosen since worries about global warming began to gain acceptance in the early 70s, the test is "at some point" because we are asking if cherry picking is the issue, so the "skeptics" would make the claim as soon as such a period ocurred. Easterling and Wehner (who Stockwell and Cox claim to refute) did almost that, in that they looked at model output and found that decadal periods of little or no warming were reproduced by the models (although opf course the models can't predict when they will happen). This means that the observed trend since 1995/8 is completely consistent with model output. Easterling and Wehners' result shows that cherry picking is a possibility; it isn't necessarily deliberate cherry picking, but the skeptics have never performed an analysis that shows the ressult is robsut to the multiple hypothesis testing issues. For the removal of ENSO, see the Fawcett and Jones paper mentioned in the intermediate version of this article. If you just look at the data: you can see there isn't much evidence of a step change in 1997 if you account for ENSO.
The real problem with the paper is the straw man of a linear centennial trend. AGW theory doesn't suggest a linear centennial trend is reasonable, so showing a model with a break-point is statistically superior to something that AGW theory does not predict is hardly evidence against AGW.
I also remember some comment about solar forcing being better correllated with temperatures than are CO2 concentrations, and conclude that CO2 radiative forcing is not significant (or words to that effect). However, that is another straw man, the mainstream position on AGW does not say that co2 radiative forcing is dominant on a centennial scale (and that solar forcing is responsible for much of the warming of the 20th century). This is both a straw man and a false dichotomy, it isn't one thing or the other, but a combination of both. Reviewers at the Journal of Forecasting might not be suifficiently familiar with the climatology to spot that one.
What I am basically arguing is that statistics should be used to gain knowledge of the data generating process (in this case climate physics). If you ingore what is already known about the data generating process and adopt a "null hypothesis" (e.g. linear centennial trend) that is known a-priori to be incorrect, then statistical methods are likely to be deeply misleading. It is a really good idea for statisticians to collaborate with climatologists, as together they have a better combination of climate science and statistical expertise than either has on their own. This paper, like McShane and Whyner (sp?) and Fildes and Kourentzes, is an example of what happens when statisticians look at climate data without fully immersing themselves in the climatology or getting their conclusions peer-reviewed by climatologists.
you can see there isn't much evidence of a step change in 1997 if you account for ENSO.
The real problem with the paper is the straw man of a linear centennial trend. AGW theory doesn't suggest a linear centennial trend is reasonable, so showing a model with a break-point is statistically superior to something that AGW theory does not predict is hardly evidence against AGW.
I also remember some comment about solar forcing being better correllated with temperatures than are CO2 concentrations, and conclude that CO2 radiative forcing is not significant (or words to that effect). However, that is another straw man, the mainstream position on AGW does not say that co2 radiative forcing is dominant on a centennial scale (and that solar forcing is responsible for much of the warming of the 20th century). This is both a straw man and a false dichotomy, it isn't one thing or the other, but a combination of both. Reviewers at the Journal of Forecasting might not be suifficiently familiar with the climatology to spot that one.
What I am basically arguing is that statistics should be used to gain knowledge of the data generating process (in this case climate physics). If you ingore what is already known about the data generating process and adopt a "null hypothesis" (e.g. linear centennial trend) that is known a-priori to be incorrect, then statistical methods are likely to be deeply misleading. It is a really good idea for statisticians to collaborate with climatologists, as together they have a better combination of climate science and statistical expertise than either has on their own. This paper, like McShane and Whyner (sp?) and Fildes and Kourentzes, is an example of what happens when statisticians look at climate data without fully immersing themselves in the climatology or getting their conclusions peer-reviewed by climatologists.
-
Mark Harrigan at 22:19 PM on 3 July 2011It hasn't warmed since 1998
@ Sean 103 Thanks - while these links don't explicitly address Cox's paper and the statisticaly validity (or otherwise) of their approach they do remove the effects Dikram was pointing out. The challenge then to Cox and Stockwell would be to analyse again based on this and see if they could still find the break points. On a visual inspection of the graphs in the links I suspect not. Please ignore #101 - I must have hit submit when I meant to hit previewModerator Response: [Dikran Marsupial] #101 deleted, done the same myself more than once! ;o) -
SEAN O at 21:55 PM on 3 July 2011It hasn't warmed since 1998
Mark #102 Tamino at Open Mind has looked at these issues in these two threads: http://tamino.wordpress.com/2011/01/20/how-fast-is-earth-warming/ http://tamino.wordpress.com/2011/01/06/sharper-focus/ -
jatufin at 21:52 PM on 3 July 2011Great Barrier Reef Part 1: Current Conditions and Human Impacts
Never visited Down Under, but I think the three things we Europeans have in our mind, when we first think about Australia are: The Big Red Rock, The Sydney Opera House and The Great Barrier Reef. The rock will probably be fine for eons to come, the opera house will cope with future as any man made object. But if GBR would came to its end due human actions, that would be a sin future generations will never forgive us. -
Mark Harrigan at 21:38 PM on 3 July 2011It hasn't warmed since 1998
@kdkd - I know what you mean about the IPA but that doesn't count as a valid refutation. Even though the IPA is populated with ideologues who far too frequently see things only through the prism of their free market ideology that doesn't make everything they say wrong. @Riccardo - thanks for that - I was told it HAD been published - that was certainly the claim by the Cox supporter and Cox himself posted a link to it on the Drum (ABC) (as per mine above) to the paper as if it "were" published - typical of his dissembling approach. But you are correct - I can find no reference to it in any of the indexes for this journal. That in itself is telling enough as it is now almost 2 years since it was submitted. In my own days (long past) of publishing in the field of Atomic Physics it could sometimes take 12 months or so from submission to publication. But two years suggests there are some issues with acceptance. I should have checked this before. But I'm not sure your other comment is entirely fair. I agree any physics is absent and I accept Dikran's comments on the poor statistics (as I'm not the expert there) but I'm not sure you can claim that their only conclusion is that local temperatures are sensitive to nearby ocean. Perhaps I've misread it but I gathered they were looking (purportedly) at Australian temperature data and using that as basis to dispute local warming (i.e. saying they can show a statsitically valid trend based on the Chow test that it may be flattening) @Dikran - thanks for your comprehensive statistical refutation - I'm afraid I don't have the statistical expertise that you do - If asked I would have thought sum-of-squares errors was a fair anough approach (which is what you would expect in econometrics). But would you elaborate further? I understand what you mean about physical processes - as climate/temperature outcomes are a function of many different factors each with their own cycles and forcings and ENSO of course being a big one. But given that temperature data (what they are analysing) is ultimately data that is averaged over many sources why isn't it by definition normally distributed? I'm sorry if I'm being a little dense - is it because each of the "drivers" has it's own statistical/natural "noise" and this creates a non-gaussian distribution of noise when the (average) temperature data is considered? Do you know of anyone who has looked at the data after tyrying to remove the effects of ENSO etc? I very much take your point about the "multiple hypothesis testing problem" - some thing I wasn't familiar with before but based on your explanation and a bit of my own secondary research can see how "false positives" might abound in an area like this. Are there any simple tests that can be used to identify the likelihood of this? I do find their comments about breakpoints to be not unreasonable - although I note they make no real statement about what possible physical processes may be causing them. Perhaps the most compelling argument (against this paper) is actually that they offer no fundamental physical reason behind their so called flattening. If I were to have a stab at trying to understand what is going on here based on the statistical arguments you have presented I might have speculated that you can get large maxima and minima in any data that is the physical outcome of many cyclical processes that operate on different periods merely because from time to time the cyclical maxima co-incide in time. The danger is then that you "cherry" pick these points. You have to remove these other cycles to get out any linear drivers underneath the data. I think that is sort of what you are arguing? Regardless - thanks all for your responses. Any more welcome but at least I feel now that we can point out not only that Mr Cox is on shaky ground - but also why. Cheers -
JMurphy at 20:01 PM on 3 July 2011Arctic icemelt is a natural cycle
With reference to DB's moderator response above, I would be prepared to try to get something written (if only for my own future reference) but I would need to be able to find all previous references to the St Roch on SkS, because I think quite a bit of relevant information is already there - it just needs to be gathered together and researched in more detail. Is there any way of gathering this information ?Response:[DB] Short answer: There's no easy way to find a comprehensive listing in all the SkS comments. A search of various terms will bring up a listing of blog posts containg the terms, but one is still forced to then hunt-and-peck through the sometimes length comment threads.
If you are interested in doing it, it would be easiest (from a manhours perspective) to start from scratch.
A good starting point for research:
-
Tom Curtis at 19:48 PM on 3 July 20112010 - 2011: Earth's most extreme weather since 1816?
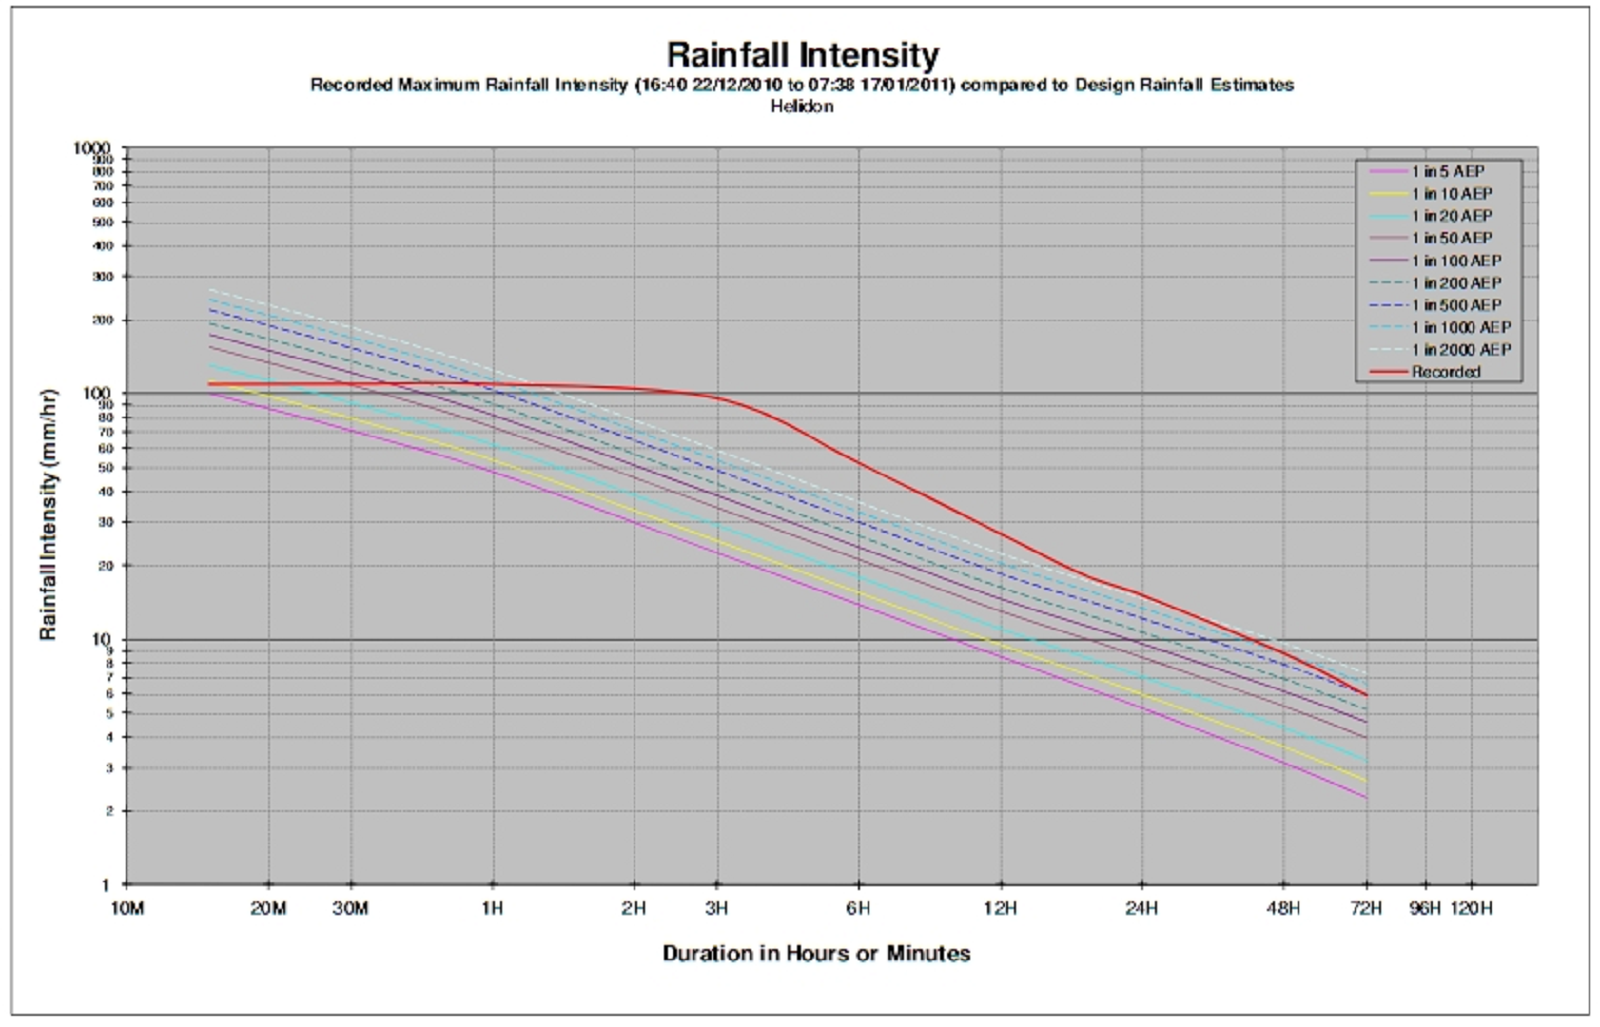
Berényi Péter @215, my figures for the Brisbane flood are based on the SEQWater report on the flood, and in particular on the Rainfall Intensity Graph for Lowood: and Helidon:
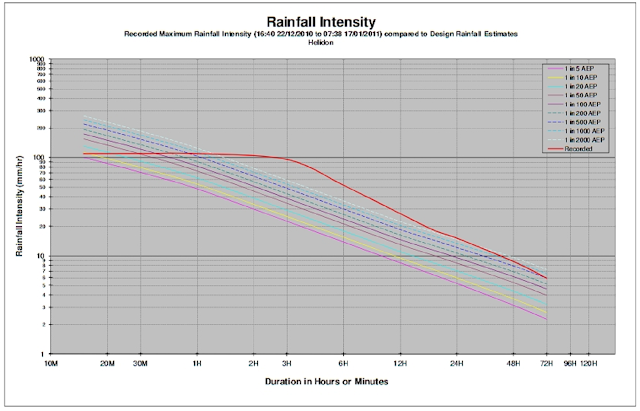 The graph plots the peak rainfall recorded for each duration at the two sites. The dashed lines show the Annual Exceedance Probability, with the highest shown being the white dashed line with an AEP of 1 in 2000. AEP's of greater than 1 in 2000 are not plotted because there is insufficient data after a century of recording to determine the values with any accuracy. You will notice the recorded rainfall intensity for periods between about 6 and 24 hours (Lowood) and between 1.5 and 24 hours (Helidon).
The claim in relation to the Toowoomba storm is based on the Insurance Council of Australia's report on the event, which states:
The graph plots the peak rainfall recorded for each duration at the two sites. The dashed lines show the Annual Exceedance Probability, with the highest shown being the white dashed line with an AEP of 1 in 2000. AEP's of greater than 1 in 2000 are not plotted because there is insufficient data after a century of recording to determine the values with any accuracy. You will notice the recorded rainfall intensity for periods between about 6 and 24 hours (Lowood) and between 1.5 and 24 hours (Helidon).
The claim in relation to the Toowoomba storm is based on the Insurance Council of Australia's report on the event, which states:
"Short-term rainfall data are available at nine raingauges in and around Gowrie Creek catchment. At six of these nine gauges, rainfall severities were greater than 100-Years ARI for rainfall durations of 30 minutes to 3 hours. At another gauge, rainfall severities were greater than 50- Years ARI. Readings at the remaining two gauges were far less severe (less than 20-Years ARI)."
So, while I did just use the probabilities from a normal distribution in determining the Standard Deviation, that just means, if anything, that I have overstated the SD which would strengthen my point, not weaken it. Your criticism may be valid with regard to the Moscow heatwave where I have relied on Tamino's analysis. The 1 in 10,000 figure assumes a normal distribution. Tamino calculates the return period using extreme value theory as 1 in 260 years. However, the Moscow Heat Wave was a significant outlier on the tail of the QQ plot.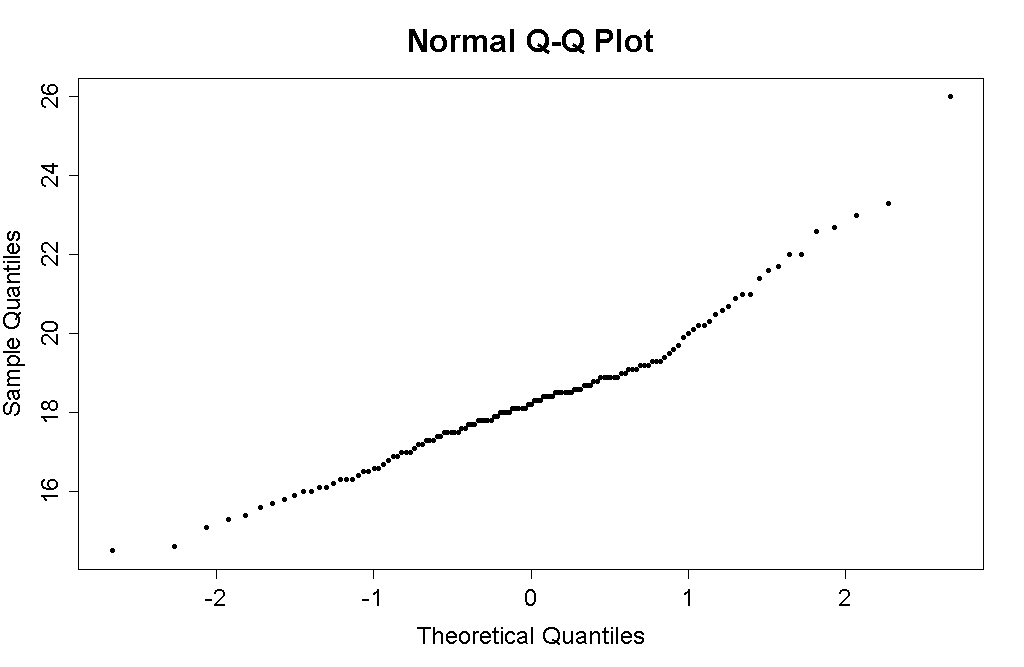 Assuming that extreme value theory or normal distributions can be used to calculate the probability of extreme outliers is a fallacy equivalent to assuming that you have a chance of rolling 13 on two loaded six sided dice. Consequently the most that can be said about the Moscow heat wave is that its AEP was not less than 1 in 260 assuming global warming; and not significantly less than 1 in 1,000 assuming no global warming, but possibly not physically realisable in the absence of global warming.
Using the best value, AEP 1 in 260 would have, again, strengthened by case against Eric's definition. If you have a problem with my using conservative values relative to my argument, let me know. Then I too can argue like a denier.
While on the topic, I disagree with Dikran about defining extreme events by return intervals. It is in fact the best practise. However, the prediction of more extreme events from global warming is not a prediction restricted to events of a certain return interval. Further, not all data sets, and in particular Munich Re's data set is not easily classified by that basis. The definition of extreme is therefore relative to a particular data set, with the only (but very important) provision that the definition of extreme used is one for which the prediction of AGW holds.
Assuming that extreme value theory or normal distributions can be used to calculate the probability of extreme outliers is a fallacy equivalent to assuming that you have a chance of rolling 13 on two loaded six sided dice. Consequently the most that can be said about the Moscow heat wave is that its AEP was not less than 1 in 260 assuming global warming; and not significantly less than 1 in 1,000 assuming no global warming, but possibly not physically realisable in the absence of global warming.
Using the best value, AEP 1 in 260 would have, again, strengthened by case against Eric's definition. If you have a problem with my using conservative values relative to my argument, let me know. Then I too can argue like a denier.
While on the topic, I disagree with Dikran about defining extreme events by return intervals. It is in fact the best practise. However, the prediction of more extreme events from global warming is not a prediction restricted to events of a certain return interval. Further, not all data sets, and in particular Munich Re's data set is not easily classified by that basis. The definition of extreme is therefore relative to a particular data set, with the only (but very important) provision that the definition of extreme used is one for which the prediction of AGW holds.
-
Glenn Tamblyn at 19:11 PM on 3 July 2011Glickstein and WUWT's Confusion about Reasoned Skepticism
Here is an example of the level of commentary at WUWT. Read it and weep (or laugh (or both)) "Phil – Visible Light cannot and therefore does not convert to heat the land and oceans of Earth. That comes from bog standard traditional science which I have outlined above. I have also gone to some considerable effort to show that “absorb” is used in different contexts, the context of “absorb” here is in the difference between Light and Heat electromagnetic energy. In this context, Visible is not absorbed to convert to heat as the AGWScience Energy Budget KT97 claims. Because it cannot. It physically cannot. It physically does not. It is Light. Light energies are used, affect, react with matter in a completely different way from the Thermal Infrared electromagnetic wave carrying Heat. Re my: ” These are LIGHT energies, which are REFLECTIVE, in contrast to HEAT energies which are ABSORPTIVE.” More nonsense there is no such distinction. But I’ve just given you the distinction. You don’t have any distinction in AGWScience fiction, because you’re one dimensional., you don’t have differences between properties of matter and energy. Read the wiki piece I gave about how real Visible light waves/photons act in the real world. Read the links to the pages on luminescence etc. That information has been gathered over considerable time by a considerable amount of people who have done real work and real thinking exploring the differences between Light and Heat energies. The myriad applications of this knowledge are in real use by real people who all live in our real world. That there is a difference is a CATEGORY distinction in REAL TRADITIONAL SCIENCE. mods – i THINK THE INTERFERENCE IS KEY STROKE HACKING. aND IT’S BLOODY Iirritating. " Lol (TeeHee (Jesus Wept!)) -
Dikran Marsupial at 19:04 PM on 3 July 20112010 - 2011: Earth's most extreme weather since 1816?
Berényi Péter While you are correct that some weather parameters are non-normal (for frontal precipitation a gamma distribution is approapriate, for convective rainfall an exponential distribution is the use model), you have not established that the distributions are not sufficiently heavy tailed for Tom's argument to be qualitatively incorrect. However, the point is moot as the statistical definition of an extreme event is based on the return period, not the standard deviation. -
Berényi Péter at 18:50 PM on 3 July 20112010 - 2011: Earth's most extreme weather since 1816?
#214 Tom Curtis at 17:20 PM on 3 July, 2011 As another example, the rains causing the Brisbane flood had an Annual Exceedance Probability of 1 in 400 for the whole event, and for the peak rainfall of 1 in 2000. That works out as lying between 3 and 3.5 standard deviations from the mean. Right, a 1 in 2000 event is 3.29053 standard deviation (which is indeed between 3 and 3.5). But only if the phenomenon examined follows a normal distribution. However, it is well known that probability distribution of weather/climate parameters are very far from being normal, in this domain so called fat tail distributions prevail. This fact leads to risk estimate distortions. Therefore your analysis does not make sense in this context. -
andreas3065 at 18:25 PM on 3 July 2011Glickstein and WUWT's Confusion about Reasoned Skepticism
@ dana I'm almost ashamed in defending Glickstein, but I think you are wrong with this: "to support a carbon tax when you have just finished arguing that carbon emissions are a net benefit is intellectually incoherent." It's not necessarily a contradiction. You can deny climate science and propose a carbon tax because of economic benefits e.g. by reducing oil imports. See for example Revkin's post about Charles Krauthammer "A Conservative's case for a Gas Tax" (http://dotearth.blogs.nytimes.com/2011/06/24/a-conservatives-case-for-a-gas-tax/). And BTW there would be also a political benefit, because it would help to take some pressure out and would help to delaying tougher climate policies. Krauthammer's version is more intelligent, because he avoids ridiculous claims about climate science. Krauthammers approach is interesting. Should I criticize him of doing a good but using the wrong reasons? If you accept WUWT being not a science blog but having a political agenda, then you could find some coherence in all this craziness. -
Tom Curtis at 17:20 PM on 3 July 20112010 - 2011: Earth's most extreme weather since 1816?
Eric (skeptic) @210: 1) The point about the size of the event is valid but irrelevant. Specifically, the events under discussion like those catalogued by Munich Re, where a tornado outbreak over three days spawning 300 tornadoes counts as a single "event". 2) Your definition of extreme sets to high a bar. Take for example the Moscow heat wave of 2010, with an expected return interval, which lay just above 4 standard deviations above the mean for July temperatures, giving it an Annual Return Interval on the assumption of a normal distribution of 1 in 10,000 years. According to your proposed definition, that only just qualifies as extreme. As another example, the rains causing the Brisbane flood had an Annual Exceedance Probability of 1 in 400 for the whole event, and for the peak rainfall of 1 in 2000. That works out as lying between 3 and 3.5 standard deviations from the mean. This is a flood that sent twice the amount of water down the river as when Brisbane got hit by a cyclone in 1974, and as much as for Brisbane's breaking flood in 1893 (also cyclone related), but this was just from a line of thunderstorms. But according to you it is borderline as to whether it should count as extreme. Or consider the Toowoomba flood. The rainfall for that flood had an AEP of just over 100, equivalent to a standard deviation of just 2.6. Consequently Toowoomba's "instant inland tsunami" does not count as an extreme event for you. The clear purpose of your definition is to make "extreme events" as defined by you so rare that statistical analysis of trends becomes impossible. You as much as so so. In your opinion, " true extremes have small numbers of events which make it difficult to perform trending". But that is as good as saying your definition of true extremes is useless for analysis. In contrast, an event with an AEP 2 SD above the mean (a 1 in twenty year event) is certainly extreme enough for those caught in the middle. Further, those events are predicted to increase in number with global warming. So why insist on a definition of extreme which prevents analysing trends when the theory we are examining makes predictions regarding events for which we are able to examine trends? Why, indeed, is global warming "skepticism" only ever plausible once you shift the spot lights posts so that the evidence all lies undisturbed in the darkness. -
Dikran Marsupial at 17:17 PM on 3 July 20112010 - 2011: Earth's most extreme weather since 1816?
Norman wrote: "I am only questioning the collection of severe weather events of 2010 and using this as proof that the warming globe is causing an increase in extreme weather that have caused more destruction and will continue to get worse as the planet continues to warm." It isn't proof, it is corroborative evidence. In science you can't prove by observation, only disprove, and constant calls for proof of AGW (which is known to be impossible, even if the theory is correct) is a form of denial. A warmer world means that the atmosphere can hold more water vapour, and thus there will be a strengthening of the hydrological cycle. A consequence of that is likely to be an increase in extreme weather in some places. Thus an increase in weather extremes is what you would expect to see if AGW is ocurring, but it isn't poof. If you think that is not good science, then it is your understanding that is at fault. That warm air holds more water vapour is observable to anyone with a thermometer and a hygrometer, compare humidity in summer months and in winter months. That water vapour has to go somewhere, as water is constantly being evaporated from the oceans by the suns heat. More is evaporated in warm condisions than in cold. Thus more evaporation means more rain. It really isn't rocket science. -
Dikran Marsupial at 17:01 PM on 3 July 20112010 - 2011: Earth's most extreme weather since 1816?
Eric Extreme events already have a good statistical definition, namely the return period, for instance an event might have a return period of 100 years, in laymans terms, a "once in a hundred year event". This definition has the advantage of automatically taking into account the skewness of the distribution. The small number of events does not pose a serious problem in estimating changes (trends) in return times. There is a branch of statistics called "extreme value theory" that has been developed to address exactly these kinds of problems. If you have a statistical background, there is a very good book on this by Stuart Coles (google that name to find tutorial articles). -
Tom Curtis at 15:58 PM on 3 July 20112010 - 2011: Earth's most extreme weather since 1816?
Norman @192, several comments: 1) The graph is not directly comparable as the CEI graph uses a 1 in 10 year definition of extreme, while Kunkel shows 1 year, 5 year and 20 year return intervals. 2) The graph you indicate only shows the period to 2000. From the data from CEI, the period 2001-2010 shows a higher frequency of one day, 1 in 10 year return period precipitation events than does 1991 to 2000, which probably means it is equivalent to 1895-1900 for 1 year and 5 year return events, but less than 1895 - 1900 for 20 year return events. It is however hard to be sure as no direct comparison is possible (see above). 3) The first interval on the graph, and the only interval to exceed 1991-2000 and presumably 2001-2010 in any category (except for 1981-1990 five day duration/ 20 year return interval) consists of only six years. It is probable that has the full decade been included the values would have been reduced, possibly significantly so. It is, of course, also possible that they would have increased them. If the four excluded years had followed the mean of the entire record, then the 1 day/ 1 year return value would have been approx 12.6%, the 5 year return value would have been 11.4%, and the 20 year return value would have been around 28.8%, values lower than or equivalent to those for 1990-1991. That would mean they are also lower than the 2001-2010 values. These three considerations suggest we should treat the 1895-1900 data with considerable caution. That the period is also the most likely to be adversely effected by poor station quality, and/or record keeping, only reinforces that caution. For example, one explanation for the different patterns between 1 day, 5 day and 30 day records (see below) may simply be that records were not taken at consistent times in the early period, thus inflating single day values without altering multi-day values. A six hour delay in checking rain gauges could easily inflate daily values by 50% or more. Having urged caution, however, I will take the data at face value (because it appears to counter my case rather than support it). That is, I will treat the data conservatively with respect to my hypothesis. Doing so, I proceeded to check the whole paper. What struck me is that though Figure 3 (extreme one day precipitation events) shows very high values for 1895-1900, that was not the case for 5 day and thirty day events (figures 4 and 5). For 5 day events, the 1895-1900 figures where less than the 1991-2000 (and presumably also 2001-2010) in all categories. The same is true for 30 day events, but in that case the number of 1 year and 5 year return events where much less than those for the 1990's. Assuming the data is genuinely representative of the decade 1891-1900, that indicates that the high number of extreme rainfall events in that decade has a distinct cause form those of the 1990's and presumably 2000's. If they had the same cause, they would show a similar rainfall pattern to the most recent decades. The difference in causation may be something common to the two periods, along with some factor present in the recent decades but not in the 1890's. More likely it is entirely distinct in that the only thing truly common between the 1990's high rate of extreme precipitation and the 2000's even higher rate is high global temperatures. In any event, the data presented ambivalently confirms the notion that the most recent period is unusual. Confirms because in two out of three periods, the 1990's and presumably 2000's represent the highest frequency of heavy rainfall events, while in the third (1 day events) the 1890's are similar but neither conclusively greater nor less than the 2000's. The data certainly disconfirms the notion that some periodic oscillation is responsible for both the rainfall extremes in the 1890's and over the last two decades because of the distinct causal antecedents. Now, having given you what I consider to be a fair analysis of the data, I am going to berate you. Firstly, drawing attention to the 1 day return interval without also mentioning the different pattern for the other durations is without question cherry picking (yet again). It is cherry picking even though you where responding to a comment about 1 day duration events because it was relevant in general, and definitely relevant to your hypothesis because it undermined it. (The original comment was not cherry picked in that the CEI data only includes the 1 day interval.) Further, your analysis was shoddy in that it made no mention of the confounding factors. That's par for the course in blog comments, but it is shoddy analysis. It is particularly so from somebody who is so scrupulous in finding confounding factors in data that does not suit you. In fact, it shows you are employing an evidential double standard (yet again). All of this is exactly what I would expect from a denier in sheep's clothing. But if by some extraordinary chance you are what you claim to be, you can't afford that sort of shoddiness. You need to look out for the confounding factors yourself, and always treat the data conservatively, ie, assume it has the worst characteristics for your preferred hypothesis. Otherwise you will just keep on proving the maxim that the easiest person to fool is yourself. -
Phila at 15:53 PM on 3 July 2011Google It - Clean Energy is Good for the Economy
I will continue to disagree with the premise that a doubling of co2 will result in a min of 2.0C temp rise. I'm sure you will, come hell or high water. As the old gag says, "you can't reason a man out of a belief he didn't reason himself into." In other not-very-surprising news, the rest of us will continue to get our information from experts who know what they're talking about, instead of non-experts who are proudly spinning their wheels in an ideological rut. -
Eric (skeptic) at 14:59 PM on 3 July 20112010 - 2011: Earth's most extreme weather since 1816?
My 2 +/- 2 cents on trends in extremeness is that true extremes have small numbers of events which make it difficult to perform trending. The extremes need to be more tightly defined than is the case above (some of the head post examples are extreme, some are not and some are ill-defined or not commonly measured). Tom's proposed definition up in post 110 which is two standard deviations from the mean for rainfall needs to be tightened up IMO. The extremeness will depend on the coverage area, time interval for the mean, and the distribution of that particular random variable. A normally distributed variable will have a relatively straightforward definition of extreme, 3 SDs in many cases and 4 SDs in most cases as long as the time period and arial extents are large enough. Here's an example of extreme rainfall events http://journals.ametsoc.org/doi/pdf/10.1175/1520-0493(1999)127%3C1954%3AEDREAT%3E2.0.CO%3B2 e.g. 10 SDs above the daily average in an Indian monsoon due to the skewness of the distribution making outliers more common than a normal distribution. The Tennessee floods mentioned above had a large area of 1 in 1000 probability so qualifies as extreme. In contrast the 2010 Atlantic season described above as "hyperactive" is not a strong statistical outlier (12 versus 7 +/- 2 hurricanes with some right skew) -
Camburn at 14:13 PM on 3 July 2011Google It - Clean Energy is Good for the Economy
actually thoughtful: This thread is about the implimentation of a carbon tax and what some percieve to be the results of said implimentation. I disagree with the projected results. I have demonstrated changes that are occuring without a carbon tax. I will continue to disagree with the premise that a doubling of co2 will result in a min of 2.0C temp rise. As far as spending, all on and off budget items, being balanced in 2 fiscal years by eliminating the Bush Tax Cuts and the increase in medicare payments, well....you are totally wrong. -
JoeRG at 12:39 PM on 3 July 2011It's the sun
KR First is that natural variability means that on a short time scale (5-10 years) 'climate' models can only give an approximation of the 'weather', where on 20-30 years they do an excellent job of looking at trends. It's not a miss unless the observations go outside the envelope of model predictions, the orange and blue bands representing the multiple-run envelope.. Therefore the fit with anthropogenic forcings is quite good. If you didn't notice, the two peaks I mentioned are begin and end of a trend that lasted about 35 years and that, after removing the noise of ENSO effects, was as straight as a temperature trend could ever be. So I didn't speak about a short time effect but about a significant climatic scenario. Besides, it is a good example for underestimation of natural forcings, especially the solar forcing. Given that the forcings are to describe as a function like in comment #845 by scaddenp, the function for the natural forcings is: (nat)Temp = Func(Sun, Albedo(clouds), Aerosols(vulcans)). Looking at the conditions shows that in this period the albedo is to assume as nearly constant and the aerosols were slightly lowering with only a very small change after 1915. So the solar forcing remained as the main driver of the occured trend. As well, if only the natural forcings were considered, this trend should have been continued until 1963 because there were no significant changes. This leads to your next statement: Third, 'global dimming' shows up in both model and measurement data as change to a downward trend around 1940. I think your statement regarding that is unfounded. Excuse me, but where is it? In the measurements clearly, but where in the models? Given the circumstances that no natural forcing had changed that far that the trend could have been stopped (in the period from '45 until '63) results in the conclusion that anthropogenic forcings were at work in the manner of global dimming. This would mean that natural forcings must have caused higher temperatures as anthropogenic forcings in this time. But this never happens in the models. Summarized: We have a model that 1) doesn't consider significant trends, 2) underestimates natural forcings and 3) shows wrong values of anthropogenic forcings. Sorry, but 'excellent' is something different. Finally, as to models - they are an important tool for teasing out the contributions and effects of different forcings, as well as a good check on our understanding of the physics involved. Such models give the impression that the physics are not well understood, at least in the climate science. Second, given recent higher grade measurements of forcings, the post 1950's fit is accordingly better in the models. Not quite. Forcings are calculated based on measured physical values and observed conditions. I suggest you read the Models are unreliable thread if you have such concerns about the use of models as tools. I didn't mean to go too far off topic, but this model that you've presented is a proper example for an analysis how underestimated solar activities are in the climate models. As I see it, because of false trails that exist (and that are powered by such bad models), the research in possible amplifications of solar forcings is too little to get a better understanding. For example, as I told before the magnetic field of the Earth weakened by 10% in the last century while the solar magnetic flux nearly doubled. I found only a view studies about this influence on climate, but most of them were made by persons that you would call a 'denier'. In the IPCC documents I found nothing at all, regrettably. As well, an influence of number and intensities of solar flares is possibe (and can of course explain the unusual hard rise in the OHC in 2003). But as long as only the last 35 years of solar activity are considered (as in the 3 topics and the IPCC reports) there will be probably no change in research. And that is not only a 'miss', it is truly a mess. -
actually thoughtful at 12:11 PM on 3 July 2011Throwing Down The Gauntlet
Camburn, The problem with your analysis is you are focusing on the wrong problem. While you are correct that oil will become fairly scarce in the next 2 decades, natural gas and coal are very plentiful. The chart below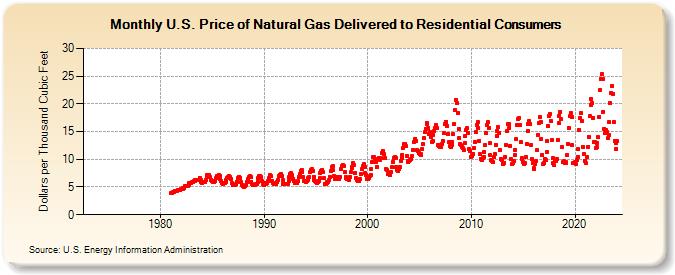 (source:http://www.eia.gov/dnav/ng/hist/n3010us3M.htm) shows you the cost of natural gas - it spiked in 2008, but is now back to 2005 levels.
Once oil prices start their inevitable rise, the world will be at a crossroads - do we convert to natural gas and coal for transportation? Or do we get off the fossil fuel roller coaster. At this moment, even with President Obama's leadership, the politics of the extreme right in the USA will not allow the rational choice. This is a HUGE problem.
So it is important to solve the right problem. You have us solving a fuel shortage - that is not the problem.
The problem is CO2 - which says eliminate coal first, then other fossil fuels as soon as possible. I am in favor of a full court press to eliminate any fossil fuel I find in my life. I think being carbon free is the most patriotic thing you can do.
As for China - PLEASE! let's bring the debate above kindergarten "but so-and-so did X" - let's get our house in order, then profit like bandits helping the other countries (see Germany as but one example).
This is why it is critical to focus on the ACTUAL problem - which is warming due to CO2 - so you don't end up with bizarre policy solutions that have no relationship to the problem (with your model you could end up with the US government actually supporting "clean coal" - what could be a dumber policy!?
Moderator Response: [Dikran Marsupial] adjusted width of image
(source:http://www.eia.gov/dnav/ng/hist/n3010us3M.htm) shows you the cost of natural gas - it spiked in 2008, but is now back to 2005 levels.
Once oil prices start their inevitable rise, the world will be at a crossroads - do we convert to natural gas and coal for transportation? Or do we get off the fossil fuel roller coaster. At this moment, even with President Obama's leadership, the politics of the extreme right in the USA will not allow the rational choice. This is a HUGE problem.
So it is important to solve the right problem. You have us solving a fuel shortage - that is not the problem.
The problem is CO2 - which says eliminate coal first, then other fossil fuels as soon as possible. I am in favor of a full court press to eliminate any fossil fuel I find in my life. I think being carbon free is the most patriotic thing you can do.
As for China - PLEASE! let's bring the debate above kindergarten "but so-and-so did X" - let's get our house in order, then profit like bandits helping the other countries (see Germany as but one example).
This is why it is critical to focus on the ACTUAL problem - which is warming due to CO2 - so you don't end up with bizarre policy solutions that have no relationship to the problem (with your model you could end up with the US government actually supporting "clean coal" - what could be a dumber policy!?
Moderator Response: [Dikran Marsupial] adjusted width of image -
Patrick 027 at 11:33 AM on 3 July 2011The Planetary Greenhouse Engine Revisited
In the same vein as my 57, see fig 10 from source in 53. It is a global annual average. It shows solar heating generally almost in balance with net LW cooling. However, I think it may be showing the part of solar heating via chemical latent heat at the point where the chemical latent heat is released. Hence the location where solar radiation is absorbed may not be the same, althouth I think it has a similar general pattern in the lower mesosphere. Anyway, that's a bit different than conduction/diffusion of sensible heat and though circulation may be involved, it wouldn't be necessary to bring fluxes into balance there (temperature would adjust as necessary to bring net LW cooling into balance with the others). There is an interesting descrepancy between the cooling and heating rates higher up - I'll have to look again but I think it may not be balanced by conduction/diffusion; perhaps there is a fingerprint of convection in the global average? But a reminder that this is forced motion, not locally spontaneous. -
dana1981 at 11:00 AM on 3 July 2011Glickstein and WUWT's Confusion about Reasoned Skepticism
Chris - there's a forehead slapper. I guess being 40 years behind the times is an improvement over being 100 years behind the times. He also had a great barrier reef decline denial post, which mentioned Ove H-G, which is nice timing, because I'm about to publish a post by Ove H-G on exactly that subject. -
Tom Curtis at 11:00 AM on 3 July 2011A Detailed Look at Renewable Baseload Energy
BBD @104, yesterday I commented that"That post [your 69] contained some good advise by Hansen, and a stack of numbers use to build up emotional weight, but no analysis."
(emphasis added) I made that comment half an hour before you asked me to comment on Hansen. But seeing you have asked:"Energy efficiency, renewable energies, and an improved grid deserve priority and there is a hope that they could provide all of our electric power requirements. However, the greatest threat to the planet may be the potential gap between that presumption (100% “soft” energy) and reality, with the gap filled by continued use of coal-fired power. Therefore it is important to undertake urgent focused R&D programs in both next generation nuclear power and carbon capture and sequestration. These programs could be carried out most rapidly and effectively in full cooperation with China and/or India, and other countries. Given appropriate priority and resources, the option of secure, low-waste 4th generation nuclear power (see below) could be available within a decade. If, by then, wind, solar, other renewables, and an improved grid prove that they are capable of handling all of our electrical energy needs, then there may be no need to construct nuclear plants in the United States. Many energy experts consider an all-renewable scenario to be implausible in the time-frame when coal emissions must be phased out, but it is not necessary to debate that matter. However, it would be exceedingly dangerous to make the presumption today that we will soon have all-renewable electric power. Also it would be inappropriate to impose a similar presumption on China and India. Both countries project large increases in their energy needs, both countries have highly polluted atmospheres primarily due to excessive coal use, and both countries stand to suffer inordinately if global climate change continues."
(my highlighting) I still think the letter contains good sense - all of it. But I have to wonder, seeing you have introduced Hansen as an authority why you are ignoring those sections that I have highlighted? Why the bitter and unenlightening attack on renewables? You asked in your 81 if I am "a little anti-nuclear"? Well, not especially. I am cautious about nuclear, and have been unable to get satisfying answers from nuke boosters on key issues. But my immediate response to Fukushima was to post a comment on this site to the effect that it changed nothing, and that specifically AGW was so great a threat that nukes cannot be taken of the table. What disturbs me most about Fukushima was not the accident itself, nor the level the disaster has currently reached. These are, in the end, engineering issues, and engineering issues are solvable, at a price. It was the blaisé assumption that things would not get worse, and the jokes about the radiation levels in bananas. It is the same nonchalant attitude to safety that caused the problems at Fukushima in the first place, and which you exhibit in your responses regarding the risks of terrorists capturing a nuclear power station. -
Philippe Chantreau at 10:34 AM on 3 July 2011Climategate CRU emails suggest conspiracy
We can only wish Wegman would be subjected to such diligent inquiry by his employing institution. As for McIntyre, he's not at risk, no institution employs him, so who will conduct an official investigation? It's good to be a skeptic; all the glory, none of the responsibility... -
Tom Curtis at 10:22 AM on 3 July 2011A Detailed Look at Renewable Baseload Energy
BBD @101: From 101: a) 64.6 trillion kWh of electricity produced by nuclear; b) 2 INES 7 events; Therefore, c) 1 INES 7 event per 32.3 trillion kWh produced by nuclear; From 69: d) 11.5 Terrawatts of clean energy capacity required; Or e) 100 trillion kWh of electricity if produced at peak capacity; Or 50 trillion kWh of electricity allowing for a peak to zero capacity cycle everyday; So F) An expected 1.5 IES 7 events per annum if fossil fuels are replaced by nuclear at current safety standards. But not to worry, the nuke boosters assure us the latest model reactors are much safer. And they have such a good track record of assessing risks:"2. No, quite the opposite. They have just performed robustly in the face of the worst earthquake ever to strike the Japanese islands. The risk of meltdown is extremely small, and the death toll from any such accident, even if it occurred, will be zero. There will be no breach of containment and no release of radioactivity beyond, at the very most, some venting of mildly radioactive steam to relieve pressure. Those spreading FUD at the moment will be the ones left with egg on their faces."
(Barry Brook commenting on Fukushima, March 12, 2011) Again you are throwing up a wall of numbers without carrying it through to an actual analysis, just as you did on your first full post on the topic. And with regard to those numbers (and your comment @103), I don't care whose numbers they where, you quoted them, and you drew an implication from them. Therefore either you defend them, or you withdraw the implication. You do not get to both disavow the "evidence" and retain it as bolstering your argument, at least not if your purpose is rational discussion or analysis rather than propaganda. -
actually thoughtful at 10:20 AM on 3 July 2011Google It - Clean Energy is Good for the Economy
Camburn: Why are you on this thread? This thread is about the economic benefit of mitigating climate change - not at the level of catastrophe avoided, but at the level of ingenuity rewarded. In post 32, point 4 you express deep confusion about the physics of climate change. Please go to the myriad of threads on this very site that explain this and understand the basic issue. Once you understand why the CO2 doubling will lead to 2C or more temperature increase, we can start with you on equal footing with the rest of us. It isn't fair to the rest of us that you bring your confusion to this thread. You could start by understanding how, if it is 1C MAX, and we haven't even doubled yet, that we are at .8C increase. Something doesn't square in your physics and/or logic. Your points have very little merit given that you don't understand the basis of the discussion. PS - your points regarding the Republican debt are consistent with your understanding of climate change - muddled and mostly wrong. But I don't find any thread on Skeptical Science appropriate for discussing them. Suffice it to say you are wrong on that issue as well. -
John Hartz at 10:00 AM on 3 July 2011OA not OK part 1
I happened across the following article posted on redOrbit. Everyone reading this thread will find it interesting. Climate Change Could Turn Oxygen-Free Seas From Blessing To Curse For Zooplankton -
JMurphy at 09:45 AM on 3 July 2011A Detailed Look at Renewable Baseload Energy
BBD : "You don't 'like' nuclear, but I don't believe renewables can even come close to the potential for displacing coal." Who told you that I don't like nuclear ? I believe it is an old, dirty and dangerous way of producing energy and that we should move as quickly as possible to renewable sources, but that doesn't mean that I don't think it shouldn't be used now, where there are no other options. It should only be a last resort, though, and only as a temporary stop-gap before renewables take over. I don't, however, like nuclear power evangelicals, who are prepared to lessen the dangers and constantly see the best - as the UK government and Brave New Climate did, literally days after the accident. That is called wishful, blinkered thinking. What you believe about the potential for renewables is just that, though - your belief. BBD : "You might want to ponder what a widespread and prolonged failure of the European supergrid might look like. How many fatalities would you expect?" I have no idea. Perhaps you have a number you can believe in ? BBD : "I had a feeling someone would bring up the news from Japan." Sorry to bring up uncomfortable news. That is life that cannot be swept under the carpet or PR'd away. BBD : "However, your anti-nuclear sniping requires an answer" Not being anti-nuclear, I can only assume that what you call anti-nuclear (without any evidence) is actually anti-nuclear evangelism. Guilty. BBD : "But nuclear has been around for longer than you might think." So why does it still need to be subsidised and secretly pushed by governments ? Can't it stand on its own feet and pay for itself yet ? How long more does it need before it can do that ? BBD : "Yet since the vast majority of reactors came on line in the last 40 years, there have been 18 incidents that merited a rating on the International Nuclear Events Scale (INES). It is important to remember that in operational terms, this is 18 incidents in 11,255 years." Very safe indeed but how many industries can you think of which require long-term evacuations from large areas, as well as intensive and expensive clear-ups, after an accident ? How do you think it feels to have survived a natural disaster, only to be told that you cannot live your life in some form of normality afterwards because a power source miles away means it is unsafe for you to return to your home ? BBD : "Anyone who says that the anti-nuclear lobby should not be allowed to make comparisons with Chernobyl is absolutely correct. It is a grotesque misrepresentation. There have been no fatalities and none are currently expected. In other words, such contamination as may have occurred is likely to be minor and transient." Something about your confident predictions of future non-deaths and minor inconvenience is very troubling and, again, marks you out as a nuclear evangelist. There is a very simple comparison with Chernobyl, though you may wish to lessen it : both were maximum Level 7 severity, involving a major release of radiation with widespread health and environmental effects. The fact that you try to lessen the seriousness, speaks volumes. -
JMurphy at 09:41 AM on 3 July 2011Climategate CRU emails suggest conspiracy
batvette wrote : JMurphy, is this statement disinformation or false? "Michael Mann's conduct was examined by an internal, not independent, review board of the entity which employed him and stood to lose credibility if it were revealed he acted improperly." This is what I've been saying, it's all that I'm saying, (on that matter) and if you are going to accuse me of "purveying disinformation" please specify what about it is. It's very simple : The guidelines for such an investigation - acceptable to be used for any other individual except Dr Mann, according to the so-called skeptics, it would appear - are : The Committee shall consist of at least five tenured University faculty members, each of whom should have no conflict of interest and be competent, in the judgment of the Vice President for Research, to evaluate the questions before the Committee. In this case, the individuals involved came from the Departments of Biology, Chemistry and Physics, Computer Science and Electrical Engineering, Anthropology, and Human Development and Family Studies. Again, unbiased enough for any individual except Dr Mann, presumably. Ultimately, if Dr Mann had acted improperly, and it could be proved that he had, the university would have been more than keen to ensure that punishment would have been swift and proportional - if only to preserve the integrity and professionalism of the university itself. The fact that it found no such thing, due to the distinct lack of any form of evidence in the real world, still smarts with the so-called skeptics. Less of the disinformation and more of the facts, please. -
Tom Curtis at 09:34 AM on 3 July 2011Google It - Clean Energy is Good for the Economy
Camburn @36, if you accept that "economics works", you would also accept that large, uncosted negative externalities distort the market and reduce overall wealth. Such uncosted negative externalities would therefore be anathema to you, and you would be looking for the most efficient means to either place a price on the externalities, regulate it out of existence, or ensure a payment from the producer of the externalities to those suffering its effects. In the case of GHG emissions, the most effective way to do that may be to introduce a carbon tax either with a dividend to end users on some basis (and there are different ways of paying the dividend), or subsidy to low carbon energy producers. It may be a cap and trade scheme. It may be a legal requirement for carbon emitters to fund expected payouts for damages arising from loss of habitat, and health effects from global warming going forward. But not doing it is not assuming that economics works, but that it doesn't. -
Camburn at 09:34 AM on 3 July 2011Google It - Clean Energy is Good for the Economy
The rate of rise will slightly slow, but the debt will not lessen. -
Camburn at 09:32 AM on 3 July 2011Google It - Clean Energy is Good for the Economy
actually thoughtful@31: Mr. Hansen has made predictions concering sea levels in the past that have not born out. 2. This is not a Republican "deficit". This is a mutual one. The tax cuts of 2001 and 2003 were idiotic, but that is not the crux of what you said. I understand that you limited your comment to the constraints of a budget. SS is not included in the budget. When you add the increased funding required for SS and Medicare, even allowing the physician increase to lapse, the financial health will not correct itself by 2014. The rate of rise in the debt will slightly slow from present levels, but it will certainly not lessen. This is also from CBO. 3. The free market is already harnessed to decrease energy consumption, and it has started. As energy prices rise, you will see an excalation in this trend. 4. Co2 is a greenhouse gas, the physics show approx 1.0 for a doubling of co2. I am in no way convinced that the temp rise will be 3.0-6.0C.; hence I am not concerned about long term effects. I am concerned about current economic distress which is becoming more apparant all the time. Point #7. In order for the US to service just the interest on its current debt, with spending projections from CBO used, will require a tax increase of 6-8%. Add another tax on top of this debt service will stiffle economic growth. The free economy is much better at inovation/invention than the government is. Concerning medicare. When I was inocculated it cost my parents $5.50. When I broke my arm, two days in hospital, xrays etc.....total cost was 114.76. My father still has the bill. Older folks who are now recieving medicare at current tax rates are exceeding the revenue stream. To substain that care, taxes are going to have to go up. Health insurance is a pool and off topic. We can debate that one at another time. -
BBD at 09:31 AM on 3 July 2011A Detailed Look at Renewable Baseload Energy
dana1981 My apologies. I didn't realise you were an energy expert. -
Chris G at 09:25 AM on 3 July 2011Glickstein and WUWT's Confusion about Reasoned Skepticism
Watts posted a doozy today: "This makes me wonder if the temperature dip in the 1970′s where everyone was worried about global cooling wasn’t partially driven by atmospheric aerosols." I pointed out that Watts is where Schneider was 40 years ago. "Atmospheric Carbon Dioxide and Aerosols: Effects of Large Increases on Global Climate" (Science 173, 138–141) -
dana1981 at 09:22 AM on 3 July 2011A Detailed Look at Renewable Baseload Energy
Hansen is a climate science expert, not an energy expert, so I don't defer to him on energy issues. -
actually thoughtful at 08:25 AM on 3 July 2011Google It - Clean Energy is Good for the Economy
Camburn @26 Your points # 1 is easily disproved by looking around this site. Please do so. Hansen says BAU could produce over 2 meters of sea level rise this century. Point # 2 is mostly useless in this debate because the debt is a Republican issue, not a real issue. If we wanted to eliminate the national deficit in the USA - we just have to do nothing. The law calls for the end of the Bush era tax cuts, and the end of all the Medicare "Doc fixes" - these two things alone would end the deficit by 2014 (according to the CBO). Also, this post talks about the economic increase that accelerating the switch to renewables will bring. Economic growth will reduce the deficit, assuming spending is limited or reduced (which certainly appears to be the case) Your point # 3 is exactly the point - adding a carbon tax will harness the free market to mitigate climate change risk. You are presenting arguments for my perspective. Thank you. # 4 is, AGAIN, exactly the point! If we don't handle climate change and soon, "the economic distress will cause enormous human distress that will result in wars, famine, etc." We don't need to fix health care right now, we don't need to fix the deficit right now - we do need to fix our relationship with the environment, from where all wealth comes from. Thus the push for a carbon tax. Points 5&6 indicate a willingness to set the bar too low. Sure, we are seeing a small, slow growth in renewables. But compared to the overall energy puzzle, renewables are too small, and the current trend (BAU) leads to the planet shifting into a mode that is hostile to happy humans. Point # 7 is counter to the evidence presented in this post. It is counter to our experience with the ozone layer and with acid rain. What is your evidence (not ideology) to support this claim? Everything we know tells us the opposite is true - that a carbon tax will spur an economic boom by setting the conditions for economic expansion as we switch from carbon based to renewable based energy. It is interesting to me, given how well you understand things at point # 3 & 4, how your conclusions don't follow. You point out that government involvement in Medicare causes increased costs and poor execution. Where are the millions of seniors rising up demanding changes to Medicare? Oh, wait. Those millions of seniors are demanding NO changes to Medicare. OK - well what about the worldwide consensus that the US military is a paper tiger, and easily defeated? Oh, wait - the US military is the most respected fighting force in the world. So two of the largest programs the US government undertakes are incredibly effective, and whether they would be cheaper in the private sector is somewhat debatable, but I notice the private sector is not doing very well in these two area (Blackwater as one example in the military space -we know how effective they are, and health insurance - the most beloved industry in America... NOT). So, as near as I can tell, your conclusions don't follow from the evidence you presented, and are demonstrably false to boot. Care to try again? -
BBD at 08:19 AM on 3 July 2011A Detailed Look at Renewable Baseload Energy
I really should have posted a link to this article on the Science Council for Global Initiatives site earlier. Please note the SCGI members list on the left of the page. -
Patrick 027 at 08:18 AM on 3 July 2011The Planetary Greenhouse Engine Revisited
And if, at the same frequency, the tropopause and mesopause can both emit radiation, the would also absorb each other's radiation, to the extent the intervening space is transparent (which it isn't!) and to the extent they can emit (relative to the Planck function). Of course the whole upper atmosphere is nearly transparent over some spectral bands, over a broader interval than the 'atmospheric window' and more transparent than the 'atmospheric window'. (the atmospheric window, roughly 8 to 12 microns (interupted by ozone somewhere around 9 or 10 microns) is a band where a sizable fraction of radiation from the surface can reach space, absent clouds or high humidity levels. Aside from ozone, Most of the non-cloud opacity in the atmospheric window comes from water vapor and most of that is in the lower troposphere) But there isn't a particularly greater abundance of greenhouse gases near the tropopause or mesopause than in between (in fact ozone has a maximum in between), so at wavelengths where emission from the regions of the tropopause or mesopause is significant (relative to the layer thickness, which is extremely small for anything above the stratosphere), so would be emission and absorption from the intervening layer. -
BBD at 07:56 AM on 3 July 2011A Detailed Look at Renewable Baseload Energy
dana1981 I have talked about nothing but practicality since I joined this thread ;-) The various counter-perspectives I have see here have not, so far, been convincing. Why do you think Hansen said what he said in his letter to President Obama? -
Camburn at 07:47 AM on 3 July 2011Throwing Down The Gauntlet
Actually Thoughtful@18: I have made a suggestion in another thread that to take action does not require even talking about climate. 1. Base action on economics. We know that coal/oil/gas etc are finite. We know that in an expanding world energy use will continue to rise as that raises the standard of living. 2. We know that energy costs are going up. That premiss is born from pricing facts and is indisputeable. 3. We know the reason they are going up. Inelastic demand as well as inelastic supply. 4. The way to address the supply side is with another source of energy. 5. Given demand curves, given supply curves are easy to observe with the naked eye, and are indisputeable. The above items are well known. Rather than focus on an elastic sensativity, focus on the inelastic reality. It would be a very easily sold concept in the USA where the population as a whole is well educated. It will take leadership, of which the USA seems to be short on at this time. China is a different story. The Chinese have money, they are building 2 new coal fired power plants every week. India is not far behind. The environmental record of both of those nations is certainly not something to be proud off. To get the Chinese and Indian people to stop consuming coal at the present rate of increase is going to be extremely difficult. Rather than focus on co2, I still suggest focusing on finite resources, and the way to overcome the disadvantage of consuming these. -
dana1981 at 07:35 AM on 3 July 2011A Detailed Look at Renewable Baseload Energy
I think 20% is at the low end of the likely renewable contribution by 2050. I suspect it'll be closer to 50%. Most of the rest will probably be natural gas and nuclear. Hopefully you're right about Gen III reactors. Looks like China is building a few. Time is still an issue, with at least 5 years of construction, and a number of years of planning before that. People may delay construction of certain renewable projects, but they generally support the technologies. That's a problem for nuclear power. Wind turbines have very little land impact - the ground between turbines can be used for other purposes. Solar can be placed in deserts and on rooftops. Wind turbines can also go offshore. And so on and so forth. Renewable land impact really isn't a concern. You'll get a few whiners complaining about individual projects, but not enough to make a significant difference. But a lot of people have major concerns about nuclear power. I'm not saying they're necessarily justified - many aren't. But that's the reality of the situation, as long as we're talking about practicality :-) -
Albatross at 07:30 AM on 3 July 20112010 - 2011: Earth's most extreme weather since 1816?
Norman @208, "I am not debating the issue if the planet is warming" Good, but you miraculously manage still miss the point entirely...it was an analogy. "You need to prove that a warmer world will lead to more storms or floods or droughts by at least providing a mechanism on what a warmer world will effect." Strictly speaking one cannot prove anything in science. That is just how it is. Now, I am going to spend some time with my family. -
BBD at 07:09 AM on 3 July 2011A Detailed Look at Renewable Baseload Energy
dana1981 I agree that there's no silver bullet. I agree that renewables will play a substantially increased role in the global energy mix - perhaps even as much as 20% by 2050. Which leaves 80% on the table. Which I think was Dr Hansen's point. I disagree that Generation III nuclear plant will be problematic in terms of cost or construction rate. I agree that there will be public opposition to new nuclear, which is why anti-nuclear lobbying is so dangerous from a climate perspective. I would like you to consider why you ignore the certain public opposition to the enormous environmental and landscape impact from the footprint of even a 20% renewables contribution to the global energy mix. I agree that we will build smarter grid infrastructure and increase energy efficiency (and applaud that thought). I am concerned about your last paragraph. You do not seem to have absorbed much of what has been said above, eg 96, 98, 99.
Prev 1599 1600 1601 1602 1603 1604 1605 1606 1607 1608 1609 1610 1611 1612 1613 1614 Next


