


 Arguments


Recent Comments
Prev 1604 1605 1606 1607 1608 1609 1610 1611 1612 1613 1614 1615 1616 1617 1618 1619 Next
Comments 80551 to 80600:
-
owl905 at 15:41 PM on 1 July 2011Roy Spencer on Climate Sensitivity - Again
A few years ago, Spencer forwarded the idea that the increased CO2 was released from the ocean as a natural response to heating. Now he's arguing for low sensitivity because of a missing heat buildup in the upper layers. His supporting 'model' is an icon to his scientific abilities. -
peter7723 at 15:34 PM on 1 July 2011Ocean acidification: Coming soon
I notice the first point is "OA is not OK", which assumes the question "Is OA OK?". That's fine, but answers are only "Yes" or "No". A better question is "What are the consequences of OA?", one impact being on calcium carbonate and the disadvantage this impact has. Are there other impacts to be explored? -
Camburn at 14:56 PM on 1 July 2011Websites for Watching the Arctic Sea Ice Melt
Thank you Tom. I have tried posting pictures, but have not had success at that yet. I do not dispute that there is less ice now than in 1944. What I was trying, and apparantly failing to present, was that in 1944 the ice extent had to be substantially less than say 10 years later. And for the St Roch to make the passage in 1944 was a feat unto itself. I read the link to Tamino's post. I have a couple of problems with how the data for ice conditions in the past was assembled, but nothing that would change the overall trend. Thank you again for posting the above. -
Norman at 14:52 PM on 1 July 2011OA not OK part 1
Heraclitus @12 My post was not a criticsm of a long series of post. Just wanting to make sure they do not leave this out in future discussions.Response:[DB] Your concern is noted, but misplaced and premature. Let us sit back and let the experts first share their knowledge before we students critique it.
That would be the scientific thing to do.
-
Camburn at 14:46 PM on 1 July 2011Oceans are cooling
scaddenp: The ARGO data has essentially been flat for the 0-700 meter area. If the data begins a warming trend I would have to look at the Aqua brightness, the solar winds etc to try and interpret the trend. If the data continues with the flat to cooling trend, then I am going to have to try to understand why. There are so many facets that affect OHC besides co2. Yet, the ocean is the "buffer" per se for our climate. To put it in a nutshell, I really have no position. If the ocean is stable to cooling,surface temps will follow. We are in an unusual situtation right now. Our atmosphere has shrunk by over 150 miles...which is huge. I am at the point where astro physisits have become much more interesting that climate scientists. I have studied climate as much as I can for decades. I had the premiss that the sun did not play a large part in the recent climate. I am not as sure anymore as the findings of even just the past 3 years have thrown a curve ball into what little I thought I knew. I asked Dr. Svalgaard to send me a link to his new paper on TSI, where he shows it has been virtually constant for well over the past century. That threw a curve ball into the early 20th century warming, and if it becomes accepted will throw a curveball into the GCMs. A rather rambling post, it is late here and I am tired. The best we can do is go with what teck shows us. -
Norman at 14:45 PM on 1 July 20112010 - 2011: Earth's most extreme weather since 1816?
Tom Curtis @ 180 I would like to respond to your good post about the earthquake events and I would like to demonstrate intellectual integrity. This line of reasoning is based upon your post of the Munich Re graph demonstrating an increasing number of weather related disasters. I suggested the possibility due more to population increase rather than climate change of more extremes. Before I can comment I need a really good definition of disaster. I looked at your Munich Re report and they did not give a definition of what they were using to build their charts. I looked at this web page... Is this Munich Re standard for Disaster classification used on their graphs you posted?. "International Strategy for Disaster Reduction (ISDR), at least one of the following criteria must be met: • a report of 10 or more people killed • a report of 100 people affected • a declaration of a state of emergency by the relevant government • a request by the national government for international assistance" 3 of these are absolute and easy to quantify. The 2nd one is elusive as it does not further define affected. Is this an injury? How bad of an injury? In my hometown a few years ago we had a strong hail storm that damaged many roofs in our community (including mine). At least 100 people had their roofs repaired so would this be listed as a disaster? Or say 100 cars in a parking lot during a hail storm that triggers insurance claims? Or a snow storm that does not cause any death but leads to 100 hospital visits caused by shoveling snow? Without a strong definition of what is counted as a disaster it becomes difficult to carry on this line of reaoning. If you are able to give a more certain definition of disaster I will be able to more reasonably explain my point on the earthquake vs weather related difference in slope on the Munich Re graphs. Thanks! -
OPatrick at 14:43 PM on 1 July 2011OA not OK part 1
Am I the only one thinking that criticising part 1 out of 18 of a series for being simplistic and missing things out is perhaps a bit pre-emptive? -
Tom Curtis at 14:38 PM on 1 July 2011Websites for Watching the Arctic Sea Ice Melt
Camburn @171, the following map shows the routes took in his two transits of the North West Passage: As you can see, in his east to west passage he took a northerly rout between Victoria Island and Parry Island, before diverting into the strait between Victoria Island and Banks Island.
Below is the September sea ice extent in 2010:
As you can see, in his east to west passage he took a northerly rout between Victoria Island and Parry Island, before diverting into the strait between Victoria Island and Banks Island.
Below is the September sea ice extent in 2010:
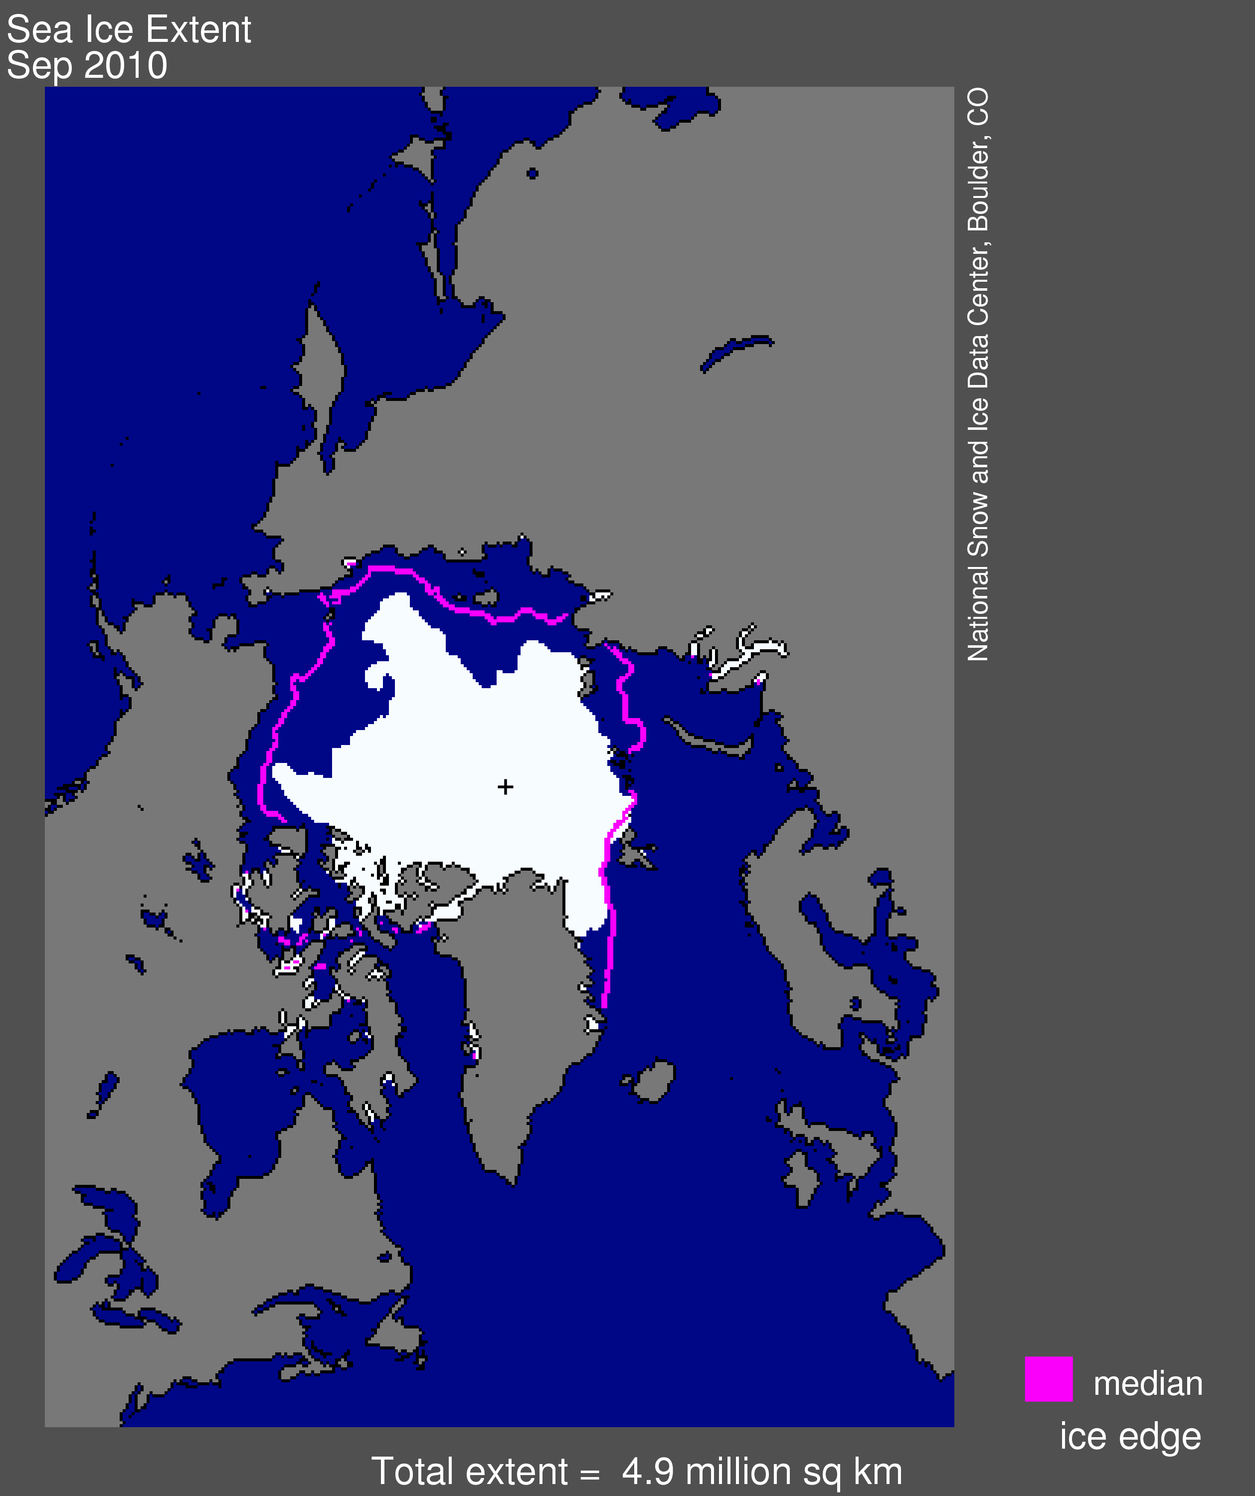 As you can see, the passage between Victoria Island and Melville Island is entirely clear of ice, as are the waters just north of Banks Island. Ironically, a thin hulled boat could not retrace Larson's route precisely because of ice in the strait between Victoria and Banks Island, but could easily traverse the more northerly rout. Larson traversed these waters during September, exiting Bering Strait on September 27th, so the ice record is directly comparable, and clearly there is much less ice than in 1944.
To put that into perspective, the following is the route taken by "Northern Passage" when it circumnavigated the Arctic in a single season in 2010, one of two sail boats to do so:
As you can see, the passage between Victoria Island and Melville Island is entirely clear of ice, as are the waters just north of Banks Island. Ironically, a thin hulled boat could not retrace Larson's route precisely because of ice in the strait between Victoria and Banks Island, but could easily traverse the more northerly rout. Larson traversed these waters during September, exiting Bering Strait on September 27th, so the ice record is directly comparable, and clearly there is much less ice than in 1944.
To put that into perspective, the following is the route taken by "Northern Passage" when it circumnavigated the Arctic in a single season in 2010, one of two sail boats to do so:
 The entire trip took 115 days, and just 26 days to transit the North West Passage. The other boat to complete the trip, the St Peter just beat them for the record of being first to complete the double transit in a single season. (And yes, I did notice that they in fact took the southern rout, I assume out of caution. But the ice would have permitted the northern passage.)
-
OPatrick at 14:15 PM on 1 July 2011Throwing Down The Gauntlet
Ah... I see. Note to self - choose red in future.Response:[DB] Ex-actly.

-
scaddenp at 14:05 PM on 1 July 2011Websites for Watching the Arctic Sea Ice Melt
#172 - Camburn, I have responded here -
scaddenp at 14:03 PM on 1 July 2011Oceans are cooling
Camburn, good to see you agree on value of the Argo instrumentation. Hansen has taken a punt on what he expects OHC to do over next few years. What's your position if he turns out to be correct then? -
Camburn at 14:01 PM on 1 July 2011Arctic icemelt is a natural cycle
DB: Note I said the NE passage when talking the Komet. Sorry, but I don't go to climate 4u. skywatcher: Where have I posted that there is not a sharp decline presently in Arctic Ice? I have posted papers that show the variability in Arctic Ice over a long time period. I will state again, for Capt Larson to have made the voyage in 1944 was a feat and a testament to the conditions that year. This also coincides with the period that Greenland had temperatures just slightly lower than present. Here is the route of the St Roch. Note that it went between Banks Island and Victoria Island. Watch the ice this summer and see if this lane is ever passable. Norther RouteResponse:[DB] I looked up your comment:
"During WW2, the Northest Passage was also sailed by German Warships......remember? If you don't you can look it up. Some simple history items are well known."
Fortuitous typo? A thinly veiled attempt at a snarky witticism? Be it known that your narrative you are pursuing is from the Climate4you/WUWT/CA playbook and that our patience with it...grows thin.
From time to time you show signs of being an actual skeptic and then you return to form. So be it.
Please support assertions with links to peer-reviewed science, construct your comments to comply with the Comments Policy and also ensure that they are on-topic in the future.
-
skywatcher at 13:55 PM on 1 July 2011Websites for Watching the Arctic Sea Ice Melt
#149 Philippe,, #159 Eric - interesting that 2011 does not show the same sharp decline in June, yet at the end of June, 2011 lies below 2007 on the IJIS graph. Whether it remains so will depend on the melt rate and wind patterns in July. The data for ocean temperatures do not look encouraging for ice retention this year, and when put together with this recent article by Peter Sinclair, it's not encouraging news. #166 Camburn, it's helpful if you want to link to something, especially if it's behind a paywall/a book, that you either summarise the source or provide a quote, or else we have no idea why you have linked to a source, or if the source is relevant at all. As you have not even provided a page reference, let alone any material with which we could evaluate the source (despite repeated requests), I am forced to conclude you don't have much evidence to support your point of view. I can assure you you won't taint my understanding by actually providing information that supports your point!Response:[DB] To further your point, comments consisting of links without a demonstration of an understanding of the materiel linked to as well as a sharing of why the information therein is important (GUTFC: give us some context as to why its important) simply beg for deletion.
-
skywatcher at 13:32 PM on 1 July 2011Arctic icemelt is a natural cycle
#35, also worth reading Polyak et al and associated data links within to get a context of Arctic ice variability over the past century and also Holocene. You're embarrassing yourself by suggesting that there has been anything other than a sharp decline in Arctic ice since about the 1970s. The last time extents were as low is reasonably well-constrained by dating of wood on old shorelines and of wood trapped in ice shelves - several thousand years ago. [caused by higher Arctic insolation in the early-mid-Holocene]. As Michael Sweet and Bibliovernis have shown, there is no evidence that ice levels in the 1940s were anywhere near today's levels. Anecdotes of sailors commenting on the lack of ice have to be placed in context - a context of a very large amount of ice up there in the early part of the century. Their 'lack of ice' could easily be a great deal of ice by today's standards. A bit like a Scot thinking a day of 20C is hot, which makes sense if you live in Scottish summers, but would make no sense for somebody from Italy! -
dana1981 at 13:24 PM on 1 July 2011Roy Spencer on Climate Sensitivity - Again
What really irritates me, which Chris touched upon in the article, is that after Spencer comes up with these 'silver bullets' based on oversimplified models and over-tuning of parameters until they're no longer physically realistic, he then claims that he's the only one who "gets it" and other climate scientists are either stupid or ignorant or hiding something. He doesn't consider the possibility (reality) that he hasn't made a valid physical argument. Hence the aggravating quote:"These folks will go through all kinds of contortions to preserve their belief in high climate sensitivity"
Yes, all kinds of contortions like doing real physics with reasonably realistic models. Such contortions! -
Stevo at 13:07 PM on 1 July 20112010 - 2011: Earth's most extreme weather since 1816?
Norman @178 The trouble with the eyecrometer is that it is entirely subjective and prone to cherry picking. My eyecrometer looks at the last year and sees a series of work trips to remote sites cancelled due to floods in Queensland and Western Australia, my home town of Brisbane flooded, and a return trip from a desert site where we had to push vehicles across five kilometre wide puddles while up to our arsecrometers in flood water. When the subject came up recently amongst my colleagues about the frequency of extreme weather events I showed them the graphs presented by Tom Curtis @55 on this thread. Eyebrows were raised and comments were made that there was proof of a trend over time towards more extreme events. The question was asked about what might be causing this. When told the answer was that it was a likely outcome of AGW and was consistant with scientific predictions, half the peopled gathered just walked off in a huff mumbling about lefty conspiracies and the other half stopped and gave the matter some thought. Our groups' observations of local problems due to weather were just cheerypickings until they could be incorporated into a broader picture. When that picture was revealed in the form of a graph, all were initially convinced that there was a pattern developing. Once AGW was identified as the cause the denialists broke away and claimed it must be some kind of political fabrication. Like I said, its all subjective. The eyecrometer is simply not enough to go by. -
Bibliovermis at 13:00 PM on 1 July 2011Arctic icemelt is a natural cycle
The catamaran passage wasn't a freak event either. 30 recreational boats have completed the voyage in the past decade. The ease of passage through the Northwest Passage is a matter of significant political importance for Canada, the US & Russia. Parliament of Canada: The Northwest Passage and Climate Change -
Chris Colose at 12:52 PM on 1 July 2011Roy Spencer on Climate Sensitivity - Again
There's no ocean physics. All he's doing is tuning several parameters in his "model" to match observations or a particular AOGCM. There are models that don't have 3-D ocean physics which have credibility (of course, depending on what you're trying to do with it), but Spencer's work is well below this level and is simply not credible. Some of the models I listed can be played with by anyone on a PC and have more realism, but even something like EdGCM is well below what is in today's models. Spencer has a long history of making sweeping statements about "big issues" (like climate sensitivity) completely independent of whether he has the data to justify those statements, but he hasn't set up any paradigm shift in the community. I don't suspect he will either. -
Norman at 12:51 PM on 1 July 2011OA not OK part 1
This one is old 1972, but if the experimental method described is sound the science is still good regardless of the date the experimentation was done. According to the author, sea water is a much more complex beast than the equations posted above. The other ions in water (such as Magnesium and Sulfate among others) influence the pH buffering system of seawater. Buffering action of sea water. A point made from author's perspective: "Control of pH in this fashion is by means of a pH-stat rather than through a buffering system. The capacity of the system is huge; at 348 ppm CO2 in the gas phase, a concentration reasonably near the normal CO2 content of the atmosphere, the extreme difference in ionic compositions produced a difference of only 0.25 pH units. Over the extreme range of CO2 concentrations, O-696 ppm, the largest pH difference was 1.4 pH units. For scawatcr with normal ionic ratios, a doubling of the CO2 content of the air would lead to a change of only 0.30 pH units an amount about cqual to the normal range of variation of seawater pH." The purpose of this post is to make sure not to miss the reality that the processes going on with seawater are more complex than a few equations. -
Bibliovermis at 12:43 PM on 1 July 2011Arctic icemelt is a natural cycle
In 2007, a lightweight catamaran made the 3,200-mile Northwest Passage voyage entirely by sail. Peter Semotiuk, who runs a single-band sailor's radio network at a port in the middle of the passage, completed the voyage in 1988 and said: "This summer [2007] the passage was largely wide open. It's a very different picture to say 20 years ago, when I travelled the length of the passage." Corporal Henry Larsen's St. Roch was made from extra thick timbers of Douglas Fir, sheeted in Australian gumwood and powered by a diesel engine. University of Calgary: The Larsen Expeditions BBC: Plain sailing on the Northwest Passage -
Trueofvoice at 12:40 PM on 1 July 2011Roy Spencer on Climate Sensitivity - Again
I apologize for my ignorance, but when you say Spencer is modelling purely on ocean diffusion, do you mean he assumes heat evenly diffuses throughout the seas without considering upwelling, convection or conduction? -
adelady at 12:06 PM on 1 July 2011Arctic icemelt is a natural cycle
Fortuitously, Peter Sinclair has just posted this item on why the melt is so fast. Yet another reminder that air temperature and SST cannot give us the whole story. -
Camburn at 12:01 PM on 1 July 2011Arctic icemelt is a natural cycle
michael: Capt Larson made the voyage in 1944 through the northern route. Even last year his route was not passable. Live with it, it is history. IF you lived near the Arctic, you may know that the Canadian Coast Guard replenishes supplies on an annual basis to the northern stettlements. It has been doing this for decades. Just the way it is. During WW2, the Northest Passage was also sailed by German Warships......remember? If you don't you can look it up. Some simple history items are well known. How can I question cyrosphere? Quit easily. It is a graph posted with no supporting data prior to 1979. Sorry that my 3.5 prediction with the support of the Shindell/Schmidt paper, russtles your feathers it seems.Response:[DB] Assertions without links to sources will be disregarded. IIRC, the Komet took the NE passage, not the fabled NW passage (so even that does not help you).
BTW, Climate4you is a blind guide: it will lead you astray.
"How can I question cyrosphere? Quit easily. It is a graph posted with no supporting data prior to 1979."
Study this link for a history of Arctic Sea Ice, how to find the data on it...and how to properly analyze it.
Or you can email your questions to the good people at the Arctic Climate Research at the University of Illinois here: cryosphere-science@atmos.uiuc.edu
-
michael sweet at 11:50 AM on 1 July 2011Websites for Watching the Arctic Sea Ice Melt
Camburn, I posted a response here. -
michael sweet at 11:48 AM on 1 July 2011Arctic icemelt is a natural cycle
Camburn, You need to stop posting gibberish about things you do not know. This Wikipedia article documents that the entire Northwest passage was ice filled until 10 years ago. Your assertion that it has been passable by non-icebreaking vessels for decades is simply untrue. Capt. Larsens voyage has been replicated in recent years, in only a few weeks to make the passage, it is no longer remarkable for a light icebreaker to transit the NW passage. It is remarkable that someone who posts so little data is so fast to question scientists who actually measure the Arctic ice. How can you question that work when you have no idea how they measured it? -
GrahamC at 11:43 AM on 1 July 2011OA not OK part 1
Doug, I still can't see justification for your claim that the fromation of calcium carbonate is a source of carbon dioxide, not a sink. Could you please explain it to me again, including the formation of the bicarbonate ions in your explanation? -
adelady at 11:42 AM on 1 July 2011Websites for Watching the Arctic Sea Ice Melt
Eric "...the North Atlantic is particularly cold this year, and will not provide warm waters to increase melt." But the far North Atlantic is not so congenial. Check out this animation of DMI/COI SST anomalies for June as shown at the Arctic Sea Ice blog mentioned in the post. -
Doug Mackie at 11:33 AM on 1 July 2011OA not OK part 1
We are gratified that some find this simplistic. However, the quality of comments at this blog and elsewhere suggests that there are many who do not find this chemistry simple at all. @mb: Yes you are missing something. You are missing the point of this post which is that just because you can write a balanced equation does not mean it is a correct equation. Your set of equations is: What do you think happens to the 2H+ ?
Though we invoke it later ourselves, Le Chatelier's principle is no longer taught as such in most chemistry courses. Instead it is better to compare the equilibrium constant (K) with the reaction quotient (Q).
What do you think happens to the 2H+ ?
Though we invoke it later ourselves, Le Chatelier's principle is no longer taught as such in most chemistry courses. Instead it is better to compare the equilibrium constant (K) with the reaction quotient (Q).
-
Marcus at 11:28 AM on 1 July 2011Throwing Down The Gauntlet
Eric. No need for massive flooding to provide Hydro-electric power. There are a number of hydro-power options that don't require large dams or back-flooding. http://en.wikipedia.org/wiki/Small_hydro http://en.wikipedia.org/wiki/Run-of-the-river_hydroelectricity http://en.wikipedia.org/wiki/Microhydro_systems -
Dave123 at 11:26 AM on 1 July 20112nd law of thermodynamics contradicts greenhouse theory
I don't want to revive a dead thread, but I've noticed that the responses on 2-nd law violation tend to be a bit um... dry. So I thought of an analogy that might...err resonate. Consider pushing a child in a swing. You aren't strong enough to push the swing very far in one push. But each cycle of the swing you can push a bit more and the higher the child goes. The kinetic energy of the swing can greatly exceed what you've put in in any one push. However, eventually you reach a point where the energy you put into the swing is completely dissipated on any cycle.... the swing goes no higher. This isn't obviously an exact analogy, but reason you can have larger values of back radiation and surface emitted radiation than TSI is somewhat analogous to pumping a swing. Whether this will help people caught up in inventing their own versions of the 2nd law I dont know. -
Albatross at 11:23 AM on 1 July 20112010 - 2011: Earth's most extreme weather since 1816?
Rob @179, "Your comment here contains a common theme that I see in those who wish to dismiss climate change as man made and a serious issue." It is interesting that you should post that. Earlier today I drafted a post but it was lost b/c SAFARI crashed on me. Anyhow, as you probably know Tamino has just posted a devastating refutation on one section of the NIPCC report. And that got me thinking about the fairly steady stream of papers being posted by "skeptics" (e.g., Norman)on this thread trying to convince people that there is nothing un-towards or unusual going on with the climate system. Let me just say that the framing and language has a certain tone to it that raised flags for me. So I went and cross-referenced some of the sources being referenced here by "skeptics" (see here, for example)and those that appear in the NIPCC report. Even just the most cursory of checks found that two of the papers being cited here (Herweijer et al. (2006), Hallett et al. (2003) to try and convince people that all is well are referenced in the NIPCC report and one of those (Herweijer et al. (2006)),appears in the section on extreme weather. A curious coincidence? Unlikely. And I for one am incredibly tired of people alleging to post here in "good faith" when all they appear to be doing is regurgitating stuff from a highly questionable political document prepared in the guise of science. And that said regurgitations do not even accurately represent the findings of the original paper or are not applied in context. I will also note that one of the papers that they (NIPCC; Idso and Singer) cite in reference to drought in N. America is being used for purposes not intended by the authors. I happen to know the authors of the paper in question and I know for a fact that they are not "skeptics" or in denial about AGW. So these it is worrisome to see Idso and Singer to misrepresent the science in papers that actually do not go against the theory of AGW. And worse yet, to see uncritical "skeptics" perpetuate the misinformation and distortion. If some people wish to deny the reality, the science, then they are welcome to do so, but please do not tie the rest of us to the train tracks. -
Camburn at 11:19 AM on 1 July 2011Websites for Watching the Arctic Sea Ice Melt
thanks for your patience db.Response:[DB] As long as discussions are productive, tangential to the thread post and comply with the Comments Policy, the moderators prefer to "let it ride".
-
Camburn at 11:19 AM on 1 July 2011Websites for Watching the Arctic Sea Ice Melt
Correction: Not Cryostat.......but Cryosphere today as to validity. -
Camburn at 11:12 AM on 1 July 2011Websites for Watching the Arctic Sea Ice Melt
scaddenp: I agree with you that ARGO is an extremely important development. The step jump in OHC is now well known and accepted as a splice problem. The data from ARGO should be much more robust than the XBT etc sets from the past.Response:[DB] Time to reel this thread in. As a reminder, this thread is about Websites for Watching the Arctic Sea Ice Melt. Other threads exist for the other topics. Thanks to all for your understanding.
-
Camburn at 11:10 AM on 1 July 2011Websites for Watching the Arctic Sea Ice Melt
Michael: You don't seem to understand what I post, but that is ok. In the eye of the beholder. Scaddenp does, as no where have I asserted that the current ice is more than past ice. However, you might want to check what route the thin skinned vessels used. I believe you will find it is the southern NW passage, which has been low ice for decades. The Canadian Coast Guard makes an annual run in Sept to restock the northern settlements. Has been doing this for decades and decades. With that said, the conditions in the southern passage have become virtually ice free, which in the past was not a normal occurance. The voyage of Capt Larson was extremely remarkable when done, it would still be remarkable today on the path that he took. To give Cryostat full validty I would want to examine it's proxy material for conditions prior to 1979. Just because it is at that site does not give its proxy data credibility. -
scaddenp at 11:06 AM on 1 July 2011Websites for Watching the Arctic Sea Ice Melt
Eric, it also looks like the Argo network may be the most sensitive instrument for climate measure that we have around. Should its measurements fail to show a signal consistent with climate theory in even 5 years would give me serious pause. Would you wait 26 years of warming on that too? -
scaddenp at 11:00 AM on 1 July 2011Websites for Watching the Arctic Sea Ice Melt
Michael, I dont think there is any issue with fact the Larson was able to do an 86 day crossing of NW passage in 1944, in remarkably ice free conditions (especially compared to his 1940 crossing). What is of issue is that somehow this is evidence that arctic then had less ice than now. -
Tom Curtis at 10:54 AM on 1 July 20112010 - 2011: Earth's most extreme weather since 1816?
Norman @178:"If one is looking for a small signal in noise your point would be most valid. But in this case I do believe the Eyecrometer and common sense are all that are needed to determine if climate (rainfall, drought, temperature extremes) is drastically changing for the worse."
(my emphasis) "Drastically"? Who said anything about "drastically". My understanding of the science is that we expect climate change to drastically alter the frequency of extreme events when the Earth has warmed by 3 plus degrees by the end of this century, but that we are starting to see an increase already because the effect of global warming. Nobody claims that the effect is drastic as yet. Especially not Jeff Masters, whose question you quote, but whose answer you ignore:" However, I don't believe that years like 2010 and 2011 will become the "new normal" in the coming decade. Many of the flood disasters in 2010 - 2011 were undoubtedly heavily influenced by the strong El Niño and La Niña events that occurred, and we're due for a few quiet years without a strong El Niño or La Niña. There's also the possibility that a major volcanic eruption in the tropics or a significant quiet period on the sun could help cool the climate for a few years, cutting down on heat and flooding extremes (though major eruptions tend to increase drought.) But the ever-increasing amounts of heat-trapping gases humans are emitting into the air puts tremendous pressure on the climate system to shift to a new, radically different, warmer state, and the extreme weather of 2010 - 2011 suggests that the transition is already well underway. A warmer planet has more energy to power stronger storms, hotter heat waves, more intense droughts, heavier flooding rains, and record glacier melt that will drive accelerating sea level rise. I expect that by 20 - 30 years from now, extreme weather years like we witnessed in 2010 will become the new normal."
(my emphasis) What is more, given that the rise in temperature that has driven the increase of extreme events has been small, and only occurred over the last thirty years, I do not expect an examination of individual phenomena to show a statistically significant trend. Some may, but many may not. But the conjunction of many slight statistically insignificant trends may well result in a statistically significant trend in the total number of extreme weather events. You keep on setting up this strawman of trends you can detect with an eyecrometre and of events completely outside the range of normal experience because on the real issue, the overall statistics of extreme events, you are taking a hiding. -
Chemware at 10:54 AM on 1 July 2011OA not OK part 1
Weird - it displays correctly in the preview, but then dies when posted :-/ pps: try yet again: superscript subscriptResponse:[DB] You were doing it right, but the WYSIWYG editor conjugates it.
<sup> superscript </sup>
<sub> subscript </sub> -
Chemware at 10:54 AM on 1 July 2011OA not OK part 1
ps: try again: superscript subscript -
Chemware at 10:52 AM on 1 July 2011OA not OK part 1
Actually, your equation (1) is most likely wrong: carbonic acid is the likely product, and then you are into the full set of carbonate equilibria: Ca2+ + 2 HCO3- CaCO3 + H2CO3 (1)
CO2 + H2O H2CO3 (2)
H2CO3 H+ + HCO3- (3)
HCO3- H+ + CO3 (4)
Adding CO2 in eq (2) makes more H2CO3, which produces more H+ in (3) and (4), and drives the equilibrium in (1) to the left, thereby dissolving CaCO3.
ps: mb et al, the markups for superscript and subscript (which makes equations much easier to read) are:
superscript
subscript
CaCO3 + H2CO3 (1)
CO2 + H2O H2CO3 (2)
H2CO3 H+ + HCO3- (3)
HCO3- H+ + CO3 (4)
Adding CO2 in eq (2) makes more H2CO3, which produces more H+ in (3) and (4), and drives the equilibrium in (1) to the left, thereby dissolving CaCO3.
ps: mb et al, the markups for superscript and subscript (which makes equations much easier to read) are:
superscript
subscript
-
scaddenp at 10:49 AM on 1 July 2011Websites for Watching the Arctic Sea Ice Melt
Eric, well its good to see you do have some guidelines even if you would wait 26 years for the result. Wouldn't that be rather embarassing because if the theory is right, and we wait 26 years before doing something about it, then we would be rather up the creek by then and leaving a terrible legacy behind. As to what would convince me that something was seriously wrong (or more to the point,missing) in climate theory, well that is straight forward. Climate theory makes a large no. of predictions with varying degrees of robustness concerning a large no. of variables. A breech of any robust prediction means model fixing at very least. I would want to discover an unknown natural forcing before I started betting on it. The truly convincing step would be an alternative theory for climate, consistent with all known physics, that makes a better job of accounting for observations that our present one. -
michael sweet at 10:46 AM on 1 July 2011Websites for Watching the Arctic Sea Ice Melt
Camden, the University of Calgary here summarizes Larsons expedition. It took him 86 days to make the passage in an icebreaker that had been equipped with a larger engine that year. At the end of July ice forced him to run up the coast of Greenland and not Baffin Island. He could run up Baffin Island today, a full month earlier. Last summer a fiberglass daysailer that was incapable of breaking 1 cm of ice made the passage in only about 21 days, after making the North east passage the same summer. The St Roch (Larson's vessel) was reported almost crushed by ice at Tuktoyaktuk and in the Bearing Sea in September. The Corsair 31 would have been destroyed by any ice at all. Find a reference that supports your posititon. The reference you have provided shows that there was much, much, much more ice in 1944 than there is today. If you cannot support your position with data stop posting gibberish. -
Tom Curtis at 10:37 AM on 1 July 20112010 - 2011: Earth's most extreme weather since 1816?
Norman @177, your really do take the cake. You take a single example of a magnitude 5.4 earthquake, that located 15 kilometres from the nearest human inhabitation, which human habitation was a small village with a population of only 3,500; and because it didn't cause any deaths conclude that magnitude 5 earthquakes cannot cause natural disasters. Tell that to Newcastle. I'm sure the thirteen dead in "one of Australia's most serious natural disasters" will be consoled to no that only magnitude 6 plus earthquakes can cause natural disasters. Or tell that in Lorca, where the ten dead will no doubt be very consoled that the earthquake that killed them was 0.9 magnitudes to small to cause a natural disaster. Or perhaps you want to restrict the comparison to California, in which case you should reassure the people of Kern Valley, of http://earthquake.usgs.gov/earthquakes/states/events/1955_10_24.php">Concord, of Daly City, and of Santa Rosa that their fatalities where illusory because their earthquakes weren't big enough to cause natural disasters. Or are they to early, before architecture caught up with life an an earthquake zone? Tell that to Whittier Narrows, Santa Cruz County, and Sierra Madre. As recently as 2005 people were injured by an earthquake below magnitude 5 in Los Angeles. Where somebody is injured, with a little bad luck somebody could have died. Your problem is that you keep on trying to load the dice for your argument. The vast majority of tornadoes (74%) are relatively undamaging EF0 and EF1. They cause just 4% of tornado related deaths, but if you are unlucky they can still cause fatalities. Even EF2 and EF3 tornadoes are unlikely to cause natural disasters. They constitute 25% of tornadoes, and cause 29% of tornado deaths between them. But EF4 and EF 5 tornadoes, just 1% of all tornadoes, are devastating, causing 67% of deaths from just one percent of tornadoes. If I where to apply your reasoning, I would exclude all but EF3 plus tornadoes from the comparison. Or I would exclude all supercells that do not spawn at least five tornadoes. If you have any intellectual integrity, that fact that you are resorting to such egregious cherry picking should be a warning to you that your approach to the subject is biased and that (consciously or subconsciously) you are trying to reach a pre-determined conclusion regardless of the data. -
Fred M at 10:35 AM on 1 July 2011Ocean acidification: Coming soon
DB - Thanks. I tried that and it didn't work, but I'll try again. In case no-one is interested in my comments on ocean alkalinity, they can at least Google alkalinity to understand the main points.Response:[DB] Fred, I reset that account, so hopefully it will work for you.
As to the alkalinity/acidity/basic/ph issue, that has been so rehashed here over and over again as to become an Internet law of it's own, like Poe's Law or Godwin's Law. In this case we invoked the "Look! A Squirrel!" Law, as the only point in raising it was to derail the discussion of the OP.
-
Camburn at 10:28 AM on 1 July 2011Websites for Watching the Arctic Sea Ice Melt
Michael: One thing I have learned in all my years is to present evidence, and not inflict my interpretation of the evidence until the other person has read the paper. I do not want to taint your understanding. Once it has been read and digested by someone else, then we can have a good gentleman's discussion about what each understands. You are a smart feller, you don't need me to tell you what you should think of a link that I post for your knowledge. -
Camburn at 10:25 AM on 1 July 2011Websites for Watching the Arctic Sea Ice Melt
Michael: I called the librarian at the museum to get permission to do what you asked. That permission was denied. Part of their revenue is sales of the logs. They want people to buy the book. I will not go against their wishes as I respect law. The book is worth the money and a very nice addition to any library. I gave you my reasons for my prediction, as crazy as you must think it is, of approx 3.5 for the low this year. We will see how close I come. I provided you links to published literature showing the varation in the Arctic Ice on a historical scale. We know it was not variation in TSI that caused the variation in the ice. -
GrahamC at 10:23 AM on 1 July 2011OA not OK part 1
I agree, mb The whole bicarbonate equilibrium needs to be considered. Apply Le Chatelier and it's obvious that removal of bicarbonate will shift the equilibrium you've illustrated to the right, resulting in absorption of gaseous carbon dioxide from the atmosphere. -
Chemware at 10:22 AM on 1 July 2011OA not OK part 1
This is a bit simplistic. You really need to introduce the concept of chemical equilibrium: Ca2+ + 2 HCO3- CaCO3 + CO2 + H2O
followed by Le Chateliers principle:
If a chemical system at equilibrium experiences a change in concentration, temperature, volume, or partial pressure, then the equilibrium shifts to counteract the imposed change and a new equilibrium is established.
So that adding more CO2 pushes the reaction to the left - thereby dissolving CaCO3, ie: shells.
-
michael sweet at 10:17 AM on 1 July 2011Websites for Watching the Arctic Sea Ice Melt
Camburn, You have not even produced a single line from your book as evidence to support your wild claims. You tell me to buy and read an entire book without even citing a page that supports your position??? If you have no data to support your position you should admit it and stop wasting everyones time.
Prev 1604 1605 1606 1607 1608 1609 1610 1611 1612 1613 1614 1615 1616 1617 1618 1619 Next


