


 Arguments


Recent Comments
Prev 1606 1607 1608 1609 1610 1611 1612 1613 1614 1615 1616 1617 1618 1619 1620 1621 Next
Comments 80651 to 80700:
-
KR at 04:05 AM on 1 July 2011Uncertainty in Global Warming Science
Dikran - That's alright, I've had my posts deleted before. Although I hope it's the first time it's happened by accident! As to Pierrehumbert being hard going, that's OK. I read his recent Physics Today article, and don't have any illusions about him oversimplifying things. Time to take my neurons out for a few push-ups, anyway. -
dana1981 at 03:55 AM on 1 July 2011Lessons from Past Climate Predictions: Don Easterbrook
Yes, any projection which completely neglects physics the way Easterbrook has done can accurately be described as 'junk science'. -
les at 02:56 AM on 1 July 2011Lindzen Illusion #7: The Anti-Galileo
To coin the old phrse Eppur si calefacit -
Albatross at 02:52 AM on 1 July 2011Lessons from Past Climate Predictions: Don Easterbrook
Thanks Dana. I suspected as much, but 0.3 C?! Good grief. Now figure this. He claims climate sensitivity is low, well practically non-existent in fact. But then look at the huge decadal-scale perturbations in global temperatures in his graphs that he attributes to solar and, worse yet, internal climate modes. Said perturbations are greater in amplitude (> ~0.5 C) than anything observed in the global SAT record since 1850. Yet at the same time he would have us believe that the climate system is insensitive to selected external forcings such as CO2. This is junk science (by deniers of AGW) at its best. -
Tom Curtis at 02:47 AM on 1 July 20112010 - 2011: Earth's most extreme weather since 1816?
Eric the Red, if you want to actually run a correlation between the precipitation data and the PDO index, and also with Crutem, or hadCRUT3v by all means. As it stands, I do not think the correlation will be significantly better, if at all. Given that, there is a clear causal connection between high temperatures and high precipitation. In contrast, it is not even clear that the PDO is a genuine oscilation distinct from ENSO effects, and you have no explanatory path from PDO to higher precipitation. More importantly, the correlations you are trying to find certainly do not apply in the SH, so you are then left trying to find to distinct and non-compatible explanations, one for the NH and one for the SH. If you think there is something in it, do the leg work. If not, then there is nothing to discuss. -
Bob Lacatena at 02:45 AM on 1 July 2011Ocean acidification: Coming soon
I can't tell from the list of post titles, but I'd love to see an "Ocean Carbon Cycle" diagram, similar to the carbon cycle diagrams we've all seen, but focused on the forms (molecules) and mechanisms (weathering, atmospheric absorption, dissolution or recombination, etc.) that occur within the system. Obviously, the numbers may not exist to show how much each component contributes, but just a designation of what is there, if not how much, would be useful. -
Patrick 027 at 02:43 AM on 1 July 2011The Planetary Greenhouse Engine Revisited
It is still incorrect to refere to the top of the troposphere and mesosphere as radiating layers; aside from net radiant heating or cooling or gross emission and absorption or net fluxes among layers, for Earth, much radiation escaping to space is emitted from within the troposphere, some comes from the stratosphere, very very little comes from above that; more comes from the warmer layer around the stratopause than from the mesopause region, and more would come from a warmer layer than a cooler layer of the same thickness except for variations in height, line broadenning and line strength (actually I think line strength may tend to increase with temperature but I'm not sure), and composition (ozone in particular in the upper atmosphere). -
Dikran Marsupial at 02:37 AM on 1 July 2011Uncertainty in Global Warming Science
KR wrote: "Dikran - Well said, and thanks for the Pierrehumbert book reference; I've just ordered it." Sorry KR, hit the wrong button, mea maxima culpa! It is indeed an excellent book, but rather hard going. I'd recommend it to anyone wanting to look a bit more deeply into the physics, although a recommendation from one of the physicists here would carry more weight! -
Eric the Red at 02:16 AM on 1 July 20112010 - 2011: Earth's most extreme weather since 1816?
Tom, I think you are looking too much at each individual value. If you smooth the values over 5 years, then the scatter dissipates, and a good correlation is evident. I did not say it was perfect, but it does show possibilities. I agree that the period from 1960-1970 does not correlate as well. The PDO was negative for most of the decade, while the rainfall fluctuation, but was only low for three years; 1963,5, & 8. For most of the 80s, the PDO index was possitive, and the rainfall was low. Rainfall was only high for two years, which corresponded to a negative PDO around 1990. This was one of the better periods of agreement. Since 2000, the PDO has bounced from negative to positive, and back to negative. Rainfall started high, fell, and rose again, but you could argue that timing was not the best. Also, look at the periods of highest rainfall; mid 50s, mid 70s and ~2000. During these periods, the PDO was the most negative. During the periods of lowest rainfall; early 1930s, early 40s, mid 80s, and early 90s, the PDO was most positive. -
dana1981 at 02:01 AM on 1 July 2011Lessons from Past Climate Predictions: Don Easterbrook
Albatross - from these projections it's unclear what Easterbrook thinks about climate sensitivity, since he completely neglects CO2. Of course, the fact that he neglects CO2 does suggest that he thinks climate sensitivity to it must be near zero. From dhogaza's link, if Easterbrook thinks an increase from 300 to 380 ppm should have caused 0.1°C warming, he thinks sensitivity to doubled CO2 is 0.3°C. This is indeed ludicrously low, even more extreme than Lindzen, Spencer, and Christy. -
Nicholas Berini at 01:51 AM on 1 July 2011Throwing Down The Gauntlet
Another element to taking personal action is that when society finally does catch up to the true costs of carbon you will be more prepared emotionally and economically - ie your life will not have to change drastically to move away from carbon-intensive activities/habits. -
Albatross at 01:34 AM on 1 July 2011Lessons from Past Climate Predictions: Don Easterbrook
Dhogaza @45, Thanks for that link. Oh dear, that document does not do Easterbrook any credit at all. He even invokes the "in the past temperature lead CO2 so there is nothing to worry about" myth, the "it has cooled since 1998" myth, the "CO2 comprises a tiny fraction of the atmosphere so is not a big player" myth. Easterbrook also makes this claim: "The greenhouse effect of CO2 decreases exponentially, so the rise in atmospheric CO2 from about 0.030% in 1950 to .038% in 2008 could have caused warming of only about 0.1° C." Maybe Dana will chime in at this point. Dana? -
Dikran Marsupial at 01:30 AM on 1 July 2011Uncertainty in Global Warming Science
Ken, the IPCC discuss the "instantaneous" forcings as that is the presentation that is most easily understood. Now if you want to see what happens when they are integrated, look at the output of a GCM, that is exactly what they are designed to do. I have pointed out that S-B outbound IR increases, and yes you have mentioned them, however what you have not done is demonstrate that the increase in outbound IR does not equilibriate fast enough that any uncertainty in absolute TSI from pre-industrial equilibrium would not by now be of negligible significance. Now if you don't like GCMs, then your remaining option would be to contruct a simple idealised model of the climate (such as those described in the first few chapters of Ray Pierrehumbert's book). If you could construct such a model, where the parameters were physically plausible and broadly consistent with observations, then we would have something we could work on. Until then, you are essentially just arm waving, you may have a point, but you need to do some science to back it up. Note the IPCC reports were written by leading experts on this stuff; I hope it has ocurred to you that there may be some physics that they understand rather better than you do, and that you might be very wrong. -
GreenCooling at 01:15 AM on 1 July 2011Ocean acidification: Coming soon
Fantastic to hear you are looking at the OA issue, very keen to gain a greater understanding of this truly alarming evidence of AGW. I work on reducing the contribution of refrigerant gases to climate change, and am extremely concerned about the new generation of low GWP "HFO's" such as R1234yf, that are being heavily promoted by fluorochemical companies to maintain their market share in the face of impending regulatory and market mechanisms to phase out high GWP HFC's and competition from genuinely climate friendly natural refrigerants (Hydrocarbons, CO2, NH3). The HFO's only have low GWP due to their extremely short atmospheric lifetimes, and degrade into TFA, trifluoroacetic acid, which has raised some concerns in the literature about acute ecotoxicity developing in inland waterways. My query is whether, if the fluorolobby get their way and succeed in achieving the massive sales volumes of these new gases they are planning, there is a risk that this new global experiment with putting fluorinated gases into the atmosphere may contribute significantly to ocean acidification from another source, at a time when introducing more acids into the water cycle might not be a very clever idea? I think there is a need for more research on this issue, and if it is to come in time to influence policymakers who currently believe HFO's are a solution to the HFC problem, the need is rather urgent, but any insights from experts in OA would be of great interest at this year's Montreal Protocol discussions. -
Tom Curtis at 00:52 AM on 1 July 20112010 - 2011: Earth's most extreme weather since 1816?
Eric the Red @170, you also ignore the negative PDO index from 1960 to 1970 but low rainfall, and the period from 1980 to 1990 with positive PDO index and high rainfall. Adding those two periods to the early twentieth century you have around 50 years in which there is no correlation, or the opposite correlation to that predicted. It doesn't correlate well in the 2000's either. Establishing a correlation over fifty years and then asking me to ignore the other sixty because it does not suite the hypothesis does not impress. -
Tom Curtis at 00:44 AM on 1 July 20112010 - 2011: Earth's most extreme weather since 1816?
Norman @165, there where about 326 in North America including the Caribbean in 2010. Of those, about 60 occurred outside the US, and 4 where geophysical, leaving approximately 260 weather related disasters in the continental United States. But for the sake of argument, let's pin that as the US figure. According to your source, there are an estimated 2,000 to 3,000 supercells in the US annually. Taking the higher figure, that means that supercells have around an 8% chance of causing a disaster. From your source, there where around 2,100 category 5 plus Earthquakes would wide in 2010. Of the 960 natural disasters in 2010, 9% or 86 where geophysical. Assuming them all to be earthquakes, that means about 4% where damaging. The US figures are 80 5 plus earthquakes, and 2, possibly 3 reported as disasters; and hence a 2.5 to 3.75% chance of being reported. Therefore on these rough figures, a magnitude five plus quake is less likely to be identified as a natural disaster than is a supercell. Your logic was:"The logic (not sure it will satisfy you). Most large earthquakes are already counted as disasters (percentage wise) whereas the vast majority of supercell storms do not become disasters but each one has the potential to. So an increase in population and property value could still explain this situation. Munich Re also points this out in there report."
But as we have just seen, the probability of reporting as a natural disaster are the reverse of what you claim. So if we accept your logic, which I do not, we would expect an increase in population to result in more reports of geophysical disasters relative to weather related disasters, rather than the reverse. With regard to your initial comment, geophysical disasters are almost flat (no increase) over the period that weather related disasters increase threefold. Major geophysical disasters increase by about 50%, but major weather related disasters increase by about 100%, leaving a 33% increase unexplained by reporting issues. -
Eric the Red at 00:32 AM on 1 July 20112010 - 2011: Earth's most extreme weather since 1816?
Tom, With the exception of the early 20th century, I think the precipitation does correlate rather well with PDO. The more negative the PDO, the higher the rainfall. http://i44.tinypic.com/2eyb1xs.png -
Pete Dunkelberg at 00:27 AM on 1 July 2011Ocean acidification: Coming soon
I'm sure the home team cam fix the links in the top post. Even nicer, they can add links to the titles as posts are added. Of course "decreasing pH = becoming more acidic = acidification." New people may bring up the question as time goes on. Instead of deleting, how about adding "Moderator Response: decreasing pH = becoming more acidic = acidification" when needed, and deleting or editing any excessive replies? -
KR at 00:04 AM on 1 July 2011Uncertainty in Global Warming Science
Ken Lambert - "Because TSI has no equilibrium baseline - the area under its forcing curve is uncertain so its contribution to the energy sum is unknown." You are correct in that no matter when we start considering forcing anomalies, it's going to be difficult to find a point where the climate was at equilibrium. However, we have the track record of global temperatures, and a decent record of forcing changes both natural and human. We can see when the climate is gaining or losing energy over the last few hundred years. Global temperatures have gone both down and up over that period, which immediately tells us that we've seen forcings both above and below equilibrium - that the area under the forcing curve has gone both positive and negative. Given that simple piece of information, and looking at changes in forcings, we actually have a pretty good idea of the relative magnitude of the various forcing changes that are currently affecting climate. They are currently positive, we know when they were negative, and we've measured the changes. The big uncertainties at this point are indirect aerosol effects and cloud feedback - certainly not solar input. You seem to repeatedly call for 'more information', to state 'we cannot know' - this all sounds like a call for inaction in the face of what is actually pretty solid evidence. -
KR at 23:43 PM on 30 June 2011It's the sun
JoeRG I don't know if you are aware of this, but there are several issues with your comment. First is that natural variability means that on a short time scale (5-10 years) 'climate' models can only give an approximation of the 'weather', where on 20-30 years they do an excellent job of looking at trends. It's not a miss unless the observations go outside the envelope of model predictions, the orange and blue bands representing the multiple-run envelope.. Therefore the fit with anthropogenic forcings is quite good. Second, given recent higher grade measurements of forcings, the post 1950's fit is accordingly better in the models. Third, 'global dimming' shows up in both model and measurement data as change to a downward trend around 1940. I think your statement regarding that is unfounded. Finally, as to models - they are an important tool for teasing out the contributions and effects of different forcings, as well as a good check on our understanding of the physics involved. Based on our understanding of the physics of forcings, the measured changes in solar activity, volcanic activity, etc., natural forcings should have cooled the climate considerably since mid-century. That did not happen - anthropogenic forcings made the difference, hence current warming. So again, the statistically significant (obvious to the point of a boot to the head) break between natural forcings and climate response became visible mid-20th century. I suggest you read the Models are unreliable thread if you have such concerns about the use of models as tools. -
Ken Lambert at 23:33 PM on 30 June 2011Uncertainty in Global Warming Science
KR #79 "That said, your repeated claim that 'integral of TSI explains all' (paraphrasing) is indeed a PRATT" I have not claimed that 'integral of TSI explains all'. What I have said is that integral of ALL the AR4 forcings over time (they all should have a time history and a projection forward) added to the same integral of the climate responses over time will give the total energy added to the earth system. Volcanic negative forcing also adds to this sum (the area under the spikes). In other words we are summing the net forcing imbalance over time to get the total energy added to the system. Because TSI has no equilibrium baseline - the area under its forcing curve is uncertain so its contribution to the energy sum is unknown. Temperature and phase change of the masses engaged will respond to this energy total somewhere in the system. -
Tom Curtis at 23:11 PM on 30 June 20112010 - 2011: Earth's most extreme weather since 1816?
Norman @167, the SH data does not have the same dry period wet period pattern you are commenting on, but it has an even stronger trend (3.31 mm/decade) than does the NH (1.53 mm/decade). Interestingly, the SH lacks both the mid century temperature peak and the (slightly out of phase) mid century precipitation peak which are both so prominent features of the NH and global data. Further, you are inventing an unexplained cycle from the whole cloth as the pattern does not correlate well with any of the great oceanic oscillators (including such dubious ones as the AMO, which I just checked. Further, even if it was a cycle, you would not be able to check phase only trends without at least two positive and two full negative phases to check. Finally, as noted above, the SH trend is much stronger than the NH trend. The NH trend dominates the global trend, never-the-less because this is a land only index, and there is so much more land in the NH. This suggests that if it was a land/ocean index (unfortunately not possible due to lack of data) it would show a much stronger trend dominated by the SH, and hence lacking the features you are trying to build a case on. -
Tom Curtis at 22:54 PM on 30 June 20112010 - 2011: Earth's most extreme weather since 1816?
Eric the Red @164, I had noticed that, and even checked out a number of possible causes including: Insolation (which peaked in 1950) ENSO PDO NAO Sulfates (global dimming) Correlation between SST and Land Temp In each case there was either no obvious connection, or in some such as insolation there was good reasons to rule it out as a cause. The most important feature to note is that the NH and SH peaks do not correlate. In particular, there are many high precipitation years around 1920 in the SH as in the NH, but they are not the same years, and there is no equivalent to the 1950's peak in the NH in the SH (which rules out insolation as a cause). The best correlation with an oceanic oscillator is with the PDO (1950's peak), but the rise in precipitation in the 1980s starts far to early and far to strong for the PDO to be the cause. Consequently I would say the precipitation is tracking temperature, but imperfectly because of the noisy nature of the data. -
Eric (skeptic) at 22:28 PM on 30 June 2011Throwing Down The Gauntlet
When my old electric water heater blew, I replaced it with another because it was my most energy efficient option. After I installed it I turned it down to the lowest possible setting (meaning the shower is just hot enough in winter when turned all the way to hot). But I also added 100 feet of PEX on the cold input so I can add some sort of preheater. Right now my preheating comes from a south facing outside wall painted black, but I can do better (for one thing PEX doesn't transfer heat well). I have more black-painted wall for passive solar heating (covered in plastic with a PV-powered fan to draw warm air in). I have enough PV electric and batteries for 100% solar computing and some emergency refrigeration. Bottom line is my electric bill is $30/month but up to $50 last summer when it was so blazing hot (60 days at 90F or above). In winter about $35 since I use a bit more hot water. My propane use for heating and cooking is minimal since I used wood for most heat and winter cooking. The electric bill includes all water (lots of new trees to water) and pumped septic. What's next? I would love to experiment with hydro electric, but 30 foot floods make that challenging (no trend since 1930 http://waterdata.usgs.gov/nwis/monthly?referred_module=sw&site_no=01631000&por_01631000_2=188914,00060,2,1930-09,2010-11&format=html_table&date_format=YYYY-MM-DD). I would gladly give up land to dammed waters (I would get better kayaking and fishing) and a right-of-way. Other ideas: passive solar greenhouse, more passive solar heating and cooling. -
Norman at 22:22 PM on 30 June 20112010 - 2011: Earth's most extreme weather since 1816?
Tom Curtis @ 160 My post at 158 was a poor one and I should not have made it. I just want to comment on the trend line in your second graph. I might have a different view here. I see a dry period followed by a wet period which may be linked to global warming or it could be some longer term cycle that produces dryer and wetter periods. A trend line from the dry cycle to the wet cycle indeed shows an increase. What if the trend line is drawn just in the wet cycle and just for the dry cycle considering the possibility that these are some cycles of unknown mechanism but cycles never-the-less. I would doubt you could show an upward trend of the wet cycle in graph two of your post. That was my observation. -
Eric the Red at 22:22 PM on 30 June 2011Websites for Watching the Arctic Sea Ice Melt
Sphaerica, I said give me time, that is not a cop out by any stretch of the imagination. Here is my response: Using CRU data, the 10-yr centered moving average increased 0.59C from a low in 1967 to a high in 2002. Therefore, if temperatures decreased by a similar magnitude over a similar time period, then I would say it was all natural, -0.6C by 2037. Using the same data, the calculated climate sensitivity over the 35 years is 2.8. Therefore, based on an expected CO2 increase of 17.5% by 2037, the temperature should rise another 0.65C. Then I would say it is all CO2. Obviously any changes of similar magnitude in shorter timeframes would yield a similar result. The other number to watch is a temperature decrease of 0.2C by 2028. That is the average of the last two cooling periods, and would indicate that both natural and CO2 forces are impacting temperatures. The resulting climate sensitivity would be ~1. I think that I have set some fairly solid bounds for you. Your middle analogy is woefully inaccurate, as you imply it results from indecision and apathy, rather than scientific inquiry. In reality, there is only one answer, and it lies somewhere between the left and right shoulder of the road. -
Norman at 22:13 PM on 30 June 20112010 - 2011: Earth's most extreme weather since 1816?
DB @ 163 The writers of the article do believe it is a valid proxy for determining wet and dry cycles for the larger region of the Northern Great Plains. "Devils Lake is of glacial origins, and the fact that it is a closed lake has allowed meaningful paleoclimatological studies using proxy information to estimate elevation changes several thousand years before the present time. These reconstructions (Bluemle, 1991; Murphy et al., 1997).reveal numerous cycles between high and low water levels that have been interpreted to indicate wet and dry cycles over the northern Great Plains (Fig. 1)" There is no global climate there are regional climates. To determine if these regions are changing you can only examine one region at a time to look for a signal of increasing extremes. I did post a local point on snowfall for Omaha Nebraska earlier and was rebuked for this. After this I am trying to find historical information on various regions and it seems Devil's lake is considered a regional proxy.Response:[DB] The author's of that study use statistical analysis tools to arrive at their conclusions (which apply to the Devil's Lake area only). In your prosecution of your narrative you do not use any statistical analysis of your own, relying instead on the sturdy Eyecrometer and "common sense". On a science-based forum such as this, you are not living up to the standards of believability.
-
Norman at 22:02 PM on 30 June 20112010 - 2011: Earth's most extreme weather since 1816?
Tom Curtis @ 154 If you go back to your post on 55 with the two types of disaster graphs (disasters and major disasters). If you look at the number difference between geophysical and weather related at the start of each graph. The number of weather related disasters is so many times higher. I have not worked it out yet but I am wondering if the starting higher number would increase the probability of a disaster from weather over geophysical when the population rate goes up at about the same rate as the disaster chart. Wheras the increasing population is not changing the lower number as much, the geophysical disaster frequency is going up on both graphs, just more slowly. Also with large geophysical disasters, being a much smaller yearly number have less probablility of disaster. But with severe storms just in the US there are about 2000 to 3000 supercell thunderstorms a year. Link to number of annual supercell stroms in US. Of those 2000 storms, anyone which could become a disaster, only a few of these become listed as disasters. With Earthquakes you have a much smaller number that cause disasters (need to be close to the 6 magnitude to cause one in areas with better construction). Your short list does show this. You can also see by matching the numbers on your post at 55 with the earthquake numbers that most large earthquakes do cause a disaster somewhere. Earthquake number and magnitude. The logic (not sure it will satisfy you). Most large earthquakes are already counted as disasters (percentage wise) whereas the vast majority of supercell storms do not become disasters but each one has the potential to. So an increase in population and property value could still explain this situation. Munich Re also points this out in there report. -
Bern at 21:41 PM on 30 June 2011Climate half-truths turn out to be whole lies
Kevin C, that's a fantastic piece of information. It will make it much easier to rebut assertions of global temp records being wrong due to incomplete global coverage. -
Eric the Red at 21:18 PM on 30 June 20112010 - 2011: Earth's most extreme weather since 1816?
Tom, Have you compared your rainfall anomaly graph with the GISS temperature anomaly posted in #158? The rainfall follows temperature, but with an ~15 year lag.Response:[DB] What physics-based explanation do you propose for that? Otherwise it's another case of "I see cycles".
-
Norman at 21:13 PM on 30 June 20112010 - 2011: Earth's most extreme weather since 1816?
Camburn @ 152 I did read through your Devil's lake article. It does show a similar concept of what I have been trying to point out in my numerous posts. Histroically the climate does not appear to be getting worse. There are large variations in rain amounts (drought and flood cycle) going back several centuries. When looking at the long history of any given area I have examined, I cannot conclude from the evidence that climate patterns are becoming more extreme or that flood/drought cycles are more intense, more frequent, or longer in duration.Response:[DB] The inescapable conclusion is that one cannot draw regional or global inferences based on single point references. So the premise of your comment and your concept is based on a fallacious understanding of time series analysis.
-
Norman at 21:09 PM on 30 June 20112010 - 2011: Earth's most extreme weather since 1816?
DB in 158 Thanks for the correction. I did reread Jeff Masters point on that and it is not that warmer air woould cause more overall rainfall (as you pointed out) but more extermes. Heavier rain in some areas and stronger droughts in others. You are completely correct. This is a very intelligent website and the posters expect and demand a higher level of reasoned responses. Too many mistakes and misunderstandings is too sloppy. I am trying to demonstrate points of histrorical weather patterns but a failure to keep it error free will work to make my posts seem sophmoric and not worry of consideration. -
John Cook at 20:48 PM on 30 June 2011The Climate Show 15: Michael Ashley and the ineducable Carter
To be honest, I rarely watch the show - I download the podcast onto my iPod and listen to it while doing chores. My interview is on at the 45 minute mark and hurtles by for only 13 minutes (over that time, my daughter walks past in the background, our dog ambles by and you can see the back of Wendy's head the whole time). -
bill4344 at 20:42 PM on 30 June 2011Ocean acidification: Coming soon
That list of punning headlines would make any sub-editor proud. Does 'always take the weathering' make any sense outside of Oz and NZ? Looking forward to the series. -
OPatrick at 19:53 PM on 30 June 2011Throwing Down The Gauntlet
"Cool", yup, that's definitely what they're thinking Adelady, no doubt about it. Well, actually it might be bemusement, it's difficult to tell sometimes. I'm sticking with 'electric motorbike' though, electric bike means electric bicycle to me. And plenty of bragging rights when it comes to mpg conversations. -
Marcus at 19:50 PM on 30 June 2011Throwing Down The Gauntlet
Oh, & I've also gone with a Green Power scheme recently. I only use around 5-6kw-h of electricity per day, so its only costing me an extra 1c/kw-h for 100% Green Energy. That's a *bargain* in my opinion-especially once the carbon tax kicks in ;-)!!! -
Marcus at 19:48 PM on 30 June 2011Throwing Down The Gauntlet
I went with a Continuous Flow Gas Hot Water system myself. Cost a few hundred dollars more than an electric hot water storage system but, in the 5 years since I installed it, its paid for itself several times over. Plus its generating a fraction of the CO2 emissions that my old water heater used to generate, because its much, much more efficient! -
adelady at 19:41 PM on 30 June 2011Throwing Down The Gauntlet
David, I think the personal/ domestic action is worthwhile. Mainly because of the general perception that running the government is much the same as running a household or a business. (I think this is a bit misguided, but nevertheless it's there.) If people see that it's 'normal', 'economical' or even 'cool' to take these actions, the stage is set for more general economy wide action. ('Cool' refers to the opinion of school students about a teacher happily coasting straight past school buses held up in traffic - on an electric bike, not a motorbike. It actually looks more like a Vespa scooter.) When lots of people in your street have solar PV, you're not becoming a 'hippie' or a 'greenie' if you instal it too. And it's easy to get bragging rights in your retirement village - my mum always checks the readings on her system before she goes anywhere. -
Michele at 19:23 PM on 30 June 2011The Planetary Greenhouse Engine Revisited
@ Patrick I downloaded the free software FreeFem++ at http://www.freefem.org/ff++/ which solve the PDE systems and I used it. I used a domain 90x120. The abscissas between X15 and X75 represent an entire Earth’s meridian circumference, that’s, X15 is the equator at midday, X30 the North Pole, X45 the equator at midnight, X60 the South Pole, X75 again the equator at midday. The abscissas 0-X15 and X75-X90 have been used only to obtain a perfect symmetry of the range X15-X75 with respect to X45. The ordinates represent the Earth’s atmosphere layer high 120 km above the surface. The assumed surface temperatures change sinusoidally along the meridian being 200K at poles and at equator 290K at midnight, 320K at midday. Using FreeFem++ I have solved the two-dimensional problem in the steady state using the follow system: ∇•u = 0 //continuity u •∇u + gk + Cp∇T – νΔu = 0 // momentum u •∇(CpT + gz) – λΔT = 0 // total energy without KE imposing a) T = 270 K at 120 km (within the thermosphere) and at 50 km (top of the stratosphere) b) T = temperature of equilibrium due to the emission 6e-8*T^4 for the thermal sinks of the tropopause at 10 km and the mesopause one at 90 km and plotting a) the temperatures ”(temperature)” b) the vertical velocities ”(vertical velocities)” c) the vectors velocity ”([u,v])” d) the lapse rates at X15 (equator at midday) ”(X15-equator at midday)” , at X22.5 , mid latitude at midday, ”(X22.5-mid latitude at midday)” , at X30, poles, ”(X30-poles)” , at X37.5, mid latitude at midnight, ”(X37.5-mid latitude at midnight)” , at X45, equator at midnight, ”(X45-equator at midnight)” I have to make amends for my mistake. The mesosphere lapse rate is not able to activate the convection. I have reduced the ordinates to 10 km and plotted also the horizontal and vertical components of the velocities which are quantities with sign so it is possible to understand the sense of the eddies thermally induced. ”(velocities X90)” I have plotted some lapse rates for different latitudes. At the equator the concavity of the lapse rate is positive showing that the energy of the lower atmosphere is increasing both in daytime and nighttime; for the mid latitudes the lapse rates day/night are linear; at the poles the concavity of the lapse rate is negative because the falling air is losing its energy.” (lapse rates of temperatures)” The results of this very simple simulation confirm what was well known: - we need different temperatures on the surface to activate circulation induced by convection - the turbulence is present almost exclusively within the lowest region of the tropopause - if the Earth is not rotating and then without the Coriolis forces, the global circulation occurs according to a simplified one-cell way between the equator and the poles, as we can see, e.g., at http://www.physicalgeography.net/fundamentals/7p.html or at many other sites of physical geography on the web. The most important result is that it is enough to add two radiating layers at the top of both the troposphere and the mesosphere and the behavior of the entire atmosphere seems satisfactorily (even if grossly) explained. May be, the physics is more and more simpler than we tend to depict it. -
OPatrick at 18:42 PM on 30 June 2011Throwing Down The Gauntlet
Given perseus's point above I'll tell you about my new electric motorbike: It costs not significantly more than an equivalent (125cc) petrol driven bike, £3000 new, and has similar performance. Top speed 60mph. Range 40 miles, and possibly up to 70, which is more than adequate for my commute to work and back each day. Cost of charging less than 1p per mile and the batteries should last 2000 charging cycles, or about 4 to 5 years of regular use, before they need replacing (current price about £800). Even with the current energy mix this gives emissions reductions compared to a petrol bike over its lifetime - and if you're replacing a car then the savings, both financial and environmental, are massive. This is a realistic solution that's available now. I enocurage you all to participate in it. -
Bern at 18:40 PM on 30 June 2011The Climate Show 15: Michael Ashley and the ineducable Carter
Hey, that's a good 15 minutes shorter than the previous episode, so the efforts at brevity are having some effect! barry, it's well worth watching the whole lot. I like to have it open on my second screen while doing other more menial tasks on the first [cough World of Warcraft cough]... -
Bern at 18:35 PM on 30 June 2011Throwing Down The Gauntlet
I think the economic argument for some sorts of action is quite strong (thus the comment about the denier with the rooftop PV). A few years back, our (electric resistance) hot water system failed. We paid a premium of ~$1,000 or so to go solar. Since then, our electricity bill has been about $100/quarter less. In another few years, the savings will have completely paid for the hot water system - total cost, not just the 'solar premium'. Given the prospects for ever-rising electricity prices, I think a rooftop PV array may be in our near future as well. I'd love to get one big enough to offset our entire daily use, but not sure the budget will stretch that far. Perseus, I like your analogy - it fits in well with the government motivation. If 50% of people with riverfront properties sandbag, then the government will probably step in and do the rest. You're certainly not going to ever get 100% community buy-in, waiting for that means the whole enterprise is doomed because of the cranky denier on the corner who claims the river has flooded before, it's entirely natural, we shouldn't do anything about it... -
Bern at 18:19 PM on 30 June 2011Ocean acidification: Coming soon
Also looking forward to this series! OA, all by itself, may have devastating impacts on human activity - here's a quote from an FAO briefing paper[pdf] for the COP15 conference: Fish (including shellfish) provides essential nutrition for 3 billion people and at least 50% of animal protein and minerals to 400 million people in the poorest countries. Over 500 millon people in developing countries depend, directly or indirectly, on fisheries and aquaculture for their livelihoods. Not to mention the monetary value - the NOAA indicates that commercial fisheries in the US alone were worth $3.9 billion in 2009. FAO numbers put just the international trade in fishery produce at ~$85 billion per year. -
JoeRG at 18:06 PM on 30 June 2011It's the sun
@KR You cannot deny that a well tuned, means a good model can predict everything wanted. Honestly, this IPCC model linked is a bad one. The only section that has a nearly proper correlation is the time after 1963 in the upper diagram (anthropogenics included). The other part, 1900 until 1963, does not fit at all. This is a mess, because this is the section to which the natural forcings have to be attuned. Neither in the upper nor in the lower diagram there are any signs of fitting the lower peak around 1910 or the higher peak in the 40th. So the predicted temperature curve is much too flat. As well, the effect of global dimming, widely accepted in science, is missing (the natural forces would have caused higher temperatures, countered by this effect). This is a clear sign of underestimated natural forcings in this model (both curves are almost identical in this time, so the anthropogenic forcings are negligible). One that claims to have a sceptic look at science must have recognized this - and, if I am right, most posters here claim it. Regrettably I have to conclude that it is not as you suggest that there would be an excellent correlation. Perhaps some kind of excellence in the part that is claimed to be important, but a mess in the offcut. Generally, models, even those accepted by the IPCC, do not always match the reality. You can of course use the models to get your conclusions, but how reliable can models be if the tuning sections don't fit at all? -
scaddenp at 17:44 PM on 30 June 20112010 - 2011: Earth's most extreme weather since 1816?
Further to Tom's point - a proper evaluation of an hypothesis is compare observation to actual model prediction not just what you think the model predicts. The models for regional effects of weather as the globe warms are not that robust but do clearly delineate areas which will get wetter and which will get dryer. The worrying thing about the Min et al paper was that there was more extreme precipitation events than models than their models predicted. -
barry1487 at 17:37 PM on 30 June 2011The Climate Show 15: Michael Ashley and the ineducable Carter
Yikes - it's an hour+ long. Not all of us have spare bandwidth/time to check it out. Can you do a quick round-up of the segment, or at least give the time code? Cheers, barry. -
Bern at 17:30 PM on 30 June 2011Lessons from Past Climate Predictions: Don Easterbrook
stefaan: Yes, you can add more and more cycles, sub-cycles, and epi-cycles until your simulation provides quite an accurate reproduction of past behaviour. Such models almost invariably fail the prediction test - which I believe was one of the key reasons for the downfall of the geocentric model of the solar system - as time went by, more and more sub-cycles were needed to account for the variance between model and reality, until the whole house of cards collapsed, to be replaced by the heliocentric model which was described by a few (relatively) simple equations, and which allows fairly accurate prediction centuries into the future. I think the term 'house of cards' is accurate in that example, as it was all based on, and completely relied on, one fundamental assumption, that the Earth was the centre of the universe. Observation showed that fundamental assumption was incorrect, and additional complexities were added in to the model (with no basis in physical science whatsoever) in order to account for that error. In the climate science field, however, there are multiple foundations (e.g. CO2 absorption spectra, black body radiation, conservation of energy) which are so thoroughly tested by experiment and observation that it would be very improbable for any of them to be overturned at this point in time. Tamino has a good post covering another 'skeptic' prediction that turned out to be not-so-good - this time from the 2009 NIPCC report regarding arctic sea ice. The last graph is a cracker - especially when you consider most of that data was available at the time the NIPCC report was written! -
Tom Curtis at 16:59 PM on 30 June 20112010 - 2011: Earth's most extreme weather since 1816?
Norman @158, your conclusion that warmer air will hold more water, and hence there will be fewer droughts is to simplistic. As a first order effect, it is in fact true that warm air can hold more water; and all else being equal, this will lead to greater precipitation. Indeed, that is just what we see globally (over land). As can be seen below, the expected daily rainfall over the globe is increasing with increasing temperatures. Based on the GRCM3 model, the expected increase is about 0.06 mm per day over course of the 20th century, and as much as five times that increase over the course of the twenty first: A 0.06 mm/day increase translates to an annual increase of 22 mm over the period 1900 to 2010, or about 2 mm per decade. That does not sound like a lot, but it is an increase in the mean global anomaly, ie, the average of the increase at all recording stations. In other words, your typical city is expected to be receiving 242 mm more rain per annum now than they where in 1900.
 According to Australia's Bureau of Meteorology, the trend over that period has been 2.08 mm/decade, or a mean increase of 243 mm. As a hindcast, that retrodiction was not bad.
But that is just the simple stuff. In fact, the change in precipitation is not expected to be, and has not been evenly distributed in space:
According to Australia's Bureau of Meteorology, the trend over that period has been 2.08 mm/decade, or a mean increase of 243 mm. As a hindcast, that retrodiction was not bad.
But that is just the simple stuff. In fact, the change in precipitation is not expected to be, and has not been evenly distributed in space:
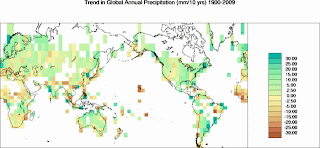 Some areas are expected to receive less rainfall, and consequently other areas must receive more. The natural consequence of that is that some regions are now more prone to droughts, and some more prone to floods.
And one crucial point you neglected is that, if air is dry, its increased capacity to carry water just means it sucks more moisture out of the environment than it used to. That means just looking at changes in precipitation understates changes in aridity in some areas.
Some areas are expected to receive less rainfall, and consequently other areas must receive more. The natural consequence of that is that some regions are now more prone to droughts, and some more prone to floods.
And one crucial point you neglected is that, if air is dry, its increased capacity to carry water just means it sucks more moisture out of the environment than it used to. That means just looking at changes in precipitation understates changes in aridity in some areas.
-
perseus at 16:55 PM on 30 June 2011Throwing Down The Gauntlet
What is surely more important is that others learn by your example and the behaviour spreads. There is little to be gained in being an isolated example and making oneself feel better. Surely the community as a whole needs to be encouraged (or made) to participate. Otherwise it becomes the mentality of sandbagging your stretch of the river whilst your neighbour does nothing. It only works if everyone does it. -
Stephen Baines at 15:02 PM on 30 June 2011Climate's changed before
That's really interesting kiwipoet. I think there are some important observations here that I have observed myself, albeit in a less obvious way. I wonder if you should post this in another thread where it might be more relavent - maybe the consensus image thread or another concerning communication of climate science. Any advice moderators?Response:[DB] Several come to mind, chief of which is probably this one:
Infographic: 97 out of 100 climate experts think humans are causing global warming
Prev 1606 1607 1608 1609 1610 1611 1612 1613 1614 1615 1616 1617 1618 1619 1620 1621 Next


![”([u,v])”](http://ju1zjq.blu.livefilestore.com/y1pWejubHFgnD3iG0P-29vDMF9nhqaiULIpGx734lu_lW8troVP7MjJU7rQnp5JvSEdIu09ukRzD1L32OJnOjbX5tTc-W0kU5J4/%5Bu%2Cu%5D120.png?psid=1)