


 Arguments


Recent Comments
Prev 1630 1631 1632 1633 1634 1635 1636 1637 1638 1639 1640 1641 1642 1643 1644 1645 Next
Comments 81851 to 81900:
-
Eric the Red at 13:45 PM on 21 June 2011Infographic: 97 out of 100 climate experts think humans are causing global warming
I see no reason to expect the climate uncertainty to be skewed towards the high end. One should read some of the papers presented by KR at 188, which includes the Annan and Hargreaves work. The papers which base their calculation of climate sensitivity on temperature data indicate a lower value. The Padilla paper list 2.0 as the most likely value. Modeling methods consistently yield higher values. There is some question as to the validity of incorporating the paleoclimate data as conditions differed greatly from the present. I see no evidence for a tightly centered range close to three. On the contrary, the range is rather broad, with each line of evidence generating sub peaks and curves within the larger range. Risks assessment may be useful for political and insurance purposes, but should not be incorporated in this scientific analysis. I would not advise anyone to ignore scientific practices and accept a questionable value for anything. I do not know why you would. Based on the previous analyses, there is less than a 50% chance that the climate sensitivity falls between 2.5 and 3.5. Why would politicians bet on high or low climate sensitivity in the first place? -
scaddenp at 13:31 PM on 21 June 2011It's methane
Crispy, my understanding is that the accounting for methane is based on effect that methane has before it is oxidised to CO2 compared fate of plant carbon if it hadnt been eaten by ruminant. You might like to look up the GWP (global warming potential) for more detail. -
csala at 13:27 PM on 21 June 2011A visual deconstruction of a skeptic argument
You say saturation I say equilibrium The people that wrote and commented on this post are much smarter than me but I have a different read on the information presented and humbly share. 800 g-tons of CO2 goes up of which 29 are man made 788 g-tons are assimilated back in carbon compounds The argument for global warming then is that because of saturation in the bio-system an excess of 12 g-tons is left aloft as a greenhouse gas blanket that will do its dirty deed as this excess iterates. My take on the presented argument is this. If I am to believe that there was equilibrium in the eons of time before industry, then how is it, that in this spec of geological time the earth suddenly, coincidentally went out of equilibrium. Well......, according to this presentation: 771 g-tons are naturally produced by the earth BUT the earth is in chaos because it is feeding on itself and collapsing the atmosphere 788 g-tons are assimilated back in carbon compounds A net deficit of 17 g-tons will regularly occur should all human activity cease immediately. Oh,... You say that equilibrium would be restored by natural processes should all human activity cease immediately. The earth would just immediately quit gobbling 17 g-tons more than it makes but can't gobble 12 g-tons more without relatively immediate and cataclysmic consequences to the planet. I think the math is being made to suit the argument. I argue homeostasis. No doubt the impact of human activity is felt across the spectrum of macro bio processes but I must add. "Exploiting the Earth—using the raw materials of nature for one’s life-serving purposes—is a basic requirement of human life. Either man takes the Earth’s raw materials—such as trees, petroleum, aluminum, and atoms—and transforms them into the requirements of his life, or he lives miserably. No fine arts, architecture, Science Channel, space programs, ecco-travel. Life as hunter/gatherers in many parts of the world where this is the norm, leave both the people and the land stripped and parched. To live, man must produce the goods on which his life depends; he must produce a means for homes, heat, transportation, technological multipliers such as computers, electricity, and the like; he must seize nature and use it to his advantage. There is no escaping this fact. Even the allegedly “noble” savage must pick or perish. Indeed, even if a person produces nothing, insofar as he remains alive he indirectly exploits the Earth by parasitically surviving at the expense of something else. The basic principle of environmentalism is that nature (i.e., “the environment”) has intrinsic value—value in and of itself, value apart from and irrespective of the requirements of human life—and that this value must be protected from its only adversary: man. Rivers must be left free to flow unimpeded by human dams, which divert natural flows, alter natural landscapes, and disrupt wildlife habitats. Glaciers must be left free to grow or shrink according to natural causes, but any human activity that might affect their size must be prohibited. Naturally generated carbon dioxide (such as that emitted by oceans and volcanoes) and naturally generated methane (such as that emitted by swamps and termites) may contribute to the greenhouse effect, but such gasses must not be produced by man. The globe may warm or cool naturally (e.g., via increases or decreases in sunspot activity), but man must not do anything to affect its temperature. [ -rant snipped-]Moderator Response: [Dikran Marsupial] If you want to understand the variations in atmospheric CO2, both recent history and on a geologiccal timescale, I can strongly recommend you read David Archer's primer on the carbon cycle, reviewed here. -
Norman at 13:24 PM on 21 June 2011Linking Extreme Weather and Global Warming
Tom Curtis @ 116 I have already seen the information on the 17 Nations that had record high temps in 2010. I guess there are currently around 195 countries on Earth (does change around a bit). What I was looking for is the entire data set of the World's Countries record high and low temps and in what year they took place. I could not find such information so my research is uncertain at this time as to determine if this is significant or not. Maybe in the larger data set clusters of record high and low are the norm and not the exception but only a complete data set will answer this. If you know how to find one I would be thankful. -
Norman at 13:19 PM on 21 June 2011Linking Extreme Weather and Global Warming
Tom Curtis @ 116 I don't think including China's flooding will help convince anyone that Global warming is increasing extreme weather events. Yangtze River has flooded 1000 times in 2000 years. The Yellow river has a long history of tragic floods. I would need some really solid evidence that floods in China are getting worse. China's floods are most frequent events. -
Jeff T at 13:16 PM on 21 June 2011Introducing the Skeptical Science team
It's great to see the faces and bio's behind the writing! -
Norman at 13:10 PM on 21 June 2011Linking Extreme Weather and Global Warming
Tom Curtis @ 116 I must state I do like the depth of thought and intelligence you display in your posts. You really do provoke thought. Thanks. Here is one on the Russian Heat Wave of 2010. Most are commenting about the unprecedented heat wave but what about the unusual cold at the same time in Siberia. Moscow was about 5 C above normal but at the same time Siberia was 5 C below. Did that set some record cold for this region? No one mentions it so I don't know. I can't find a resource for normal or record temps for Siberia on the web (such as Intellicast or Accuweather). Russia Heat wave of 2010. -
Bern at 13:10 PM on 21 June 2011Introducing the Skeptical Science team
I'll add my thanks to the team. Great work pulling the articles together. SkS is one of the first websites I refer people to if they want to actually learn about climate science (and sometimes even if they don't!) -
Norman at 13:02 PM on 21 June 2011Linking Extreme Weather and Global Warming
DB, On the Pakistan flooding issue. This article is a brief history of flooding in that area. 12 major floods in 69 years seems to indicate that this area is prone to floods and large floods are not a rare event. Can you link other weather related disasters in some of the flood years. It is hard for me to get much global weather destruction of earlier days. Pakistan flooding recent history. Another article does suggest the possibility of warming but also gives another reason as why this flood was so devestating. Man interference may have made the flood worse. -
Crispy at 12:51 PM on 21 June 2011It's methane
I wonder if someone could clarify a point for me? When sceptics say "you'll have to stop breathing then, because you're exhaling CO2" I point out that animal respiration is just part of the natural carbon cycle, (circulating 400Gt of CO2 a year), and that any carbon we breathe out was first captured from the atmosphere through photosynthesis to enter the food chain. Cow burps are treated differently however, and are seen as part of the problem. Is that because the carbon from the plants going through the cow is being converted (in part) to the more greenhouse active CH4, rather than merely being returned as CO2? (I realise cattle have a broader greenhouse footprint because of transportation and energy used in grain cultivation and so on, but I'm just curious about the methane here.) Many Thanks. -
Stevo at 12:49 PM on 21 June 2011Linking Extreme Weather and Global Warming
Is there a definition of what counts as an extreme weather event? If so, is anyone plotting them over time to determine their frequency? I'd be keen to find more information on this topic. Tom curtis' @ 116 provides a good example of frequent exteme recent weather events but is there a reliable record of these over a statistically significant period of time? -
Bern at 12:48 PM on 21 June 2011When scientists take to the streets it’s time to listen up
Stevo, I think you hit the nail on the head with your last sentence. It's a common political tactic. Scream your side of the argument to the heavens, and then shut down your opponent so they can't present their side. Alan Jones did just that to David Karoly in that recent radio inquisition. I've seen other 'sceptics' use exactly the same tactic on mainstream TV (much to the shame of the so-called moderators of the discussions). It seems the scientists have just about run out of patience, and might even think about being a little bit rude to get their point across (certain rap videos notwithstanding! :-) -
Tom Curtis at 12:12 PM on 21 June 2011Infographic: 97 out of 100 climate experts think humans are causing global warming
Eric the Red, given the range of independent studies based on independent data that indicate a range of values centred close to 3, it is very foolish to assume the marginal values are at all likely. There are several reason for this. First, as a matter of pure science, if you combine the evidential weight of multiple independent lines of evidence, you get a much more tightly constrained value than any of the independent lines. This can be seen by comparing the ranges of the three independent lines of evidence discussed by Annan and Hargreaves (mentioned by Albatross @192). They, of course, just discussed three lines of evidence. Given that nearly all the lines of evidence generate ranges centred close to three, if a similar technique where applied to all the evidence, a range very tightly centred on three would be the result. It is certain that the range of such a study would be within the range determined by Annan and Hargreaves, and is likely to be narrower. (My guesstimate would be a 95% confidence range around 2.5 to 4) Second, as a matter of policy, given a range of uncertainty, you should base your decision on a probability weighted estimate of loss or gain for each outcome. As the expected adverse impacts of global warming rise with increasing climate sensitivity, to that extent the climate sensitivity you should assume for policy purposes should be weighted towards the upper limit rather than the lower limit. Personally I don't expect that to happen, or argue for it. I want politicians to just accept the IPCC mean value (3) and base their policies on that. I expect that because, given available evidence, it is the more likely to fall close to the actual value than any other choice. As such, I am advising people to ignore standard decision theory or mini-max strategies both of which (as noted above) would require using a significantly higher value for policy settings. Now, can you give one good reason why it would be sensible for politicians to bet on a low climate sensitivity when the probability that the value is wrong is significant, and assuming a low climate sensitivity in their response to global warming will maximize the adverse consequences of global warming? -
Tom Curtis at 11:46 AM on 21 June 2011Linking Extreme Weather and Global Warming
Norman @115, because of the chaotic nature of weather, it is impossible to look at a single event and say this would not have happened, or not been as bad without global warming. So if you pick any single event, you are cherry picking. This is even true of the Russian Heatwave of 2010: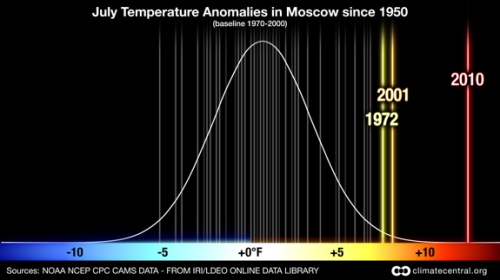 The Russian heatwave of 2010 is literally unprecedented in history. There is no historical record of a heatwave in Russia as intense of that of 2010 (though there is one that was a few days longer). Immediately after the heatwave, there was a denier jumping onto every site he could and posting a list of literary references to Russian heat waves, that he claimed where comparable or worse. His game was given away by one of the quotes which actually quoted temperatures, around 5 degrees lower than the heat wave of 2010, and there is no reason to believe any of the others quoted where any worse. On the contrary, there is every reason to believe the Russian meteorological deparment (whose name I can't remember) who said that no equivalent heat wave was on record in the last one thousand years.
That quote was the source of the often repeated claim that the Russian Heatwave was a one in one thousand year event. In fact, assuming a normal distribution (not a safe assumption) and relative to recorded July temperatures it was less than a 1 in 66,000 year event
The Russian heatwave of 2010 is literally unprecedented in history. There is no historical record of a heatwave in Russia as intense of that of 2010 (though there is one that was a few days longer). Immediately after the heatwave, there was a denier jumping onto every site he could and posting a list of literary references to Russian heat waves, that he claimed where comparable or worse. His game was given away by one of the quotes which actually quoted temperatures, around 5 degrees lower than the heat wave of 2010, and there is no reason to believe any of the others quoted where any worse. On the contrary, there is every reason to believe the Russian meteorological deparment (whose name I can't remember) who said that no equivalent heat wave was on record in the last one thousand years.
That quote was the source of the often repeated claim that the Russian Heatwave was a one in one thousand year event. In fact, assuming a normal distribution (not a safe assumption) and relative to recorded July temperatures it was less than a 1 in 66,000 year event
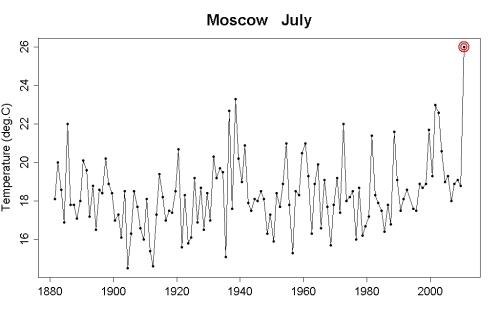 Not content with that, that well known "alarmist" Tamino calculated that using the known temperature distributions for Moscow, including those known to have been affected by global warming, the probability of the event was just 1 in 260 per annum. Without the recent warming trend due to global warming, it would have been around 1 in 1,000 per annum. (As an aside, it is predicted to become an annual event by the end of this century with global warming.)
But I can't just pick the Russian Heatwave and say global warming. That would be cherry picking. Nor can I pick the Pakistani flood and say global warming. From memory the Pakistani Flood of 2010 was the second largest in extent, the largest in damage done, but relatively low in terms of lives lost (due to modern communications, transport and medicine) in the just over one hundred year record of Pakistani floods. Nor the much worse, but under reported 2010 China floods, nor the 2010 Indochina floods.
Nor can I point to any one of the seventeen (plus?) national heatwaves in 2010.
In Australia, I can't point to the three 1 in 1,000 year rainfall events that happened in three days in a 60 by 60 mile area, thus causing the Brisbane floods. Nor can I point to the record flood affected extent in Queensland that more than doubled the previous record. Nor can I point to that previous record, set in March 2010. Nor can I point to the 2011 Victorian floods which where the worst floods in Western Victoria "...far as [the Bureau of Meteorology's] records go in terms of the depth of water and the number of places affected". Nor indeed to the floods in the same area in September 2010.
If I point to any one of these events, and the list is no where near exhaustive, I am cherry picking. But what I can do is point to the combination of them all. And then it becomes clear that both the number and intensity of extreme events is on the rise. And nor is it just a function of ENSO. La Nina conditions certainly contributed to the extensive flooding in Australia this year, but in March 2010 when Queenslands previous record for flood extent was set, there was a strong El Nino.
Not content with that, that well known "alarmist" Tamino calculated that using the known temperature distributions for Moscow, including those known to have been affected by global warming, the probability of the event was just 1 in 260 per annum. Without the recent warming trend due to global warming, it would have been around 1 in 1,000 per annum. (As an aside, it is predicted to become an annual event by the end of this century with global warming.)
But I can't just pick the Russian Heatwave and say global warming. That would be cherry picking. Nor can I pick the Pakistani flood and say global warming. From memory the Pakistani Flood of 2010 was the second largest in extent, the largest in damage done, but relatively low in terms of lives lost (due to modern communications, transport and medicine) in the just over one hundred year record of Pakistani floods. Nor the much worse, but under reported 2010 China floods, nor the 2010 Indochina floods.
Nor can I point to any one of the seventeen (plus?) national heatwaves in 2010.
In Australia, I can't point to the three 1 in 1,000 year rainfall events that happened in three days in a 60 by 60 mile area, thus causing the Brisbane floods. Nor can I point to the record flood affected extent in Queensland that more than doubled the previous record. Nor can I point to that previous record, set in March 2010. Nor can I point to the 2011 Victorian floods which where the worst floods in Western Victoria "...far as [the Bureau of Meteorology's] records go in terms of the depth of water and the number of places affected". Nor indeed to the floods in the same area in September 2010.
If I point to any one of these events, and the list is no where near exhaustive, I am cherry picking. But what I can do is point to the combination of them all. And then it becomes clear that both the number and intensity of extreme events is on the rise. And nor is it just a function of ENSO. La Nina conditions certainly contributed to the extensive flooding in Australia this year, but in March 2010 when Queenslands previous record for flood extent was set, there was a strong El Nino.
 Statistically, something unusual is happening with the weather. And in most cases there is an intuitive causal connection to global warming. Weather is complex, and chaotic, so the exact nature of the causal connection is in many cases still being thrashed out. But it would be shere folly to use that as an excuse to believe the statistical correlation between extreme weather events and increasing temperatures is a fluke.
-
Albatross at 11:36 AM on 21 June 2011Infographic: 97 out of 100 climate experts think humans are causing global warming
Eric @198, No. I'm flattered, byut my simple analysis of BPL's data is really not something you should be using to bet. Also, look at Knutti and Hegerl, the PDF is not symmetrical, it is skewed towards the high end. And AGW is not a betting game. -
Patrick 027 at 11:36 AM on 21 June 2011The Planetary Greenhouse Engine Revisited
Re Michele - the mesosphere on Earth is not convective. It is less stable than it would be with a zero or negative lapse rate, but there isn't much convection there. Generally, the convection that does occur in the Earth's stratosphere and mesosphere is thermally-indirect motions (heat pumps) forced by kinetic energy produced by thermally-direct motions (heat engines) in the troposphere; the kinetic energy - actually the fluid mechanical energy which is a combination of kinetic energy and APE (although the ultimate conversion of remaining kinetic energy to APE is the heat pump part) in the form of fluid-mechanical waves, propogates upward as gravity waves, equatorial waves of various types (associated with the QBO; I haven't read of this being thermally indirect or driving meridional overturning but I would think it has to be thermally indirect), and Rossby/PV waves (associated especially with the Brewer-Dobson circulation within the stratosphere and 'sudden stratospheric warmings'). The energy is absorbed above when and where kinetic energy is dissipated mechanically (mechanical damping of the waves) and otherwise converted to APE in thermally indirection motion with the resulting APE being dissipated radiatively (thermal damping of the waves). Really, we can think the CO2 molecules behave as heat engines which, colliding with the surrounding molecules, absorb thermal energy from them, and transform it to EM energy....Both the gradients are negative because the continuous growth of the geo-gravitational energy that phagocytizes them. So, the rising CO2 molecules never are in LTE, the thermal energy (needed to excite them until the resonance) is used for other different purposes (the rising of the entire air particle), and there can’t occur any radiative emission. ... The surface temperature is determined by the lapse rate and above all be the altitude where the rising air particles are stopped by the inverted slope due to the external radiative heating of a layer of the atmosphere above it. No, very much wrong and confused, sorry. The tropopause level doesn't necessarily or generally correspond to the effective emitting level. The fact that you can see spectra where some freqencies have brightness temperatures higher than the tropopause temperature should alone be a clue. Note also that the CO2 band is not only that part with the lowest brightness temperature; it extends outward from there. Same for water vapor, too. See 374 http://www.realclimate.org/index.php/archives/2011/06/unforced-variations-june-2011/comment-page-8/#comment-208838 383 http://www.realclimate.org/index.php/archives/2011/06/unforced-variations-june-2011/comment-page-8/#comment-208856 and some clarifying comments in between. Of course, also the surface radiation around 15μm forces and excites the CO2 molecules which could scatter it. I think this isn’t the case, otherwise, the brightness temperature around 15μm should be higher. The CO2 fully wastes the EM energy to heat close the ground and this can be partially converted back and emitted to space only at the top of the first convective layer above the ground. Actually near the center of the CO2 band, it is so opaque that much/most of the radiation emitted at the tropopause level is absorbed, relatively nearby. The net LW flux at the tropopause is or is close to zero; the effect is or nearly is saturated. Adding CO2 doesn't have much effect on the tropopause radiative forcing at the center of the band. It DOES have an effect a bit outside the center of the band, where it's opacity is intermediate (it will also have some indirect effect as stratospheric adjustment will affect the downward flux from stratospheric water vapor and ozone as well as CO2). The opacity for a given level of CO2 drops roughly exponentially away from the band center, which is why each doubling of CO2 effectively widens the band by a given amount and has a corresponding amount of radiative forcing (if there were only a tiny amount of CO2 then the band center wouldn't be saturated and the forcing would tend to be more linearly proportional to CO2 amount; for the amount of CO2 on Venus, other bands become important and the proporitionality if forcing to amount of CO2 is different again. (Also, the climate itself affects the forcing per unit amount change - different wavelengths have different relative importances at different temperatures; the radiative fluxes change; there are variations in water vapor and cloud overlap on Earth (etc. for Venus, though I'm not sure how the feedbacks work there), and the vertical temperature profile is important. Also there are variations in line broadenning and line strength, ... etc.) -
Eric the Red at 11:30 AM on 21 June 2011Infographic: 97 out of 100 climate experts think humans are causing global warming
I am not picking anything. These are the ranges chosen by the three other posters. Betting under 2 appears to have a similar likelihood as over 4. -
Stevo at 11:28 AM on 21 June 2011When scientists take to the streets it’s time to listen up
ClimateWatcher @3 "Taking to the streets is an emotional exercise." Actually it is a political exercise - an attempt to draw public attention to an issue. That issue is the campaign by vested interests and certain political blocs to obscure or misdirect the message that AGW is real. The current denialist line is that the science is not consistant or conclusive. Doubt is cast over every detail the business as usual advocates can find but no consistant alternative thesis is put forward. Scientists are frustrated that their work so far is not being fairly reported. They've done (and continue to do) their work with regard to the science. The new task is to get the message out to the public because media and political policy makers have laregely failed to do so. Your comment suggests that scientists are not entitled to the same political rights as other members of the community. -
Patrick 027 at 11:04 AM on 21 June 2011The Planetary Greenhouse Engine Revisited
Re 20 guinganbresil - I think that's an interesting issue and I tried to estimate some things myself at another post - I think it was in comments at an earlier post by Chris Colose on his own blog. Perhaps a scale analysis (this may be over or underdetermined and there may be some errors, but at least this gives a sense of what might be done): U ~ L/T, Area ~ L^2, heat flux ~ R*L^2, where R is *a* radiative forcing, heat flux between hemispheres ~ U*L*(Th-Tc)*H*cp*density, rate of kinetic energy production by horizontal motion ~ L*H*U*L*(ph-pc) = U*H*L^2*(ph-pc) where ph-pc is a representative pressure difference between the cold and hot side and proportional to Th-Tc (at surface the difference will have an opposite sign than at the top of the overturning layer of depth H - or H could be an e-folding scale), kinetic energy supply ~ R * L^2 * 1-Tc/Th, viscous kinetic energy sink ~ viscosity * L^2 * U/H - or is it U^2/H, or U/H^2, I'll have to get back to that... mixing kinetic energy sink (mixing heat downward) ~ ? (could be negative or zero on the hot side - or incorporate thermally direct localized overturning on the hot side into the mixing term, and it would be negative if the export of heat by horizontal winds is sufficient to maintain a greater than adiabatic lapse rate), Actually I need to go back and specify R farther; Rh could be the net radiant heating of the surface in the warm hemisphere; Rc could be the radiant cooling of the surface in the cold hemisphere; 1-Rc/Rh ~ (1-Tc/Th), except that whatever kinetic energy is produced is eventually converted to heat anyway, which in terms of necessary heat flux would be divided into an addition to Rc on the cold side (kc) and an effective addition to Rh on the warm side (kr) so that for the actual Rc and Rh, 1-(Rc-kc)/(Rh+kr) ~ (1-Tc/Th), and Rc-kr = Rh+kr ... no wait, that can't be right... Rate of conductive heat supply to surface on cold side ~ L^2 * (THc-Tsurfacec)/H * K , where THc is the temperature at height H above the now go play with it. Some of the above clearly needs more work, but some things are clear: Note that you could have overturning with cold air masses sliding under warm air masses without actually having an adiabatic lapse rate. In fact, that kind of overturning decreases the lapse rate. With cold air coming in over a warm surface you could get something more like a troposphere, and perhaps some stable layer of air in the 'winter/night' hemisphere/region would be considered part of the global tropopshere as it is on Earth (although the troposphere is still not as stably stratified as the stratosphere - except maybe (I'm not sure) in the inversion near the surface, which is not the whole troposphere). However, in the polar nights on Earth, the troposphere, heated by horizontal import of warm air from warmer places, can lose that heat to the surface by radiation and conduction/mixing and can lose that heat to space (and the stratosphere) by radiation as well. With no greenhouse effect (specifically of the emission/absorption kind), the troposphere cannot cool by emitting radiation, and so either it must be warmer or the surface must be cooler to get the same heat flux, which must be entirely to the surface. Kinetic energy from the large scale overturning may drive downward mixing of heat; otherwise you have to rely on conduction/diffusion. Possibly the lapse rate would be such that the stratosphere does reach the surface. The troposphere might perhaps be a bubble on the hot side, which may extend somewhat into the night/winter side. The depth of the overturning layer in the night/winter side must be small enough for conduction to make up for what mixing cannot accomplish, to balance the heat supply - itself limited by the depth of the layer and the wind. Thus the layer may tend to be shallow. The tropospheric thickness on the hot side would be determined in part by the supply of cold air from the cold side, which would be determined by the wind speed and the depth of the layer which can lose heat to the surface at the necessary rate. So the troposphere on the hot side may also be forced to be shallow. If there is any solar heating of the air itself, this also has to be mixed and/or diffused/conducted downward. -
Chemware at 10:52 AM on 21 June 2011When scientists take to the streets it’s time to listen up
@3, ClimateWatcher: "Cold rationality" - clearly you are not a scientist, and have never participated in a "vigorous" scientific debate ! I also dislike your attitude of "Scientists should be seen and not heard", and find it rather patronizing. Getting back to the article itself, and attacks on scientists in general, what we are witnessing now is comparable to the Catholic church's attacks on heliocentrism, and to the Nazi's campaign against "Jewish Science". Fortunately, it has not reached the intensity of those attacks, but with trillions of dollars and political power at stake, I fear for the safety of all working scientists, particularly those with a high media profile. -
scaddenp at 10:42 AM on 21 June 2011Infographic: 97 out of 100 climate experts think humans are causing global warming
But evidence we have is that cloud feedback is near neutral. There is uncertainty but below 2 is not the way to bet. -
Tsumetai at 10:42 AM on 21 June 2011Climate change denial and the abuse of peer review
Nice piece overall, but:What happens to data if successive annual values are subtracted from each other? This mathematically removes any linear time trend. In other words, temperatures could have doubled every other year and it would have escaped detection by the authors.
Doubling every other year is not a linear trend. -
Norman at 10:31 AM on 21 June 2011Linking Extreme Weather and Global Warming
Some have stated I am a "Cherry Picker" on posting historical weather events. I look at the history of each area that is considered a major deviation and look at some historical information on that area. I looked at the history of Pakistan floods and severe flooding is not so extreme as it seems to happen often enough. I would like someone to define what an "extreme" weather event is so research can progress to see if weather anomalies are really getting more extreme in a warming world. What would constitute an extreme rainfall amount? What is an extreme temperature? Name an extreme weather event that occured this year so I will not be blamed for cherry picking.Response:[DB] "I looked at the history of Pakistan floods and severe flooding is not so extreme as it seems to happen often enough."
Umm, you may want to try reading your posts before submitting them. Because you're saying the record-setting floods of 2010 happen often enough...
Actual analysis instead of the Eyecrometer is called for.
-
Patrick 027 at 10:19 AM on 21 June 2011The Planetary Greenhouse Engine Revisited
Re guinganbresil - If you made the atmosphere transparent below the cloud deck, and the temperature of the surface were sufficiently high, so that the heating of the cloud deck by radiation from the surface were sufficient, if the cloud deck were completely burned off as a result, then the surface radiation would simply go off to space (unless there's another cloud deck or some other source of opacity above) - furthermore, the backradiation at the surface from the original cloud deck would be lost. The net LW (radiant) cooling of the surface would be increased, which would be taken away from energy available for convection. The net LW flux at the tropopause level (above convection) would increase, cooling the whole surface+troposphere, so even if the lapse rate were maintained, the surface temperature would fall. This is setting aside the effect on solar radiation. The burning off of a cloud deck is a feedback of the same category as water vapor feedback and surface albedo feedback. Lets' keep the cloud deck and see what happens. The increased net LW flux in the space between the surface to the cloud deck must be balanced by a reduction in convection - if the convective flux was originally not big enough, convection could go to zero and the lapse rate could decrease, creating a stable layer and necessarily tending to reduce surface temperature while increasing the temperature at the cloud deck. But looking for what happens at equilibrium, it's easiest to get to the effect at the tropopause level and then get back to convection. Even if there remains some convection beneath the cloud deck and the surface temperature is sustained, the cloud deck must then get warmer and the emission from the top of the cloud deck will increase. This will tend to increase the net LW flux out of the tropopause and out to space (effect modulated by absorption by overlying layers). Thus this situation cannot be sustained; energy is being lost from the troposphere and surface; there must be a temperature reduction. If both the cloud deck and surface remain in/adjacent to the troposphere, the nonlinear relationship between temperature and emission will reduce the net LW flux from the surface to the cloud deck. Whether or not the reduction is sufficient to allow convection to be the same or greater than it was originally (before removing opacity from the space between clouds and surface) is not determined as this description is too general. -
NewYorkJ at 10:01 AM on 21 June 2011Climate change denial and the abuse of peer review
I read the Stoat summary wrong. It certainly seemed highly unlikely that Happer would ever recommend rejection of a Lindzen paper. So Lindzen's argument boils down to the fact that he doesn't appreciate an independent review (that could improve the quality of his paper) or scrutiny of the qualifications of his reviewers. What's more revealing is that while the rejection of Happer was due to his insufficient expertise on the subject matter and Chou's rejection related to his collaboration with Lindzen on Iris (conflict of interest), Lindzen rejected 2 suggested alternate reviewers on the basis of: "Both are outspoken public advocates of alarm, and Wielicki has gone so far as to retract results once they were shown to contradict alarm." How professional - this after claiming the Happer rejection justification was "libelous". One of Lindzen's alternate reviewers (Minnis) was said to be chosen. Lindzen then characterizes the paper being rejected in the end only because it was too long. Yet all 4 reviews noted: Suitable quality: No (x4) Conclusions justified: No (x4) -
Riduna at 09:59 AM on 21 June 2011Who's your expert? The difference between peer review and rhetoric
Peer review is gatekeeping but does it keep out error? Peer review is review by a few selected (by who?) for their expertise. Only if published is a Paper exposed to wider peer review. Above all, peer review is the very foundation on which science moves forward and, without being able to rely on it, science in its many areas of research could not be accepted as being error-free based on current knowledge. Little wonder then that those who do not expose their work to peer review or could not pass it if they did should attack it – and be resisted. But does this mean that it is always right or, for science, the best of all possible worlds? -
Philippe Chantreau at 09:44 AM on 21 June 2011Climate change denial and the abuse of peer review
Thanks once again John for pointing out the obvious. Deep Climate has extensively analyzed works by Wegman and found substantial problems of plagiarism and what could only be described as academic shortcomings. They also have a in depth discussion on Wegman's use of the atrocious McIntyre and McKitrick paper that was used to try to convince the gullible that Mann's methods generate hockey sticks out of random data. It is truly a work of art in deception. I am yet to hear anything from skeptics about it that would make sense.Response: [JC] Note - Steve Lewandowsky wrote this article. I'm just reposting it from The Conversation website. -
Norman at 09:33 AM on 21 June 2011There's no room for a climate of denial
Tom Curtis @98 Your overall point "My point is, however, that this is not a reason for denial in any person, or at least it is not a substantive reason." I totally agree with you on this. Most people do not seem to be scientifically literate (at least from my experience) very few would read a peer-reviewed climate article for themselves. They rely on Media to help them understand complex issues they do not have time or interest to explore at greater depth. I was posting that to explain why people are losing interest in Climate Change science and switching to a denial state of mind. On this thread you have two video posts Albatross @28 and Daniel Bailey @39. Both are expamles of using an emotional appeal to sway a mental state. "Do you want to be a blind idiot and drown even as we try to save you....severe denial" From Albatross video. Or tornado in Joplin connected to Climate Change. I read articles here daily but rarely post. The Daniel Bailey video started my posts because it so closely resembled arguments I have had on Conspiracy sites when individuals claim all bad weather events are HAARP induced. The HARRP posts are what started me looking at Historical weather events to see if things really are getting worse today. So far I have not found enough evidence on this site to verify this sentiment or any other site.Response:[DB] This site keeps its focus on science, not on tin-hat-isms. Please keep that in mind when constructing your comments.
-
KR at 09:24 AM on 21 June 2011Infographic: 97 out of 100 climate experts think humans are causing global warming
Eric the Red - Given the best evidence we have to date, the climate sensitivity could be under 2ºC. It could be over 4.5ºC. Our evidence indicates that it's most likely about 3ºC. You seem to be picking strictly from the lower estimates, of low probability - you might as well pick from the high estimates of low probability. Neither is a sensible choice. -
KR at 09:21 AM on 21 June 2011When scientists take to the streets it’s time to listen up
I've been searching for it, but cannot find it - a cartoon that speaks to this topic: A man in a lab coat, looking a lot like Einstein, comes out into the hall with a horrified expression and a sign saying "The End Is Near!". Two other lab-coated men in the foreground look at this, one remarking "I don't like the looks of this..." When those scientists who actually know the subject under consideration take to political demonstrations, that means they have something to worry about! -
KR at 09:17 AM on 21 June 2011Climate change denial and the abuse of peer review
NewYorkJ - I believe that Will Happer was outright rejected by the PNAS editors (as was Chou, Lindzen's co-author on the 2001 "iris" paper); Lindzen suspects that one was Minnis; another might have been Ramanathan. The other two apparently came from the editors original suggestion list. -
Stevo at 09:06 AM on 21 June 2011Introducing the Skeptical Science team
Thanks for this page, John. Its good to be able to put faces to some of the names of folks who have so helpfully and patiently answered my questions. This site is a great resource for those of us without a science background and I've handed out a few copies of "The Scientific Guide to Global Warming Skepticism" to freinds who have shown genuine interest in learning about what the science actually says. -
Eric the Red at 08:49 AM on 21 June 2011Infographic: 97 out of 100 climate experts think humans are causing global warming
scaddenpm the reason many lower ranges are below 2.0 is the uncertainty of the cloud feedback, which could be a large negative. It is not undiscovered, just unknown with enough certainty to enforced a higher limit. That is just one, there are others. The 95% ranges for the three previous analyses are 1) 1.5 - 5.0, 2) 1.7 - 4.9, and 3) ~0.1 - 5.1. There are several others with their own ranges. These are just three. This is why I cringe whenever someone makes a claim that the climate sensitivity is a certain value and then makes projections based on that. Hence, I disagree with anyone who makes such a claim. -
scaddenp at 08:17 AM on 21 June 2011Infographic: 97 out of 100 climate experts think humans are causing global warming
The range of sensitivities (ie constrained by physics) is much lower than that found in empirical estimates of sensitivities as you would expect. The important point is that empirical estimates are consistent with model estimates. A sensitivity of less than 2.0 requires a so far undiscovered negative feedback. -
Albatross at 08:13 AM on 21 June 2011Linking Extreme Weather and Global Warming
Camburn @110, "Charlie A posted from the Univiversity of Florida. I am sure their work is sound concerning hurricane intensity and quantity. It looks like you are dismissing this work because it does not agree with your perception. We are getting our wires crossed, my apologies. At #109, I was referring to Norman's comment @70 about the hydrological cycle, not to the ACE index. -
scaddenp at 08:13 AM on 21 June 2011When scientists take to the streets it’s time to listen up
"Science is an exercise of cold rationality." When your fellow citizen's would rather believe in fairies than see a problem coming, then the rational thing to do might well be hit the streets. Imagine predicting an earthquake and keeping it a learned journal without telling the citizens. When the earthquake struck, how would the citizens feel? In this case, the scientist can at least say "well we tried but you were too deep in your political shell to listen". -
scaddenp at 08:01 AM on 21 June 2011CO2 Currently Rising Faster Than The PETM Extinction Event
Rob, Karsten Kroeger works in same section/team as me. So, yes. I am Phil Scadden at GNS Science. Just email me. -
NewYorkJ at 08:01 AM on 21 June 2011Climate change denial and the abuse of peer review
So it seems all 4 reviewers rejected L&C (Jan. 19, 2011 message), and 2 of those reviewers were recommended by Lindzen, one which included Will Happer (of all people)? Did anyone visiting the WUWT zoo point that out? -
davidpalermo at 07:57 AM on 21 June 2011Introducing the Skeptical Science team
I too am very grateful for this site! I am using it more and more as a main source of credible information. Or when I can't figure something out I usually start here. Keep up the good work! -
KR at 07:50 AM on 21 June 2011Infographic: 97 out of 100 climate experts think humans are causing global warming
Albatross - Quite clear, thank you. -
JMurphy at 07:49 AM on 21 June 2011Climate change denial and the abuse of peer review
Would the disgraceful mixing of the pseudo-scientific and ideology (with the emphasis on the latter) produce a form of denial belief-system called Scientology...if that name hadn't already been taken, off course ! -
Albatross at 07:44 AM on 21 June 2011Infographic: 97 out of 100 climate experts think humans are causing global warming
KR and Eric, I did not see the point of undertaking a rigorous stats analysis of the papers involved. Annan and Hargreaves however have looked at the upper range of climate sensitivity. They determine that: "A+H [Annan and Hargreaves]combine three independently determined constraints using Bayes Theorem and come up with a new distribution that is the most likely given the different pieces of information. Specifically they take constraints from the 20th Century (1 to 10ºC), the constraints from responses to volcanic eruptions (1.5 to 6ºC) and the LGM data (-0.6 to 6.1ºC – a widened range to account for extra paleo-climatic uncertainties) to come to a formal Bayesian conclusion that is much tighter than each of the individual estimates. They find that the mean value is close to 3ºC, and with 95% limits at 1.7ºC and 4.9ºC, and a high probability that sensitivity is less than 4.5ºC. " Good enough? -
KR at 07:29 AM on 21 June 2011Climate change denial and the abuse of peer review
The same column referred to in the Lindzen goes Emeritus link, written by Chip Knappenberger based on information from Lindzen, also showed up at WUWT June 9th - complaining that Lindzen had received special treatment that led to his paper being rejected by PNAS (twice), and before that from GRL. Discussion (ahem) ensued. Lots of "conspiracy" claims, criticisms of L&C rejected based upon Lindzen's "authority" in the subject compared to anonymous posters (basic "argument from authority"), many references to the "warmistas" and the "Team"... about what you might expect. The rejected papers are referenced here, the PNAS reviewers comments are referenced here, where I posted them on an earlier Lindzen & Choi thread. (Note - I did miscalculate the impact factor/citations for E&E in that post, typing too quickly and not checking my reference) -
Albatross at 07:22 AM on 21 June 2011Linking Extreme Weather and Global Warming
Rob @112. Thanks for trying, but I'm sure your post will fall on deaf ears. I have tried to relay this point countless times...but they just keep repeating the same old tired mantra..."the climate has changed before, there have been extremes before, so ergo we do not have anything to be concerned about". Hmm, wonder how many people there were in the early Holocene? Hmm, ~10 billion of us expected later this century, many of them who are not free or have the ability to move as our predecessors could. As you can see from #111, they will not concede that they were wrong. What matter in their own back yard (if it fits their beliefs) will do just fine. ENSO teleconnects differently for different regions, and even differently for different parts of the USA. So we have no way of validating this claim. And yet another statement of fact with unsupported links. This is the NOAA/NWS/CP latest weekly assessment. Camburn claims that the recent La Nina will continue to affect his region until October or November. This is what the IRI have to say: "These observations indicate the presence of neutral ENSO conditions. Because the atmospheric component of the episode was so strong and long-lasting, however, some of the climate conditions associated with La Niña may continue to a mild degree through late June." And here is what CPC/NCEP has to say in their latest assessment: "Collectively, these oceanic and atmospheric anomalies reflect a transition to ENSO-neutral conditions, but with lingering La Niña-like atmospheric impacts, particularly in the global Tropics." Nothing about impacts lingering into the fall over the USA. So the WMO, IRI and NOAA (and affiliates CPC, NCEP, NWS) are all in general agreement, and nothing in that NOAA assessment about affects of the recent La Nina continuing into the fall. I think Mr. Camburn ought to send a very strongly worded letter to them arguing that they are wrong. -
KR at 07:18 AM on 21 June 2011Infographic: 97 out of 100 climate experts think humans are causing global warming
Eric the Red The IPCC states that "...‘equilibrium climate sensitivity’, is likely to lie in the range 2°C to 4.5°C, with a most likely value of about 3°C. Equilibrium climate sensitivity is very likely larger than 1.5°C.". (Emphasis added) As per IPCC definitions: "Likely" > 60% probability "Very likely" > 90% probability So yes, that math has been done. -
Bob Lacatena at 07:10 AM on 21 June 2011Climate change denial and the abuse of peer review
I can't wait to see what our resident skeptics have to say on this one. -
Rob Honeycutt at 07:00 AM on 21 June 2011Linking Extreme Weather and Global Warming
Camburn... I think miss the entire point of, not only this conversation, but the entire issue of climate change. No one disputes that the planet has likely been about where we are right now during the Holocene optimum. The whole point is that natural forcing and feedbacks should have us on a gradual cooling trend in line with the past 6000 years. But we are seeing a rapid rise in temperature. The issue is not whether the planet has seen something like what we are currently seeing now. The whole issue is, if we continue changing the radiative balance of the atmosphere, what do we expect to happen? What kind of world are we bequeathing to our children and grandchildren? -
Eric the Red at 06:54 AM on 21 June 2011Infographic: 97 out of 100 climate experts think humans are causing global warming
Yes, I know BPL had a list which included a half dozen papers below 1.0, and 3 above 5.0. Neither of these convince me that it is below 1 or above 5. Does it convince anyone else. The range is quite large, mostly due to the large uncertainties associated with the various feedback loops. Much more work is needed in this area in order to narrow the range. Albatross, you display a one sigma uncertainty. Have you done the math for the 95% range. -
NewYorkJ at 06:51 AM on 21 June 2011Climate change denial and the abuse of peer review
A recent case with Lindzen: L&C, GRL, comments on peer review and peer-reviewed comments A very recent case with Lindzen: Lindzen goes Emeritus -
David Horton at 06:31 AM on 21 June 2011When scientists take to the streets it’s time to listen up
Climate Watcher succinctly summarises the denier approach. It is fine for the denial industry to use every resource available - massive media support, energy company funding of "think tanks" and denier groups, members of parliament, production of bots to infect threads, shock jocks manufacturing outrage - but they don't want any opposition to that very successful campaign, so scientists should just stay in their laboratories quietly and objectively. Not seen and not heard. Hey, they might not even exist. The Lynas thing is a confluence of two forces. One is the same as the CW approach. Any time we can find any group with environmental concern involved in any way with the IPCC process, why, we will protest loudly.Groups concerned with the environment obviously have no business being concerned with the environment. So we will kick any head that emerges, that will make people wary of using people with environmental concern in any capacity at all. Job done. The second strain is the nuclear one. The nuclear promoters have seen in the climate change concern the ideal vehicle to ram home nuclear power as a solution overcoming all the concerns that people have about it. if you don't want nuclear power then you can't, obviously, be seriously concerned about climate change, goes the line. But simultaneously they have to block any attempt by people supporting renewable energy to put the case. pretend that there is no possible way renewable energy can do the job. Especially "80%". So shoot the messenger.
Prev 1630 1631 1632 1633 1634 1635 1636 1637 1638 1639 1640 1641 1642 1643 1644 1645 Next


