


 Arguments


Recent Comments
Prev 1641 1642 1643 1644 1645 1646 1647 1648 1649 1650 1651 1652 1653 1654 1655 1656 Next
Comments 82401 to 82450:
-
Bob Lacatena at 08:40 AM on 27 June 2011Sea Level Hockey Stick
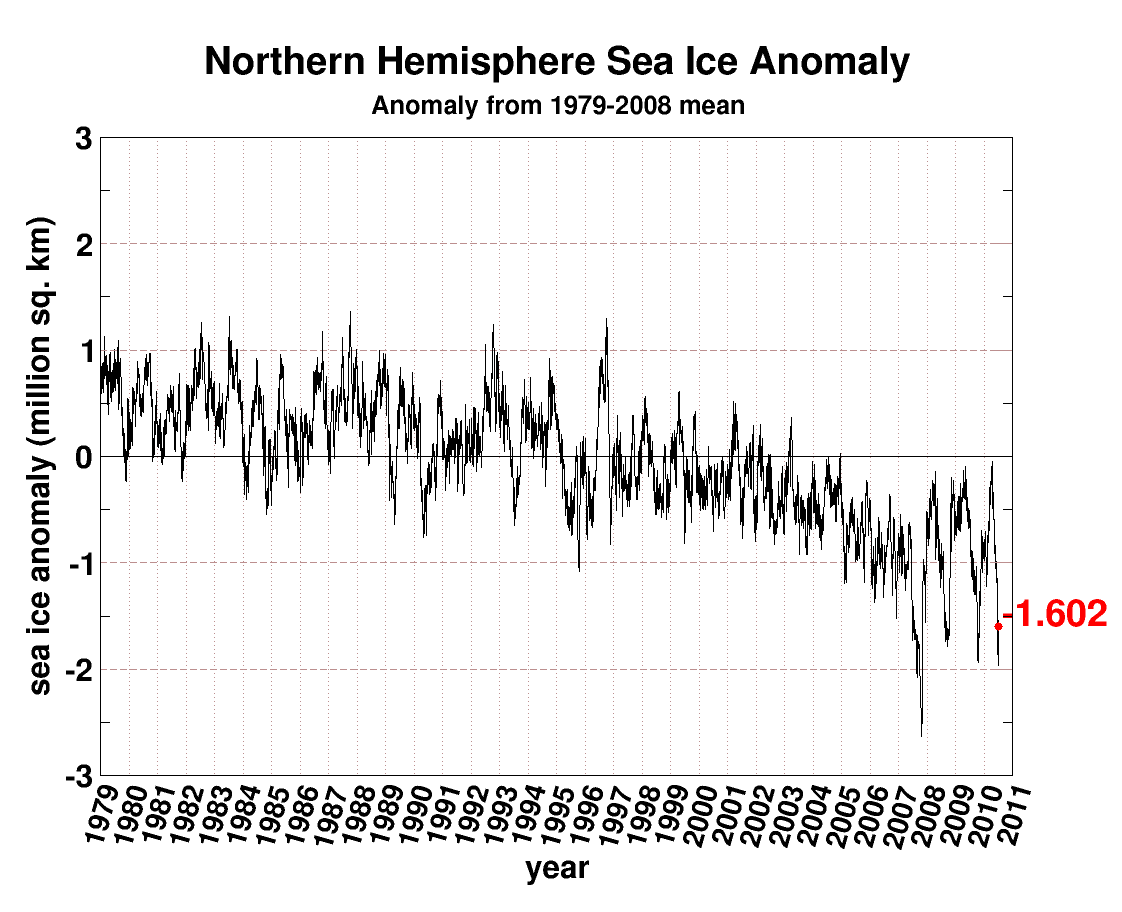
120, okatiniko, Which of these hockey sticks do you refute? Or perhaps Arctic sea ice extent? Or perhaps Greenland ice mass? -
KR at 08:26 AM on 27 June 2011Linking Extreme Weather and Global Warming
Norman I would suggest the data sets available here, here, or here, among others, as global precipitation information. I'll note that finding these records from NOAA and NASA took roughly 3 minutes of Google time. And as I said earlier, you have not justified any issues with the data from Munich Re, who accumulate extreme weather information as part of their normal business cycle: “It’s as if the weather machine had changed up a gear. Unless binding carbon reduction targets stay on the agenda, future generations will bear the consequences.” "...it would seem that the only plausible explanation for the rise in weather-related catastrophes is climate change" -
KR at 08:12 AM on 27 June 2011Uncertainty in Global Warming Science
Camburn 1. This site is using AGW as a tool to promote alternative energy. So to say no one is a bit deceptive? Ah, the familiar sound of conspiracy theories... better meds are suggested, as this cannot be taken seriously. 2. I understand the physics very well concerning co2. IF co2 was the only greenhouse gas it would be a slam dunk. It isn't. Evidently you don't. The physics of CO2 and it's effect on the greenhouse effect are a Type A kind of knowledge; your assertions otherwise indicate that you need to work on your physics. 3. Sphaerica: Your 1st description of a driver is correct. Then you understand that sometimes things act as feedbacks, and at other times (like now) when changed independently of temperature, they act as forcings? Like anthropogenic CO2? 4. KR: I can only suggest that you do a 100 year mean....then look at temperature within that mean. Over a 100 year mean, the temperature has risen. Over a 30 year mean, the temperature has risen much faster, and out of sync with natural forcings. Hence the 'unnatural' forcing of CO2 is responsible for that. And 30 years is plenty of time for the trend to emerge from noise and internal variation. 5. Mysterious unkown cycles. Ya betcha. There are hints of these that are being uncovered. That is why they are uknown, and mysterious. "Assertions made without evidence can be dismissed without evidence" - Christopher Hitchens. 'Nuf said. 6. Our understanding of the co2 effect on climate is not really that good. That is why there is such a variation in the outcomes of climate models. Really. Seriously. You want to produce some references that demonstrate that unsupported statement? --- So - assertions that well known physics such as CO2 and IR effects are not actually known, misunderstandings of feedback/forcings, evident lack of knowledge of statistics, assertions of 'cycles' without any evidence thereof (especially evidence that stands up to a statistical analysis), and more claims that we don't know anything. Denial, Camburn, this is all just denial. -
okatiniko at 07:52 AM on 27 June 2011Sea Level Hockey Stick
119 : I never stated that, so I cannot retract it. I said you can generate hockey stick shapes even with random pseudo-proxies, so the amount of loss of variance with real proxies is questionable, and I won't retract it. Proxies are just inaccurate indicators, and they are even unable to show any modern unusual increase of anything after 1970 - unless you give me a reference proving the opposite. -
Bob Lacatena at 07:51 AM on 27 June 2011Uncertainty in Global Warming Science
33, Camburn,Our understanding of the effect of co2 on climate is not really good. I will stand by that statement.
So you stand by a subjective and quite honestly indefensible claim. But we are wandering far off-topic. Dr. Franzen's post discusses how to discuss climate science with deniers, based on their level of acceptance of the science, as usefully divided by Dr. Franzen into Type A, Type B, and Type C. You refute all three types in various ways, so discussion with you is pointless, because your positions are unscientific and based purely on your own subjective perspective, rather than any factual basis. As such, there is no argument that you cannot refute by simply beginning any sentence with the magic words "I believe..." -
Bob Lacatena at 07:47 AM on 27 June 2011Uncertainty in Global Warming Science
32, Camburn, I don't need a list of more papers. I need to understand how two studies that discuss the "F10 Flux" in any way affect climate, which is to say, they are interesting studies of the mechanics and machinations of the sun, but that does not of itself require or even imply that such issues have anything to do with climate. The sun is the source of energy in the climate system, but it is also a fairly constant source of that energy. To claim otherwise, you must produce the proof which has been woefully absent to date and does not yet exist that in anyway clearly describes a mechanism and demonstrates some correlation between the behaviors being discussed and climate. Without this, cries of "F10 Flux Sun Magnetism Cosmic Ray Brouhaha" are nothing more than hand-waving distractions. -
Bob Lacatena at 07:41 AM on 27 June 2011Uncertainty in Global Warming Science
31, Camburn,This has not been demonstrated in any study from paelo literature that I have read.
Any? Any? Are you serious? This is quite simply an unbelievable statement. Start here. You can also look here for more. If you want to argue that there is a chance that climate sensitivity is low because some studies show it (low meaning 2˚C), that's one thing, but to actually say that you've never seen any? That's quite a statement to make. -
MattJ at 07:36 AM on 27 June 2011Uncertainty in Global Warming Science
@camburn, #33 You may "stand by" that, but like with Luther's infamous "hier steh ich", you take your stand in an ill-advised fashion. For the truth is simply not on your side. Our understanding of the effect of CO2 on climate is good enough to know: we must cut back drastically and immediately on CO2 emissions, without increasing other GHGs, to prevent unmitigated disaster. It is already too late to prevent disaster, we are going to go through a stressful time worse than any since the Black Death, but it will be much, much worse if we don't cut back now. -
Tor B at 07:29 AM on 27 June 2011The false, the confused and the mendacious: how the media gets it wrong on climate change
okatiniko, You critique a bit of grammar, and choose to ignore "The changes are rapid and significant" even after quoting it, thus providing the shallowest of straw-man distractions that you ought to be embarrassed by. If you were serious about what was written, you could have offered a question such as, "Did you mean for the escape clause "may be" or did you intend "will be" or "are"? -
Robert Murphy at 07:28 AM on 27 June 2011The false, the confused and the mendacious: how the media gets it wrong on climate change
"the chance that the statement "the implications may be dire" is wrong is exactly zero, since "may be" can not be false." The statement "The chance of these statements being wrong is vanishingly small" refers to all of the points made in that section: "We know that atmospheric CO2 is increasing due to humans. We know that this CO2, while being just a small fraction of the atmosphere, has an important influence on temperature. We can calculate the effect, and predict what is going to happen to the earth’s climate during our lifetimes, all based on fundamental physics that is as certain as gravity. The consensus opinion of the world’s climate scientists is that climate change is occurring due to human CO2 emissions. The changes are rapid and significant..." The phrase you decided to criticize was not covered under "The chance of these statements being wrong is vanishingly small". "But the chance that the implications won't be actually dire is not vanishingly small, of course." Why "of course"? That's an assertion without any evidence. There is some uncertainty as to how dire the changes will be for us, but the odds that they won't be dire is not vanishingly small. -
Camburn at 07:27 AM on 27 June 2011Uncertainty in Global Warming Science
Sphaerica: Our understanding of the effect of co2 on climate is not really good. I will stand by that statement. As of yet, because we can not model clouds and the hydro cycle well, the current sensativity of our climate to co2 is in the type C science. -
Camburn at 07:24 AM on 27 June 2011Uncertainty in Global Warming Science
Sphaerica@30. Yes, the items I have posted on the sun DO have a bearing on climate. Give me a day....I will post published papers showing paleo studies reflecting the influence of magnetic field strenth etc. They are written by Astrophysisists. -
Camburn at 07:21 AM on 27 June 2011Uncertainty in Global Warming Science
Sphaerica: I will 100% support, all other items being constant, that a doubling of co2 from 280 ppmv to 560ppmv will increase temperature by 1.3C. I will not 100% support that doubling co2 will result in a temp rise of 3.0C. This has not been demonstrated in any study from paelo literature that I have read. If you can point me to a valid study that shows this, I am more than willing to read and digest it. I agree 100% that the rate of emission of co2 at present levels is foolhardy. I have stated a few of my reasons in a previous post. -
Bob Lacatena at 07:09 AM on 27 June 2011Uncertainty in Global Warming Science
22, Camburn, Nothing you have posted on the sun so far on this thread has any direct bearing whatsoever on climate. Do you have any point at all with those posts? If so, can you please connect the dots? -
les at 07:09 AM on 27 June 2011Sea Level Hockey Stick
118 - You seem to find it very easy to be sure of things you gave no evidence for. Not least of all how much others here know. Still. Nice to see that you have retracted your claim that the proxy reconstructions recreate the hockey stick shape due to the affects of noise. That is sufficen. -
Bob Lacatena at 07:05 AM on 27 June 2011Uncertainty in Global Warming Science
21, Camburn,Our understanding of the co2 effect on climate is not really that good.
False. 100% false. -
Bob Lacatena at 07:05 AM on 27 June 2011Uncertainty in Global Warming Science
21, Camburn,Your 1st description of a driver is correct.
Then you must accept the premise that simply because CO2 has not often or definitively initiated climate change in the past, because it primarily has acted as a (critically important) feedback, this does not mean that CO2 cannot also act as a driver (using your definition for the term). To put it another way, there are very few natural mechanisms -- quite possibly none -- that can pump this much CO2 into the atmosphere in this short of a time frame. But this in no way changes the extreme radiative and climate related properties of concentrations of CO2, so one cannot claim to understand the underlying physics without also recognizing that, whether or not it has happened before, the change in CO2 that we ourselves are initiating in the atmosphere can most certainly have the same climate impact that it has in the past, which is to change the global mean temperature by 3˚C or more for every doubling of CO2. Do you refute this? -
okatiniko at 07:00 AM on 27 June 2011The false, the confused and the mendacious: how the media gets it wrong on climate change
"The changes are rapid and significant, and the implications for our civilisation may be dire. The chance of these statements being wrong is vanishingly small." the chance that the statement "the implications may be dire" is wrong is exactly zero, since "may be" can not be false. But the chance that the implications won't be actually dire is not vanishingly small, of course. -
Bob Lacatena at 06:57 AM on 27 June 2011Uncertainty in Global Warming Science
21, Camburn,I understand the physics very well concerning co2. IF co2 was the only greenhouse gas it would be a slam dunk. It isn't.
This statement shows that you do not, in fact, understand the physics at all. The fact that CO2 is not the only greenhouse gas is irrelevant. That you do not understand this is the proof that you do not understand the physics. -
Bob Lacatena at 06:56 AM on 27 June 2011Uncertainty in Global Warming Science
25, Camburn, You appear to be purposely missing the point. The focus is not what the alternative to fossil fuels is, the focus is that there is a huge problem that needs to be addressed... solutions flow from considering the problem, not the other way around. -
Camburn at 06:47 AM on 27 June 2011Uncertainty in Global Warming Science
Ok......let's try it this way. To address AGW, this site promotes the diminished use of fossil fuels as energy sources. And the alternative to fossil fuels are? -
Utahn at 06:33 AM on 27 June 2011Uncertainty in Global Warming Science
Camburn: " This site is using AGW as a tool to promote alternative energy. So to say no one is a bit deceptive?" Isn't your statement more than "a bit" deceptive? Maybe I misunderstood it? Could you clarify? -
mclamb6 at 06:30 AM on 27 June 2011Uncertainty in Global Warming Science
Camburn @ 21: "This site is using AGW as a tool to promote alternative energy..." This is quite simply untrue. The implication is that John Cook (and others on this site) began with the premise "I want to see widespread use of alternative, renewable energy sources" and from there, worked backwards to develop justifications as to why alternative energy is preferable. The exact opposit is occurring--the realities of anthropogenic climate change require that we address CO2 emissions and energy infrastructure. Therefore, it is necessary to research and develop alternative energy sources to put the breaks on global warming. -
Camburn at 06:18 AM on 27 June 2011Uncertainty in Global Warming Science
A confirmation of the above post concerning solar. What this shows us is that proxy reconstructions of past solar behavior based on the known at the time are prob flawed. Dr. Svalgaard had a paper recently, which I have posted on the solar link, that showed variation in TSI, even during the MM was neglible. When his results are incorporated into todays GCM's, the hindcast ability deteriorates. This is my point that there is a lot that we don't know, as it is obvious to all I would think. Dr. Svalgaard -
Norman at 06:14 AM on 27 June 2011Linking Extreme Weather and Global Warming
KR, I totally agree with your one point concern. I would love to find a data source for the entire US to compare snow and temp to a larger region. The only information I can find on a larger scale is snow cover for North America. This will not help determine snow amount vs temperature debate as you can have large coverage but shallow depth. I need snow accumulation data. I could try different cities and build a region. The NOAA data does cover a larger area than Omaha. Lincoln and Norfolk are also part of the data set. Still a small region and like you point out, subject to local factors. -
Camburn at 06:08 AM on 27 June 2011Uncertainty in Global Warming Science
Glad to see good responses: 1. This site is using AGW as a tool to promote alternative energy. So to say no one is a bit deceptive? 2. I understand the physics very well concerning co2. IF co2 was the only greenhouse gas it would be a slam dunk. It isn't. 3. Sphaerica: Your 1st description of a driver is correct. 4. KR: I can only suggest that you do a 100 year mean....then look at temperature within that mean. 5. Mysterious unkown cycles. Ya betcha. There are hints of these that are being uncovered. That is why they are uknown, and mysterious. 6. Our understanding of the co2 effect on climate is not really that good. That is why there is such a variation in the outcomes of climate models. -
okatiniko at 05:46 AM on 27 June 2011Sea Level Hockey Stick
les : "I've worked with a good veriety of models and data which include noise of various flavours " Obviously you didn't work with reconstruction of past data with a modern calibration period, since you don't seem to understand the debate. When I say "there is a controversy" , it's only factual: there is a controversy because different specialists disagree and argue in peer-reviewed papers. This is a fact. You can't use the "peer-reviewed" arguments when it goes in your direction and let it down when it goes elsewhere.Now obviously your decision about who is right and wrong is governed by your prejudices , and I'm sure you're totally unable to explain why exactly the lasso method is worse than another one - so please be modest and recognize that the subject is still unclear and discussed in the literature, as many others in science. Now I believe the hockey stick is real, since the Earth has warmed since the end of LIA, this is not discussed. But please give me ONE reference of any proxy reconstruction when the hockey "blade" starts in the 70's, after the anthropogenic component is supposed to become dominant, and not at the beginning of the century when obviously the CO2 warming was still insignificant. Show me only one. -
Bob Lacatena at 05:33 AM on 27 June 2011Uncertainty in Global Warming Science
19, KR, Oh. I thought you were trying to talk about people who sling Mysterious Unfounded Denial (MUD). But that's something else entirely. -
KR at 05:30 AM on 27 June 2011Uncertainty in Global Warming Science
Sorry, in my previous post the acronym for 'Mysterious Unknown Effects' should be 'MUE', not 'MUF'. 'MUF' is short for the related 'Mysterious Unknown Force'(s), which I sometimes suspect are implicated in the weed levels of my shrubbery... Both MUE's and MUF's have the same explanatory value - none. -
Bob Lacatena at 05:27 AM on 27 June 2011Uncertainty in Global Warming Science
13, Camburn,Our understanding of the effects of solar on climate is only beginning to be understood.
You are grossly overstating an obvious truth. That we have more to learn about how the sun operates, or how the sun interacts with the earth's climate, does not in any way diminish the truth and strength of our understanding of the influence of CO2 on climate, or our ability to predict the rather dire consequences of ignoring that rather solid knowledge. -
KR at 05:23 AM on 27 June 2011Uncertainty in Global Warming Science
Camburn "Using a short term anomoly of only 20 or 30 years does not prove anything is happening climatically. 20 or 30 years can easily be a cycle, rather than a change." I find your position fascinating, Camburn. This article by HFranzen could well be written about you. We know the physics of CO2 and IR absorption, and have excellent measures of it's increase. Not to mention innumerable sets of evidence for considerable warming over and above natural forcings. We have no evidence for century scale 'variations' (Tamino has a lovely post on this, entitled Mathtubation), negative evidence (as in, disproof) about correlations of magnetic and cosmic ray effects (not to mention no solid physical hypotheses about how they would affect climate). And we have the observed noise and variation in the climate to judge that ~30 years is sufficient to accurately identify trends. 45 might be better (as that's when the standard deviation of the temperature anomaly flattens out with increasing sample duration), but 30 years is pretty solid statistically. So you combine "Type C" issues of values of long term averages with skipping over "Type A" issues in physics that show global warming is occurring due to our actions, adding in completely unsupported hypotheses about 'natural variation' and 'Mysterious Unknown Effects' (MUF's) from the sun unrelated to observed insolation. All to claim either it's not happening or it's a natural cycle - it's sometimes hard to tell which from your posts. Camburn, I would have to call your position one of 'denial'. It's certainly not science. -
Bob Lacatena at 05:23 AM on 27 June 2011Uncertainty in Global Warming Science
12, Camburn,20 or 30 years can easily be a cycle, rather than a change.
You would not say this if your understanding of the science were better. Please study more before commenting further. -
Bob Lacatena at 05:19 AM on 27 June 2011Uncertainty in Global Warming Science
11, Camburn,When one looks at the long term mean, century scale means, one understands that the current temperature is not a dramatic one.
This statement is false and unsupportable in any objective frame of reference.Where I will disagree is that from paleo studies, co2 is not what one would consider to be a prime driver of climate.
This statement is at best misleading. First, if you understand the physics, then you know that very few mechanisms are pure "drivers" of climate, so the whole phrasing of the statement is inaccurate. Almost everything that affects climate is both a driver and a feedback. Separating the two can be difficult, but is not always that relevant (in that the trigger for climate change is important for one reason, but the major feedbacks that exacerbate that change are every bit as important, if not more so). If your definition of a driver is "something that initiated" a change in climate, then you are partially right (the jury is out in those instances, such as the PETM, where CO2 may or may not have initiated climate change), but then this statement bears no relevance to our current dilemma. The fact that an intelligent race of beings has never before existed on the planet to burn the carbon that took millions of years to sequester is in no way an argument that it cannot be of consequence today. If your definition of a driver is "something that is a major and critical factor in climate change, regardless of the initial forcing" then you are dead wrong. CO2 concentrations are very definitively and demonstrably related to climate change throughout the past, I believe completely without exception, and to claim otherwise is to live in convenient denial with a very poor understanding of past climate change on earth....the use of AGW to try and incorporate change is a poor choice.
This is where you run completely off the rails. No one is "choosing" to "use" AGW to try to and incorporate change. This particular conspiracy fantasy is both ridiculous and unsupportable. At what point did some group of people get together and decide to do this? Have you been at any of our monthly meetings where we discuss our strategies for how to trick the world into changing their energy infrastructure, for some other twisted and nefarious reason that has nothing whatsoever to do with climate change itself? Have you heard anyone say that they don't actually believe in climate change, but it's a convenient excuse to put the oil companies out of business a little early? Do you see how absurd that position is? Based on your responses, you do not understand or accept Dr. Franzen's Type A science... the simple prospect that climate change can and is happening, based on an indisputable understanding of the physics involved. Your denial is not in the degree of warming, but in the actual foundations of the proposition of climate change. Given this, as Dr. Franzen stated (somewhat differently) in his closing paragraph, discussion of any aspect beyond the basics of the science is fruitless with you, because you do not accept the foundations of the science. This is the wrong thread for you to visit. You should be trying to educate yourself on the more basic aspects of the science. Since you yourself have identified your acceptance of paleo studies as a blocking point, and yet you have seemingly misunderstood the relevance of those studies, I would suggest that you turn your attention away from that to other things. Develop a more firm understanding of the radiative physics behind greenhouse gas theory. Understand why it would be bizarre if the planet were not warming. From there, you can look in detail at each of the different periods in earth's history, and how CO2 played an important role in every climate change event in the past billion years. From there, you will be ready to move forward and begin to make value judgments such as whether or not the current rate of warming is alarming, or whether the dangers of anthropogenic climate change are an important and urgent factor in motivating people to more aggressively do what, as you have pointed out, really must be done anyway. Until you have thoroughly filled those to failings in your knowledge (the foundations of the science, and the facts behind all past climate change on the planet), you are not equipped to discuss any other issues. -
Kevin C at 05:18 AM on 27 June 2011Uncertainty in Global Warming Science
Hfranzen: I am very interested in your categorization of types of science. It seems to me that there is something important here which we should communicate better. In particular, there are theories which are proven through many different experiments and many other testable theories build on them. Some are the basis for everyday technology. Other theories are so specific as to have been untested beyond a single experiment. This must be useful in determining confidence in a particular result. (This of course relates to Popper's idea of a severe test, although quantifying confidence in a theory remains almost impossible owing to the challenge of identifying whether a test is severe and independent of other tests. Even in Bayesian hypothesis testing you are limited by the coverage of your alternate hypotheses.) Having sparked with your article my interest in this area, I want to look into it further. My questions are as follows: Is your classification rooted in any standard work in history or philosophy of science? Do you know of any previous efforts to classify types of science like this? -
John Hartz at 05:11 AM on 27 June 2011The false, the confused and the mendacious: how the media gets it wrong on climate change
The media is also taken to task by Al Gore in "Climate of Denial" published in Rolling Stone Magazine. -
Camburn at 04:52 AM on 27 June 2011Uncertainty in Global Warming Science
One thing that is important to understand is what we do not know, and what is changing. Our understanding of the effects of solar on climate is only beginning to be understood. An example of recent changes is in this paper. A measurement that has been used has been found not to apply to the current state of the sun. Important reserach, the L&P effect, etc. magnetic effects, just a few items. F10 Flux -
Camburn at 04:47 AM on 27 June 2011Uncertainty in Global Warming Science
KR: Using a short term anomoly of only 20 or 30 years does not prove anything is happening climatically. 20 or 30 years can easily be a cycle, rather than a change. The long term mean, century mean, is a valuable tool to detect discernable change. -
Camburn at 04:33 AM on 27 June 2011Uncertainty in Global Warming Science
Sphaerica: My comment is an observation, not meant in an insulting way. 1. I agree 100%. Global warming is happening. The rate that it happening on a climatic scale is not actually alarming. When one looks at the long term mean, century scale means, one understands that the current temperature is not a dramatic one. 2. We all know that co2 is rising. 3. Where I will disagree is that from paleo studies, co2 is not what one would consider to be a prime driver of climate. 4. I am all for slowing the use of fossil fuels. They are a finite resource. The easy mining/drilling etc spots are becoming less and less. The economic shock of when, which in my opinion is happening now, of the increased costs of fossil fuels will continue the trend of economic uncertainty which is not good for mankind as a whole. 5. From a purely economic understanding, it is very easy to show that the cost of renewables, hydro, nuclear, geo thermal are practical and necessary in the long run. These are certainties. In my humble opinion, the use of AGW to try and incorporate change is a poor choice. The uncertainties of AGW allow and encourage resistance to change. A by product of the economic certainties in relation to the diminishing fossil fuel availability will drive emission of co2 down. That is a good thing, and an easy sell isn't it? Everyone is familiar with economic activity. Not everyone is familiar with climate. Go where the stregth of the data is, use that stregth. -
neilrieck at 03:48 AM on 27 June 2011A journey into the weird and wacky world of climate change denial
People can engage in conspiracy theories -OR- just listen to the facts as expressed by the experts. Here is a 10-minute clip of NASA's James Hansen on the David Letterman show: James Hansen - Late Show With David Letterman but if you require more details then watch this 53-minute gem at TVO.org Dr. James Hansen on Human-Made Climate Change -
Humanracesurvival at 03:46 AM on 27 June 2011A journey into the weird and wacky world of climate change denial
You can vote this now @ reddit http://www.reddit.com/r/politics/comments/i9nl5/a_journey_into_the_weird_and_wacky_world_of/ -
Bob Lacatena at 03:34 AM on 27 June 2011Uncertainty in Global Warming Science
7, Camburn, FYI, the insulting implication that I was not talking logically prior to this was duly noted, not appreciated, and unnecessary. -
KR at 03:32 AM on 27 June 2011Uncertainty in Global Warming Science
Camburn Just keep in mind - not being able to ascertain exact numbers for increasing energy in the climate system does not mean you can assert that we don't have increasing energy in the climate system. We have far, far too much evidence pointing to warming to conclude that. It (global warming) is happening, identifying tight bounds on the trends and rates takes 20-30 years of data to extract from the noise, internal variability, and measurement error - and likewise, 20-30 years of data would be required to establish that things had changed and that we were cooling. But given the physics (type A science, as discussed above), that's just not going to happen unless we decrease the levels of CO2 in the air. -
Bob Lacatena at 03:31 AM on 27 June 2011Uncertainty in Global Warming Science
7, Camburn, Please read Dr. Franzen's post. It would do you good. Also, when you say "it is not all," this implies that you yourself do recognize that there are things that are clear, cut and dried (and in fact there are many). Would you care to itemize the aspects of climate science that you do not dispute? Could you list the elements of climate science that are beyond debate and point to a serious issue that cannot be ignored simply because some people like to find and harp on the rather meager areas of doubt and quantification that, in the larger scheme of things, do not really greatly affect our need to very soon take moderate but effective action, but which can unfortunately be exaggerated to give that appearance? -
Camburn at 03:25 AM on 27 June 2011Uncertainty in Global Warming Science
Sphaerica: You are finally talking logically. Thank you. It is not all clear, cut and dried. -
KR at 03:21 AM on 27 June 2011Linking Extreme Weather and Global Warming
Norman - "There have been several posts on the topic that warmer weather will increase snowfall amounts. I am doing a limited test of this conclusion to determine if it is a valid conclusion based upon available evidence. I am picking one location (Omaha, Nebraska) as the test spot." You're choosing a single location to identify a change in global frequency of occurrence? That is beyond bad science, Norman - it's completely unreasonable. Global data, such as the Munich Re data posted earlier, is indicative of changes. Single site reviews (given regional weather variability, which itself may be induced by global warming) is not. I could not accept that as useful data - regardless of the results. -
Bob Lacatena at 02:41 AM on 27 June 2011Uncertainty in Global Warming Science
5, Badgersouth, Very simply, in reference to Ken's specific area of interest (system imbalance in W/m2), this is going to depend on a lot of factors, including the functioning of every mechanism involved in energy transfer (radiation, GHGs, latent heat, evaporation, albedo, clouds, insolation, etc.). It is going to be impacted by all sorts of periodic but variable and unpredictable events (ENSO, PDO, etc.). Basically, everything that makes global temperatures vary from day to day, week to week, and year to year is also going to make the energy imbalance vary. For example, my guess would be that in a year when the global mean temperature appears to be lower, the energy imbalance is liable to be greater (since a cooler body will radiate less). At the same time, measuring the imbalance is difficult, and so a variety of different methods and efforts are needed to do so. Actually, a fleet of satellites, had they been launched when needed a decade ago, might have helped to close that loop and accurately measure what we need to know, but that never happened. Not nearly enough was put into new satellites, many were lost at launch, and one (the Deep Space Climate Observatory) was in fact the only satellite in history ever to be built by NASA (at a cost of $100 million) and never launched. To this day it sits in a warehouse, even though arrangements were made to launch it for free (it's built, the launch would be free, but NASA said that it was too much of a danger to the satellite, so instead it sits uselessly in a warehouse). There are so many factors and variables, and it is so difficult to measure everything involved accurately, that to expect to balance the ledger and to so accurately measure the "known increasing energy input" is unrealistic. All we can say for certain is that it is unquestionably increasing, we can bound that increase, and we know that if it is increasing, as is expected by our understanding of the physics, then the planet must be warming. This is what I mean when I say that the system is too chaotic, and there is too much noise, to expect to arrive at a single, unchanging value for the energy imbalance in the system, or to measure even a changing value given the tools that we have deployed today. -
Michele at 01:55 AM on 27 June 2011The Planetary Greenhouse Engine Revisited
It is worth to point up the cooling/heating places are large isothermal regions which show with extreme evidence the fact that the radiative exchange of energy between the atmosphere and the external space is not at all easy. The transformation heat->photons and vice versa requires the cohesive contribution of a very an very large amount of gas, so it cannot occur within a little rising particle or if there is present also the sole temperature gradient. The emitting/absorbing region has to be isothermal because the transformation above behaves as a phase transition in the same way than the ionization/deionization. -
Tom Curtis at 01:26 AM on 27 June 2011CO2 has a short residence time
Eric (skeptic) @98: 1) You where correct that I was ignoring the uptake of CO2 by the land surface/biosphere, which accounts for approximately half of annual draw down of CO2 from the atmosphere. For the reasons given in 97, it is likely that much of that process depends on a rapid establishment of equilibrium on a time scale of from one year to at most a decade. Most likely, in fact, it involves several rapid processes that, but probably also a few slow processes which account for only a small part of the annual effect. In that way, the land would behave similarly to the water in which one rapid, and three slow processes are involved. In that event, the rapid processes would be governed by annual emissions, but the slow processes would be governed by cumulative excess of CO2 (see 3 below). But I don't know enough about the processes involved to make more than these theoretical points. 2) Archer and Brovkin write:"A typical ocean surface mixed layer is 100 m deep, and it will equilibrate with the atmosphere (that is, take up as much CO2 as it will) in about a year. But most of the volume of the ocean is beneath the surface layer, and to get there, fossil fuel CO2 has to wait for the overturning circulation of the ocean, which takes centuries or a millennium. Of the 9 Gton C/year carbon release from fossil fuels and deforestation from the year 2000 to 2006, 5 Gton C/year is taken up naturally, half by the ocean and half into the terrestrial biosphere (Canadell et al. 2007). One might conclude from these numbers that the uptake time for CO2 must be only a few years, but this would be a misconception. The rate of natural CO2 uptake in any given year is not determined by the CO2 emissions in that particular year, but rather by the excess of CO2 in the atmosphere that has accumulated over the past century. The lifetime of the CO2 can be gauged by the amount of time that the CO2 has been waiting, which is longer than just a few years. The models find that CO2 peak will come and fade on a time scale of a few centuries to millennia."
(My emphasis) Clearly from the emphasised sentence, Archer and Brovkin agree with my claim that:"[W]hat the environment does is restore equilibrium between the partial pressure of CO2 in the atmosphere and the partial pressure of CO2 in the upper layer of the ocean. That is a rapid process, ..."
There remains the second quoted paragraph (ie, the paragraph you quoted) which could be interpreted to agree with you. Such an interpretation would be a misinterpretation, however, for by 'uptake' Archer and Brovkin mean the process whereby equilibrium is established between the deep ocean and the ocean surface/atmosphere. Because of the slow transfer of CO2 from surface to the deep ocean, the rate at which equilibrium is established with the deep ocean is indeed governed by the cumulative excess above equilibrium levels accumulated by the surface of the ocean, and the atmosphere. (Because the surface and atmosphere equilibriate over a very short time span, Archer and Brovkin, they mention only the atmosphere.) In contrast, establishing equilibrium between ocean surface and the atmosphere is governed annual emissions. On your interpretation of Archer and Brovkin, they flat out contradict themselves within two paragraphs by claiming that Now you may require something more than the fact that on your interpretation of Archer and Brovkin that the ocean surface and atmosphere will equilibrate within a year, but that 'uptake' will "come and fade on a time scale of a few centuries to millennia". That fact should be enough to see that my interpretation of Archer and Brovkin is correct. But to drive home the point, we see in an earlier passage that they definitely use 'uptake' to refer to the slow, centennial scale process of equilibrating between ocean surface/atmosphere and the deep ocean rather than the rapid process of equilibrating between ocean surface and atmosphere: I will comment on the 7 year mean as a means of excluding the large amount of noise. Clearly both plots A and C have a number of small excursions from a constant value, no doubt attributable to fluctuations in global temperature and/or ENSO. Both also have a large excursion in the early 90's, no doubt attributable to the rapid cooling consequent on the major volcano at that time (Pinatubo?). But the plot of the draw down of CO2 against cumulative change in CO2 concentration shows two additional large excursions, one at the start, and one at the end, which are not present in the plot against a constant fraction of annual emissions.
Clearly then, the available evidence supports my (and Archer and Brovkin's) understanding over yours. While I doubt the evidence is conclusive, given the noisy nature of the data, none-the-less your position means you are arguing against both the evidence, against straightforward theoretical considerations, and against expert opinion. In that position, I would have very little confidence of the correctness of my position.
5) Finally, you quote the seasonal variation in CO2 concentrations as a disproof of my position. However, it is plain that the seasonal variations have a half cycle significantly less than the typical time to reach equilibrium with the surface. Therefore, while we would expect interactions with the ocean to dampen, we would not expect them to eliminate the cycle. Further, given that about a quarter of the annual emissions are absorbed by land, which violently fluctuates in temperature, moisture, and coverage over the course of the seasons, the land based processes may dampen, be neutral with, or amplify such a cycle. Given this, and given the lack of knowledge regarding the land based processes, and given that you cannot quantify the actual amount of CO2 emitted by decay of biota over Autumn and Winter so that we cannot predict the size of the cycle except by measuring it; we simply do not have enough information to run the argument you are trying to run.
That does not mean I have refuted this argument. But it does mean you have not provided a reason to disagree with the balance of evidence which is strongly against your position.
I will comment on the 7 year mean as a means of excluding the large amount of noise. Clearly both plots A and C have a number of small excursions from a constant value, no doubt attributable to fluctuations in global temperature and/or ENSO. Both also have a large excursion in the early 90's, no doubt attributable to the rapid cooling consequent on the major volcano at that time (Pinatubo?). But the plot of the draw down of CO2 against cumulative change in CO2 concentration shows two additional large excursions, one at the start, and one at the end, which are not present in the plot against a constant fraction of annual emissions.
Clearly then, the available evidence supports my (and Archer and Brovkin's) understanding over yours. While I doubt the evidence is conclusive, given the noisy nature of the data, none-the-less your position means you are arguing against both the evidence, against straightforward theoretical considerations, and against expert opinion. In that position, I would have very little confidence of the correctness of my position.
5) Finally, you quote the seasonal variation in CO2 concentrations as a disproof of my position. However, it is plain that the seasonal variations have a half cycle significantly less than the typical time to reach equilibrium with the surface. Therefore, while we would expect interactions with the ocean to dampen, we would not expect them to eliminate the cycle. Further, given that about a quarter of the annual emissions are absorbed by land, which violently fluctuates in temperature, moisture, and coverage over the course of the seasons, the land based processes may dampen, be neutral with, or amplify such a cycle. Given this, and given the lack of knowledge regarding the land based processes, and given that you cannot quantify the actual amount of CO2 emitted by decay of biota over Autumn and Winter so that we cannot predict the size of the cycle except by measuring it; we simply do not have enough information to run the argument you are trying to run.
That does not mean I have refuted this argument. But it does mean you have not provided a reason to disagree with the balance of evidence which is strongly against your position.
-
John Hartz at 01:13 AM on 27 June 2011Sea Level Hockey Stick
"Sea Level Study Leads to Divisions" is an in-depth review of the Kemp et al paper posted on Spiegel Online International. A number of prominent scientists, including Mojib Latif, were interviewed and are quoted. -
John Hartz at 00:59 AM on 27 June 2011Rogues or respectable? How climate change sceptics spread doubt and denial
The International Climate Denial Spin Machine has now set-up shop in India... New Delhi/Bangalore, June 18: Several environmental groups, including Climate Revolution, have criticised the Delhi-based Liberty Institute, the Institution of Engineers, Karnataka state Centre (IEI-KSC) and the Karnataka Environment Research Foundation (KERF) for claiming that passive smoking isn't harmful. They have also questioned as to why these three institutions are now being employed by oil companies to question climate change. Source: "Climate change deniers spreading misinformation: Environmental groups", DailyIndia.com, June 18, 2011
Prev 1641 1642 1643 1644 1645 1646 1647 1648 1649 1650 1651 1652 1653 1654 1655 1656 Next


