


 Arguments


Recent Comments
Prev 1663 1664 1665 1666 1667 1668 1669 1670 1671 1672 1673 1674 1675 1676 1677 1678 Next
Comments 83501 to 83550:
-
Stevo at 14:48 PM on 17 June 2011Who's your expert? The difference between peer review and rhetoric
Comments to this article on The Conversation are going quite well at the moment. Those opposed to the peer review process are not aquitting themselves well. Makes for a pleasant change. -
Tom Curtis at 14:42 PM on 17 June 2011Who's your expert? The difference between peer review and rhetoric
One nice thing about the peer review system is that in, in order to be published you just have to convince three to five people who have the knowledge and skills to assess your argument that your argument is worth considering. You don't have to convince them that you are right; only that the case you make is cogent enough to be worth further thought. A second nice thing is that if you can't convince the first group, you can always try again at another journal. Or improve your argument and/or evidence and try again at the same journal. That means that if your argument really is worth considering, it is highly unlikely to not be published. Conversely, if you can't get your paper through the peer review system, that means from a wide selection of people well informed enough, and skilled enough to understand your argument, you can't even get a few to agree that your argument is even worth considering. Worth thinking about. -
Paul Magnus at 14:40 PM on 17 June 2011Who's your expert? The difference between peer review and rhetoric
Mags like Forbes need an ass kicking... http://blogs.forbes.com/patrickmichaels/2011/06/16/peer-review-and-pal-review-in-climate-science/ -
BillyJoe at 14:22 PM on 17 June 2011Who's your expert? The difference between peer review and rhetoric
Sorry, this is off-topic, but... Can anyone link me to an article that discusses why ground based temperature measuring stations have been disappearing. (-Snip-) -
Patrick 027 at 13:42 PM on 17 June 2011The Planetary Greenhouse Engine Revisited
Re 11 Michele - part of the problem, I think, is that you are using imprecise concepts, or at least imprecise language, which may lead you to confusion. First, the emission from the surface is not changed (in any simple direct way) by atmospheric radiation. What is changed is the amount of that radiation which reaches space, and the amount and distribution of absorption of that radiation by the atmosphere, and the amount of radiation from the atmosphere absorbed by the surface. Your first equation, εTs^4 + Tt^4 = Te^4, is simply incorrect. Even as an extreme simplication (of a grey gas isothermal atmosphere at temperature Tt overlaying a blackbody surface), the equation should be εTs^4 + (1-ε)*Tt^4 = Te^4 - but then the meaning of ε is 1 - atmospheric absorptivity, which is equal to atmospheric emissivity (the effective value over all directions, which I think can be used for an isothermal atmosphere). Really it would make more sense to use an ε for the atmosphere, and then you get (1-ε)*Ts^4 + ε*Tt^4 = Te^4. This is correct for this very simple case. But the atmosphere is not a single isothermal layer. It is helpful to consider emission weighting functions. You described the tropopause and mesopause as if they are surfaces that collect heat from the rest of the atmosphere and radiate to space. This is only partially true in a sense. The colder **layers** and surfaces (applicable to low-level inversions) will emit less than they absorb from warmer **layers** and surfaces. But depending on optical properties, the entire atmosphere can be emmitting radiation to space; it happens that, assuming well-mixed gases and setting aside pressure and doppler broadennning and temperature-dependent line strength, the fraction of radiation emitted upward that escapes to space increases going upward, toward 100 % at the top of the atmosphere. Rather than going over the details of fluxes that you find at any level, consider emission weighting functions (EWF for short here). For a radiation of a given direction, polarization, and frequency, the distribution of where that radiation is absorbed is equal to the EWF for radiation of the same type coming back from that direction at the same point. EWF is a density distribution over space, and taking the product of that with the Planck function at each location and integrating over volume (well, over a line if there's no scattering), gives the intensity of the radiation coming from a given direction; the temperature for which the Planck function equals this value is the brightness temperature of that radiation, and if it weren't for the nonlinearity of the Planck function, it would be equal to the EWF-weighted average temperature; if not for the (potential for) nonlinearity in both the Planck function and the temperature profile, it would be the temperature at the centroid of the EWF. Hence the brightness temperature may be equal to the temperature somewhere within the EWF (this must be true if the EWF and temperature vary continuously over space), and the location where this temperature occurs may be thought of as an effective emitting level (note that this varies with direction, so for the whole flux you have to have a weighted average of EWF's for each direction, etc.) The effective emitting level of radiation reaching space won't necessarily or generally be at the tropopause - even if it were, this is only a representative level - radiation is being emitted to space from a whole layer, potentially extending down to the surface. Regarding why parts of the atmosphere can be colder than Te, consider a case of pure radiative equilibrium with a grey gas. For a sufficiently thin layer at the top of the atmosphere (TOA), the emissivity and absorptivity of that layer can be approximated as zero in their effect on the flux from below, but the layer's temperature is still determined by those vary small quantities. It absorbs some fraction, a, of radiation from below, which must be approximately sigma*Te^4, and in radiative equilibrium, assuming no other heat sources, it must emit a*sigma*Ttoa^4 (Ttoa is the temperature at TOA) both upward and downward. Thus Ttoa^4 must be half of Te^4 (note that if space were radiating downward as if a blackbody at Te^4, then Ttoa = Te. But space's brightness temperature can generally be approximated as zero). This is the temperature of the skin layer. Temperature generally varies continuously through an atmosphere so T must drop below Te at some point below. For atmospheric absorption which is not grey, the formula for Ttoa will be different but at least for well-mixed greenhouse gases, it will still be less than Te. With solar heating, the equilibrium T in the upper atmosphere may be higher than Te, but if solar heating is not sufficient to prevent it, layers colder than Te may still be found as well. The ozone layer is responsible for the temperature maximum at the stratopause, and absorption of higher-frequency solar radiation is responsible for the thermosphere, but in between those regions and between the upper stratosphere and the lower troposphere, T can be below Te because their is sufficient transparency above such that not enough radiation is absorbed from above to prevent it. Convection within the troposphere doesn't all go to the tropopause; going higher up, the convective heat flux from the surface declines. This balances a net radiant cooling (including any direct solar heating of the air). It is theoretically possible to have a troposphere in which some layers have no net radiant cooling, in which the convective heat flux, on average in equilibrium, would be constant. -
jyyh at 12:39 PM on 17 June 2011CO2 Currently Rising Faster Than The PETM Extinction Event
PETM "explained" at http://erimaassa.blogspot.com/2011/06/already-done.html -
Rob Painting at 12:00 PM on 17 June 2011CO2 Currently Rising Faster Than The PETM Extinction Event
Jerryd- a hyper-link to the full Dickens focus article is provided under Figure 1. Are you he? -
jerryd at 11:32 AM on 17 June 2011CO2 Currently Rising Faster Than The PETM Extinction Event
Hej, I guess my first thought is ... wow ... it's great to see people interested in the PETM. It's a truly wonderful topic of current scientific interest, in part because we still cannot explain the event. How can Earth's surface warm and receive massive amounts of carbon in a geological instant 55 million years ago? The event was discovered 20 years ago; a wide array of data across the event shows basic signatures predicted by climate models for our future; it defies a satisfactory explanation within any accepted model for global climate or carbon cycling. Welcome to a really interesting puzzle! Thought might be good to pass along the text to Figure 1 (and the background to the PETM): http://www.cseg.ca/publications/recorder/2009/02feb.cfm Jerry -
Stevo at 11:31 AM on 17 June 2011Our effect on the earth is real: how we’re geo-engineering the planet
scaddenp - As a historian (my qualification rather than my job) I'm on board with the concept of competition for resources being an ultimate cause of conflict. Now I just need to look for some examples of resource crises where there was no neighbouring culture available to sieze those resources from by means of warfare - pre Columbian South America looks like a good place to start. So too do the great migrations that led to the fall of the Roman Empire. Thanks again for your help. -
scaddenp at 11:05 AM on 17 June 2011Our effect on the earth is real: how we’re geo-engineering the planet
Stevo - just look for anytime/where you had a population crash. Some of these will be disease. But others will be either resource-exhaustion or resource change (especially water). Look at ultimate causes, not proximate causes (a favourite denier tactic in many areas). Better technology has given us much improved adaptability but there is no magic in the universe which guarantees every problem is solvable, especially within a specific time frame. -
Tom Curtis at 11:04 AM on 17 June 2011How would a Solar Grand Minimum affect global warming?
Ken Lambert @40, an elevated TSI over a specific rate will only result in increasing accumulated energy if there is no elevation of the OLR to compensate. As an increased surface temperature will increase OLR all else being equal, simply integrating albedo adjusted TSI less a constant will not even approximate to the increase in heat energy in the Earth's climate system. That is, it will not do so unless some other factor is decreasing OLR relative to surface temperature at an appropriate rate. Would you care to make a suggestion as to what that other factor might be? -
Stevo at 10:50 AM on 17 June 2011Our effect on the earth is real: how we’re geo-engineering the planet
Spherica @14 Nicely put. Thankyou for your help. scaddenp @15 Thanks also. Easter Island is an excellent example. I'll start looking for some more. -
Albatross at 10:32 AM on 17 June 2011How would a Solar Grand Minimum affect global warming?
Adelady @38, Thanks for that link. Better, but not persuasive enough IMHO. The comment thread is depressing, D-K and conspiracy central, although some brave souls are standing up for the science. -
Alex C at 10:22 AM on 17 June 2011How would a Solar Grand Minimum affect global warming?
Ken Lambert #40, But what would that tell us? The energy available and the energy that actually accumulates are different matters, and if you want to argue that increased solar output is at all responsible for the temperature increase we have seen over the past few decades, then you must show both that the difference between the power-in and power-out curves is increasing with time, and that the power-in curve integrates to be a power above the temperature trend (as a power-out curve that decreases with time will also lead to an increasing integral difference). -
Ken Lambert at 10:11 AM on 17 June 2011How would a Solar Grand Minimum affect global warming?
Angliss #29 "Power is energy integrated over time (1 J/s = 1 W)." Sorry Angliss - you have got that back to front. Energy is Power integrated over time. Hence my point that we should look at the ""Excess"" TSI above the baseline of say 1365.5 integrated over time to get the energy available to warm the Earth system. KR #17 Of course we are talking of TSI 'differences' here KR. The outgoing OLR will rise with S-B to restore equilibrium. The point is that a constant elevated TSI above an 'equilibrium' value will equate to a linearly increasing amount of energy as measured by the area under the forcing curve. -
Rob Painting at 10:08 AM on 17 June 2011CO2 Currently Rising Faster Than The PETM Extinction Event
DB @ 1 - an oversight, now fixed. Thanks. -
scaddenp at 10:07 AM on 17 June 2011Our effect on the earth is real: how we’re geo-engineering the planet
The argument against Malthus also fails to take into account that we have NOT always been able to tech our way of resource limitations and thus have suffered population crashes. (Easter Is immediately springs to mind - no substitute for trees). -
Bob Lacatena at 10:03 AM on 17 June 2011Our effect on the earth is real: how we’re geo-engineering the planet
13, Stevo,The argument against Malthus has been that we have never run out of any resource because technological improvements have reduced the costs of extraction or that alternative technologies have removed the need for certain resources.
This is an interesting observation, but it fails on two counts. The first is the bulk of the world really has not been thoroughly industrialized until well after the Second World War, say for the past 50+ years. That's hardly a long enough time to claim "we've always done it before." Secondly, the world population is growing, and more importantly the percentage of the world population living an "industrialized lifestyle" is growing, even as the resources themselves are shrinking. So the demand pressures are increasing, the resources themselves are dwindling across the board, and the argument that we've always survived before is based on a mere blip in the history of human civilization. If anything, the history of human civilization shows that all civilizations ultimately crumble due to resources constraints, be it food, water, gold or something else. -
DaneelOlivaw at 09:45 AM on 17 June 2011How would a Solar Grand Minimum affect global warming?
John, I've made a spanish version of that graph. It may be of use: http://i.imgur.com/bBa4T.jpgResponse: Cool, have updated the post linking to it. Thanks! -
Stevo at 09:42 AM on 17 June 2011Our effect on the earth is real: how we’re geo-engineering the planet
Michael @ 11 I agree that high population requires high resource consumption and that resources are finite. The argument against Malthus has been that we have never run out of any resource because technological improvements have reduced the costs of extraction or that alternative technologies have removed the need for certain resources. (We can economically extract metal from ore bodies today that were deemed uneconomical to mine, say, 60 years ago. We no longer need to send out whaling fleets because whale oil has been replaces by fossil oil.) My question is how much longer will this hold true. The search for oil is taking us to deeper and deeper seabed well sites where extraction costs are very high and at the limits of our technical ability to drill. Last year's oil spill in the Texas Gulf showed us all how difficult and slow a response can be when things go wrong. Technologies have limits and in my work in the mineral extraction industry I'm not seeing any significant improvements in extraction technology. As for replacement technologies, here in Australia at least, there is precious little in the way of encouragement for research and development of sustainable energy. I sympathise with the scientists on this site. The science is sound. We have the knowledge to identify and fix the problems we face but getting the message across to the policy makers at the moment is extremely hard. -
Utahn at 09:41 AM on 17 June 2011Geologists and climate change denial
Garethman, you may not see this as it seems I'm always too late to "denier" discussions, but I think you have hit on something with this: "So it’s not blind faith, it’s not a religion, but our beliefs in the science and what we do about is are very much coloured by who we are." To me this gets to the heart of the issue of those who deny the science of climate change. To trigger psychological denial, a fact must threaten a core belief or value, in other words, it threatens "who we are". My question is, what are the threatened beliefs that trigger climate change denial? I have some ideas I have expressed, but what do you think? -
adelady at 09:41 AM on 17 June 2011How would a Solar Grand Minimum affect global warming?
And on a better note, the BBC has done a well-written, well-balanced piece Good to see. -
adelady at 09:26 AM on 17 June 2011Our effect on the earth is real: how we’re geo-engineering the planet
Michael - demand on resources? Depends on which resources and how you use them. One writer got me thinking. She was referring to permaculture when she pointed out that we have all the atoms/molecules we will ever have. Fertility is not about the total number of certain molecules - it's about how often we use them in any given period of time. This of course was about composting and returning 'wastes', otherwise known as nutrients, to the soil. (And a lot of the usual arguments about letting the nutrients that disappear into the sewage system become pollution rather than useful again.) Got me thinking. Much the same can be said of all resources - and landfills. Which of course finishes right back at the idea of economics and choices. Do we quarry more rock for roadbuilding or do we find a way to reuse suitable materials from building demolition? Landfills should really be run, entirely, as sorting stations once you reframe this way. It will never be perfect. But reorganising on the basis that all materials we grow, mine, quarry or make from our natural resources are intrinsically valuable will get us a lot closer to the right balance. -
Albatross at 09:24 AM on 17 June 2011How would a Solar Grand Minimum affect global warming?
Interesting to see how this story is being played out by the denial media spin machine. Apparently Lorne Gunter and Solomon (another denier of AGW) are a duo. Not to be outdone Solomon has written this garbage (note the headline)-- and they get paid to do this folks. Fortunately, Peter Sinclair has this piece. Note what the actual authors of the study say: "...contrary to some media reports, this does not mean a new Ice Age is coming, Frank Hill of the National Solar Observatory said in a telephone interview. “We have not predicted a Little Ice Age,” Hill said, speaking from an astronomical meeting in New Mexico. “We have predicted something going on with the Sun.”" Is your head spinning yet? Mine sure is. -
Charlie A at 09:24 AM on 17 June 2011Phil Jones - Warming Since 1995 is now Statistically Significant
#144 Dikran "Yes, fine, the data are autocorrellated and an OLS trend is an optimistic calculation." The head article says "One year later, we can now say that the HadCRUT warming trend since 1995 is statistically significant at the 95% CL, even including the exogenous factors." Is the statement in the head article correct? -
Chris G at 08:46 AM on 17 June 2011The greenhouse effect is real: here's why
Well, I think this isotope subthread is about worn out, but in case anyone else is still interested or comes back to it, bacteria impose their own preferences on the isotope ratio of methane, and that preference can vary under different conditions. There's a pay-wall, but the gist is in the abstract of Carbon and hydrogen isotope systematics of bacterial formation and oxidation of methane which says what scaddenp has said, with a bit more detail as to what conditions give rise to the wide ranges found. -
Michael of Brisbane at 08:22 AM on 17 June 2011Our effect on the earth is real: how we’re geo-engineering the planet
I agree wholeheartedly Adelady. It is our responsibility, and that's what I mean by saying we are unique among all life on earth. We have the responsibility and the ability to fix/manage the resources we have. But surely the more people, the more resources are required don't you think? I mean, the earth's resources are finite in that the population is increasing, as is demand on those resources, faster than the earth can recycle/replenish them. -
John Hartz at 08:16 AM on 17 June 2011CO2 Currently Rising Faster Than The PETM Extinction Event
Hooray! I finally posted a hyperlink that works! -
JosHagelaars at 08:16 AM on 17 June 2011How would a Solar Grand Minimum affect global warming?
In the comments Leif Svalgaard (#2, #13) and GCR are mentioned a couple of times (#6, #27). I came across some interesting remarks of Svalsgaard regarding the GCR theory. He does not seem to have a high opinion of this theory. http://tinyurl.com/3ss3ux2 : "Cosmic rays have not changed their trend since at least 1952 while temperatures have. The albedo [clouds] the past 10 years has not varied with the comic ray flux. So, in general, it looks to me that there is little support for the theory." On http://tinyurl.com/44bhy7z : " So, for me, there is precious little observational evidence for the GCR theory." -
John Hartz at 08:14 AM on 17 June 2011CO2 Currently Rising Faster Than The PETM Extinction Event
Serendipity at work! The July issue of Scientific America features an article by Lee R Krump... "The Last Great Global Warming" Surprising new evidence suggests the pace of the earth's most abrupt prehistoric warm-up paled in comparison to what we face today. The episode has lessons for our future. -
newcrusader at 08:10 AM on 17 June 2011CO2 Currently Rising Faster Than The PETM Extinction Event
It is very frightening, I wonder why the American media ignores this kind of information, but gladly posts the information about a possible sunspot disappearance. When one thinks we could inject the atmosphere with as much C02 and Ch4 in 100 years, as was done 56 million years ago in 20,000 years, it makes me realize how truly bankrupt this consumption driven capitalist society has become, when no one seems to see the dire situation we are in. -
adelady at 08:06 AM on 17 June 2011Our effect on the earth is real: how we’re geo-engineering the planet
Michael of Brisbane "I mean, obviously the cause, to put it simply, is overpopulation" I'm not so sure about that. Looking at that comment from The Economist, and at a Google Earth view of one island -Haiti/Dominican Republic - you can easily see that it's just as much about (ir)responsible stewardship of the land we happen to be on. In some places people have clearfelled then absolutely trashed the land they have. Others have ensured that the soil, water and trees in their area are healthy and the waste from their activities is properly used to improve the health of their surroundings rather than turn it into a festering open sewer or landfill. A smaller total population is desirable for a better balance in the biosphere generally. But we shouldn't pretend that we can't do better because of large numbers. -
Michael of Brisbane at 07:32 AM on 17 June 2011Our effect on the earth is real: how we’re geo-engineering the planet
I thoroughly enjoyed this article. Well written, informative, and a little, actually, a lot (!) worrysome! But if it's not just our emissions of C02 that's influencing the earth, then what's the solution? I mean, obviously the cause, to put it simply, is overpopulation, acheived by intelligence and, at least in part, greed. Humans have thrived since the "beginning" on the Nile delta, and especially since the industrial revolution. We are different to every other form of life on the earth, in that we have the ability to "fix" what we've done. But should we be actively reducing our population? It's a tough reality to address, but I think this whole debate comes down to just that: overpopulation. -
Anne-Marie Blackburn at 07:27 AM on 17 June 2011CO2 Currently Rising Faster Than The PETM Extinction Event
Great read, Rob. And good link, Daniel. All pretty worrying, to put it mildly. -
Andy Skuce at 07:07 AM on 17 June 2011Our effect on the earth is real: how we’re geo-engineering the planet
Thanks for that post. It was very well written. There was an article recently in the Economist on the Anthropocene that made a similar point about the magnitude of earth moved by miners and rivers:A single engineering project, the Syncrude mine in the Athabasca tar sands, involves moving 30 billion tonnes of earth—twice the amount of sediment that flows down all the rivers in the world in a year. That sediment flow itself, meanwhile, is shrinking; almost 50,000 large dams have over the past half- century cut the flow by nearly a fifth. That is one reason why the Earth’s deltas, home to hundreds of millions of people, are eroding away faster than they can be replenished.
The Economist later added this comment about a reader's letter on the article:We were also pulled up over our calculation that if you divide the Earth up “evenly among its 7 billion inhabitants, they would get almost 1 trillion tonnes each”. Marek Zreda, a resident of Tucson, believes this is misleading, because “Humans inhabit the surface only. Dividing the land area (149 million square km) by the number of people (7 billion) gives about 2 hectares for each person. Take away wasteland, which amounts to roughly half of the land area, gives approximately 1 hectare per person”. Mr Zreda can easily imagine “trashing my hectare. Give me shoes, I can do it in a decade; give me a shovel, it will take a year. And give me a tractor, I will do it in a day.”
So much for us being too puny to trash the planet. -
Bob Lacatena at 07:06 AM on 17 June 2011How would a Solar Grand Minimum affect global warming?
[Oops, the denial thermometer is at the top left of every Sks page] -
Paul Magnus at 06:56 AM on 17 June 2011CO2 Currently Rising Faster Than The PETM Extinction Event
lovely! Just lovely. -
Bob Lacatena at 06:51 AM on 17 June 2011How would a Solar Grand Minimum affect global warming?
16, Eric the Red,If a grand minumium occurred, and it was insignificant, then the role of the sun would be largely removed as a climate driver.
I'm not sure what you mean by that. The sun is clearly a climate driver... it's the energy input into the system, so notable variations in solar output will always have some effect. In a system without us mucking up CO2 levels, it would be the main and possibly only normal short term climate factor. But CO2 is going to overwhelm the sun as a climate driver in coming centuries. And there has been no impact by the sun on recent temperature increases. We don't need a solar minimum with rising temperatures to prove this. It's been proven already. [See the #2 denier argument, It's the Sun by clicking that link, or following the cute little denial thermometer at the top right of every SkS page.] My sole point is that the effect of a minimum in even marginally slowing climate change would have a very bad effect on human nature, allowing people to deny and delay even longer, while there would be no long term savings from such a minimum, because it would inevitably come to an end before all of the added CO2 has fallen out of the atmosphere. -
pbjamm at 06:29 AM on 17 June 2011How would a Solar Grand Minimum affect global warming?
Albatross@32 WOW. The lack of understanding represented in that article is staggering. Disinformer is an extremely accurate descriptor. -
Albatross at 06:21 AM on 17 June 2011How would a Solar Grand Minimum affect global warming?
And enter into the fray, a delightful and invective-filled rant by denier of AGW, Mr. Lorne Gunter at the infamous National Post newspaper. This is how "skeptical" journalists, with agendas, continue to massacre the science. "Skeptics" must be proud to have ideologues and disinformers like Gunter on their side... -
rustneversleeps at 06:04 AM on 17 June 2011Our effect on the earth is real: how we’re geo-engineering the planet
I really liked this post, thanks. In a similar vein, I thought that the visual Desdemonda Despair had up the other day was effective - Earth movement by humans and rivers.: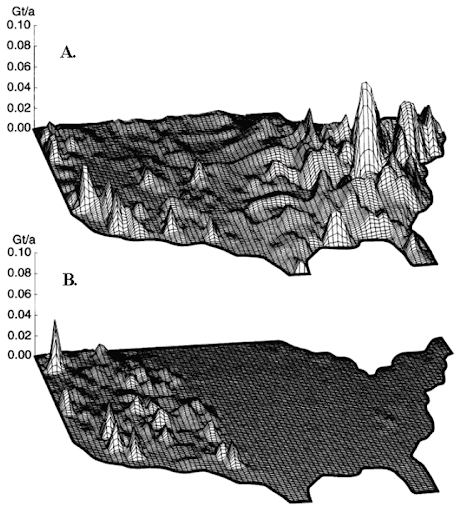 Earth movement by humans and rivers. Maps of the United States showing, by variations in peak height, the rates at which earth is moved in gigatonnes per annum in a grid cell measuring 1° (latitude and longitude) on a side, by (A) humans and (B) rivers. Hooke (1999) / EPA
Surface mining and reclamation have been identified as the dominant driver of land cover/land-use change in the central Appalachian coalfields and have produced significant changes in the region’s topography, hydrology, vegetation, groundwater, and wildlife (Townsend, et al., 2009; Loveland, et al., 2003; U.S. EPA, 2003, 2005). Coal mining in this region was identified as the greatest contributor to earth-moving activity in the United States (Hooke, 1999).
I also like this graphic, which shows that for the 77 of the 92 naturally occurring elements for which we have good data, anthropogenic flows through the earth system either outright dominate (i.e. account for more than 50% of the total flows (and implying that we are responsible for MORE than 100% of the natural flows!)) or account for between 15-50% of the total flow in 54 of 77 cases.
Earth movement by humans and rivers. Maps of the United States showing, by variations in peak height, the rates at which earth is moved in gigatonnes per annum in a grid cell measuring 1° (latitude and longitude) on a side, by (A) humans and (B) rivers. Hooke (1999) / EPA
Surface mining and reclamation have been identified as the dominant driver of land cover/land-use change in the central Appalachian coalfields and have produced significant changes in the region’s topography, hydrology, vegetation, groundwater, and wildlife (Townsend, et al., 2009; Loveland, et al., 2003; U.S. EPA, 2003, 2005). Coal mining in this region was identified as the greatest contributor to earth-moving activity in the United States (Hooke, 1999).
I also like this graphic, which shows that for the 77 of the 92 naturally occurring elements for which we have good data, anthropogenic flows through the earth system either outright dominate (i.e. account for more than 50% of the total flows (and implying that we are responsible for MORE than 100% of the natural flows!)) or account for between 15-50% of the total flow in 54 of 77 cases.
 The data for that is from ELEMENTAL CYCLES: A Status Report on Human or Natural Dominance (R.J. Klee and T.E. Graedel, 2004). The graphic itself is from MIT Prof. Tim Gutowski’s lecture notes for “The Mobilization of Materials by Humans and Natural Activities”. (Warning: 45MB pdf… but some intriguing data points, visuals, etc.)
(Interestingly, carbon falls into their category of "unperturbed" - which is the old chestnut that our emissions are only some small fraction of overall carbon cycling, but still significant because the "stock" nature of the accumulation over time. And I am somewhat surprised that nitrogen is considered "unperturbed". I thought that we were fixing more nitrogen than all the natural processes on land combined. Is the amount cycled in the oceans so vast that our contribution is still less than 15%?)
The data for that is from ELEMENTAL CYCLES: A Status Report on Human or Natural Dominance (R.J. Klee and T.E. Graedel, 2004). The graphic itself is from MIT Prof. Tim Gutowski’s lecture notes for “The Mobilization of Materials by Humans and Natural Activities”. (Warning: 45MB pdf… but some intriguing data points, visuals, etc.)
(Interestingly, carbon falls into their category of "unperturbed" - which is the old chestnut that our emissions are only some small fraction of overall carbon cycling, but still significant because the "stock" nature of the accumulation over time. And I am somewhat surprised that nitrogen is considered "unperturbed". I thought that we were fixing more nitrogen than all the natural processes on land combined. Is the amount cycled in the oceans so vast that our contribution is still less than 15%?)
-
Daniel Bailey at 05:40 AM on 17 June 2011CO2 Currently Rising Faster Than The PETM Extinction Event
Nice post, Rob! Interested readers may want to follow on over to the Wakening the Kraken thread for even more information. -
Marco at 05:19 AM on 17 June 2011Our effect on the earth is real: how we’re geo-engineering the planet
There's an interesting article on volcano emissions compared to human emissions here. Please note that this is a pdf. -
Eric the Red at 05:04 AM on 17 June 2011There's no room for a climate of denial
Agreed. -
Utahn at 04:44 AM on 17 June 2011There's no room for a climate of denial
I think the "likely" is about certainty etc... but the consenus view on how much of the warming is "likely" or "very likely" due to C02 is probably somewhat reflected in the linked graph (neglected to mention its on page 16). I think the point I was trying to make, which we appear to agree on, is that not being able to change something may foster stronger denial, but the inability to change something is neither necessary nor sufficient for denial. In other words, assuming climate science is correct in that we are causing the great majority of the current warming with C02, we can change it. So the denial doesn't really come from any belief that we can't change it, it comes from the conflicts with our core values of believing in anthropogenic climate change etc... If someone says they believe we can't change our climate for the better, I'd say that stated belief is just an expression of their denial (which is likely caused by a deeper conflict such as mentioned in my last post).. -
Eric the Red at 04:23 AM on 17 June 2011There's no room for a climate of denial
I had not really seen a value attributed to CO2, rather vague statements to the tune of "likely," "very likely," etc. I thought about your last statement, which seems to be more indifference than denial. Is it denial if someone does not really know about it or care? I would call that apathy. Denial is more of a conscious effort to repress what one actually knows to be true. -
Bob Lacatena at 04:11 AM on 17 June 2011Forecast: Permanently Hotter Summers in 20-60 years
49, Eric the Red, My understanding is that the PDO is an observed pattern within the climate system, not a forcing. Like ENSO, it does not and cannot possibly change climate, it merely affects observed global mean temperatures. PDO is not a forcing, but merely another factor (although with a vaguely repeating pattern) in observed global mean temperatures. Studying the PDO allows one to better predict weather, not climate. The net effect of the PDO over long time frames is zero. The PDO cannot, in and of itself, alter the climate of the planet in the way we are seeing. It may add noise to the observations, but nothing more. To hope that that noise is in fact the source of most or all of current warming, or even that it is exaggerating the warming that we do see, and that warming will now reverse itself is, I think, overly optimistic (and pretty much in simple denial of all of the other facts that are available). Beyond this, it doesn't matter all that much what one is seeing at any point in time, or how it is masked by the PDO or anything similar. The fact is that climate sensitivity studies point to a 3˚C increase per doubling, and the existence, non-existence, impact or non-impact of the PDO on observed temperatures is irrelevant. It won't change the end result. To your other point, observation, correlation, and inference have not become extinct, but could never exist with any value in a vacuum, by themselves. To put it another way, observation, correlation and inference without understanding and mechanics amount to nothing more than superstition. They are the incomplete precursor to science (begin speech by Theodoric, Medieval Barber of York here). The PDO is nothing more than a "good blood-letting." -
John Hartz at 04:11 AM on 17 June 2011How would a Solar Grand Minimum affect global warming?
@Albatross #7: Kudos on your repsonse to Poodle. BTW, Joe Romm is now using the word "disinformer" rather than "denier." Perhaps we should follow suite? -
John Hartz at 04:09 AM on 17 June 2011How would a Solar Grand Minimum affect global warming?
Also see Joe Romm's blog post on this topic. -
Utahn at 03:59 AM on 17 June 2011There's no room for a climate of denial
"Getting back to the idea of a consensus, is there a consensus view of what percentage of the warming was a result of increased atmospheric CO2?" I'm probably not the person to ask, but from the 2007 IPCC report summary for policymakers(which I'd say was a consensus document), it appears that the consensus is that 90+% of the current forcing is anthropogenic, the great majority of which is greenhouse gas forcing. I think you're right that there may be stronger denial when there are things we can't change, but they still have to conflict with our core belief or core understanding to foster denial. For example, I can't (truly) change the fact that I have brown hair, but I don't deny it because it doesn't bother any core belief or value I have. I think cancer bothers a core belief that many have that they will not cease to exist, and hypertension fosters denial because some people think they will never be "sick" or "need medicine". You may actually be able to change the conditions so someone survives their cancer at least, or fixes their blood pressure, but the denial is really there due to the conflict with core beliefs... I think anthropogenic climate change fosters denial because believing it is true brings conflict with core beliefs such as "the free market is the best way to go", or core beliefs about our selves such as "I'm not one who hurts the environment" etc...
Prev 1663 1664 1665 1666 1667 1668 1669 1670 1671 1672 1673 1674 1675 1676 1677 1678 Next


