


 Arguments


Recent Comments
Prev 1707 1708 1709 1710 1711 1712 1713 1714 1715 1716 1717 1718 1719 1720 1721 1722 Next
Comments 85701 to 85750:
-
Tom Curtis at 21:56 PM on 29 May 2011How Jo Nova doesn't get the tropospheric hot spot
mike williams @42, the reason I refer adversely to your character is quite simple, you have taken my words and misrepresented their content. I am careful with my wording because I am used to that tactic by both evolution deniers and AGW deniers (not to mention various 911 deniers, lunar landing deniers and other kooks I have had the misfortune of encountering on the internet) I stated that the sentence, "The biggest misunderstanding about the tropospheric hot spot is the mistaken notion that it's caused by the greenhouse effect" was poorly phrased because it did not properly express the intended meaning of its author. That intended meaning was "that the tropospheric hotspot is not uniquely caused by the greenhouse effect", as I stated in my 36. And of course, that is true. Therefore the original sentence was poorly phrased, not "wrong" because that would be incorrectly interpreted as an error of belief by the author, where no such error existed. Of course, you wanted that misinterpretation to flourish, hence your post 40. You show the same trolling pattern in your 42 when you bring in the term postmodernism as a rhetorical cudgel (which you incorrectly apply, and misdiagnose). What is more, instead of directing it at my actual response to you, you just choose technical terms at random (and evidently without understanding) to support your rhetorical attack. Plainly, for your, effect is far more important than relevance or cogency. -
Tom Curtis at 21:41 PM on 29 May 2011How Jo Nova doesn't get the tropospheric hot spot
mike williams, you have been posing as a fair minded enquirer seeking illumination, but it is quite plain from the tenor of your questions and comments that you are in fact a denier trying various rhetorical gambits. For example, let's take your question about in what other fields is wind shear used as a measure of temperature. Clearly your purpose is to delegitimize the method on the basis that it is not used in any other field (if that is in fact the case). That represents an evasion on your part in that you are avoiding discussion of the physical basis of the method, a ground on which, no doubt you have no ground. So rather than tackling the science where it is strong, you use innuendo. Now, the correct answer to your question is, who cares? It does not matter that variation in the propagation speeds of sound waves is only used to measure the temperature beneath the surface of the sun (if that is in fact the case). What matters is whether temperature affects the propagation speeds of sound waves, and sufficient data can be gathered from this to determine internal temperatures. So, if it happens to be the case that only the sciences of meteorology and climatology use wind shear to measure temperature, so what? If oceanographers do not use wind shear to measure temperature, that is irrelevant to the use of the method. Likewise if metallurgists have also neglected this technique, or geologists. In fact, only sciences which measure wind (of which their are only three) could conceivably use this technique and two of those are so closely related that in this area they are not separate fields. The third science that could conceivably use this technique is astronomy. Whether astronomers ever have or not, well I hardly claim to be up on all the papers in that field, and I doubt many contributors to Skeptical Science are. But it is irrelevant whether they have or not. So, the proper interpretation to the silence that met your question (silence, note - not evasion because there was no response to your initial question at all by anybody), is that nobody cared. Your question was irrelevant. Of course, when you asked it a second time, it was clear what your rhetorical game was. So I provided an answer to the rhetorical point, your unsubtle suggestion that the method was ad hoc. And by the way, the method has been used before, though not in another field. In fact, the method was first used (that I know of) in climatology by that well known champion of AGW denialism, Roger Pielke Snr in 1998. As always, it is not the method deniers really have a problem with - it is the result. -
Dikran Marsupial at 21:20 PM on 29 May 2011Can we trust climate models?
GC@53 If you mean this diagram, then I rather doubt Hubert Lamb would have approved of anyone in 2011 preferring an essentially qualitative plot based on central England (rather than global) temperatures as a proxy for global paleoclimate, when there is far more global proxy data available now and 30 years more research on paleoclimate.
See Appendix A of P. D. Jones et al., The Holocene 19,1 (2009) pp. 3–49, High-resolution palaeoclimatology of the last millennium: a review of current status and future prospects available here, for details.
then I rather doubt Hubert Lamb would have approved of anyone in 2011 preferring an essentially qualitative plot based on central England (rather than global) temperatures as a proxy for global paleoclimate, when there is far more global proxy data available now and 30 years more research on paleoclimate.
See Appendix A of P. D. Jones et al., The Holocene 19,1 (2009) pp. 3–49, High-resolution palaeoclimatology of the last millennium: a review of current status and future prospects available here, for details.
-
NikFromNYC at 20:57 PM on 29 May 2011If It's Not Sex, Drugs, and Rock 'n Roll, what is it? Creativity maybe?
"How would Janis Joplin or Jimi Hendrix tackle global warming?" By writing songs that point out how oppressive and totalitarian the alarmist movement is. As a person who grew up with The Whole Earth Catalog as my adolescent bible (one that championed Bucky Fuller's anti Malthusian and anti Ehrlickian sense of optimism), as a person inspired to pursue chemistry due to an interest in neurochemistry inspired by having read all of Tim Leary's books, I can tell you that the counter-cultural swing of the 60s was very much anti-state, anti-war and very libertarian. Your whole vibe is however authoritarian, statist and left wing. It is profoundly anti libertarian. I was inspired recently to capture some of this bitter pill flavor in a new poster graphic that I call Authority. Several quotes from your book with Hayden feature in it. Since you are pursing a statist solution to a perceived problem, I suggest looking not at counter examples like the dionysian 60s but to other successful statist youth movements. History has a few to offer. First you need to demonize a perceived enemy.... -=NikFromNYC=- Ph.D. (Columbia/Harvard) -
RyanStarr at 20:48 PM on 29 May 2011The Critical Decade - Part 1: The Science
Page 9, 'Climate Commission, The Critical Decade', A recent model study comparing the relative importance of various greenhouse gases for the climate estimates a sensitivity of approximately 4 °C for a doubling of CO2 (Lacis et al. 2010). Lacis et al 2010, For the doubled CO2 and the 2% solar irradiance forcings, for which the direct no-feedback responses of the global surface temperature are 1.2° and 1.3°C, respectively, the ~4°C surface warming implies respective feedback factors of 3.3 and 3.0 (5). (5) Hansen et al 1984, Our 3-D global climate model yields a warming of ~4°C for either a 2 percent increase of So or doubled CO2 1984 is recent? -
mike williams at 20:39 PM on 29 May 2011How Jo Nova doesn't get the tropospheric hot spot
"As to using wind speed as a measure of temperature, we currently use the following methods to measure temperture:" Thats correct Tom..but as you are more than aware..I was not asking you what other indirect ways do we measure temperature,I was asking you about using wind. My original question was What other fields is wind shear used for measuring temperature.? And you still didnt answer it..I will not bother you on this "sensitive" point anymore Tom.. The answer to my question from the silence and evasion was probably...None.. :) -
mike williams at 20:13 PM on 29 May 2011How Jo Nova doesn't get the tropospheric hot spot
mike williams @40, my statement was correct. If you want to replace it with a falsehood for your own rhetorical purposes, it is only informative about your character. Hi Tom... You have to love postmodernism views on science and the meaning of words.. :) "The biggest misunderstanding about the tropospheric hot spot is the mistaken notion that it's caused by the greenhouse effect." Turns into "enhanced greenhouse effect" The IPCC use the term greenhouse effect Tom.. http://www.ipcc.ch/publications_and_data/ar4/wg1/en/faq-1-3.html And there doesnt appear to be a difference between greenhouse effect and enhanced greenhouse effect in their interchanging usage in the IPCC papers either Tom.. As for your strange and slightly juvenile "attack" on my character Tom..I gather you are exempt from the "ad hominem comments will be deleted" policy on the board..or do post modernists have a new interpretation of ad hominem as well as other words. ? : ) As to using wind speed as a measure of temperature, we currently use the following methods to measure temperture: Thanks you very much for those examples Tom..much appreciated. ! You learn something new every day.! "As you have not advanced a single argument against the method beyond your disbelief, that shows us only that you are rejecting the analysis because you dislike the conclusions." I had no belief either way..there are papers for it..there are papers against it..their are scientists for and against.. I was just puzzled about the use of wind for temperature..sorry to express my puzzlement.. :) -
mike williams at 19:55 PM on 29 May 2011The Critical Decade - Part 1: The Science
"When preparing for negotiations, you must have a clear idea of what you are prepared to concede..Again in short, we need to take action now or we will not be in a position to comply with any global negotiated agreement." Yes Tom..I understand that...but the elephant in the corner of the room is the comments by the chief climate scientist. Now, as many suspect, the "big polluters" like India/China/Russia/USA etc will never cut back on CO2 emission..and ,,lets face it..unless we spend more money on alternative energy systems..dirty old coal technology will still be powering alot of things in the future. And I assume Australia will still take the moral high ground..but as you and I both know.. but only one of us will admit..if this happens..then our actions are a complete and utter waste of time. Perhaps I have missed something in the media recently. So my two questions are 1/Does a minority of CAGW supporters/enviromentalists etc disagree with Flannerys statements and if so can anyone please point to MSM reports/interviews etc where these views are expressed and on what technical grounds. 2/Will someone in this interesting thread be explaining how a tax on CO2 in Australia will make Australian climate "better" in the future when the other industrial "polluters" dont reduce their own CO2 emissions. Thanks..!!Response:[dana1981] This is seriously off-topic, but China is preparing to implement a carbon cap and trade system, Europe already has one in place, and the US EPA is regulating carbon emissions from large sources (and eventually we'll have a cap and trade system too, once Republicans stop blocking it). Anyway, your argument is Tragedy of the Commons - please take further discussion of the subject to that thread.
-
Tom Curtis at 19:25 PM on 29 May 2011Climate Change Denial book now available!
tallbloke @30, your remind me with the denier search for an "honest broker". By that they mean somebody who will largely agree with their talking points, but an honest broker is actually one that tells the truth, no matter how unpalatable. In the global warming debate, it is the Gavin Schmidts of the climate science community who are honest brokers, not the Judith Currys, and most certainly not the McIntyres. In this case what we in fact have is in fact an even handed book, one which distributes praise and damnation based on merit and without regard to person. Unfortunately for the opponents of climate science, that means they cop a lot of criticism in it, as they would in any genuinely even handed book on the climate debate. -
newcrusader at 19:23 PM on 29 May 2011The Critical Decade - Part 1: The Science
Hansen & Sato feel the sea rise estimates to be a non linear process in their recent research paper 'Paleoclimate Implications for Climate Change..... January 2011 They feel that up to 5 meters is possible by 2095. http://www.columbia.edu/~jeh1/mailings/2011/20110118_MilankovicPaper.pdf -
Tom Curtis at 19:17 PM on 29 May 2011The Critical Decade - Part 1: The Science
mike williams @40, while hoping not to tread on toes for future contributions to this series, let me state the obvious. When preparing for negotiations, you must have a clear idea of what you are prepared to concede, and what is the minimum reasonable position you will accept from other participants. If you have that in mind, then it will restrict your current strategies. It will restrict them because some actions, if taken, will prevent you ever being able to concede what in theory you are prepared to concede; or require of your negotiating partners more than the minimum reasonable position. In short, some actions will guarantee failure of any potential negotiations by changing the facts on the ground to such an extent that no reasonable negotiation can succeed. If you are seriously intent on a negotiated solution to a problem, you will not take actions that preclude a successful negotiated solution. How is that relevant to climate change? Well, by the best available evidence, if humans do not restrict their future emissions to under one trillion tonnes of Carbon, they will face damages from climate change sufficiently severe that the continuation of our civilization (civilization, not species) is in significant doubt. So any serious negotiation must be premised on keeping total emissions under 1 trillion tonnes of carbon. Further, any serious negotiations must also be premised on equitable burdens. That means in the simplest terms equal per capita emissions quotas for all nations. Considered in those terms, we face the unpleasant fact that the US will exceed its "carbon budget" within six years, even with no growth in emissions. Australia will do the same. It is not possible to eliminate US or Australian emissions in 6 years, and nor do they need to do so within a negotiated emissions trading framework. However, to fit within even a negotiated emissions trading solution, we need to be reducing our emissions now. Failure to do so simply is a vote for a "solution" to the problem of global warming that will not save the great barrier reef, or our economy, or (in all probability) our civilization. Again in short, we need to take action now or we will not be in a position to comply with any global negotiated agreement. Put another way, if we don't take action now, you can be very sure that any negotiated agreement that is signed when the world's leaders finally become desperate enough to take proper action will include the requirement to buy emissions permits retrospectively for our emissions now. The fundamental equation is this - the longer you wait to take action, the more expensive it will be to take adequate action. Waiting for negotiations to succeed will not save us one iota of that cost. But acting early may well help get an earlier negotiated agreement. -
newcrusader at 19:14 PM on 29 May 2011The Critical Decade - Part 1: The Science
What I feel some here are implying, is that the event of 1944 proves that the arctic melt minimum of 2007, but also the ice losses in 2008, 2010 where not unusual- which is basically saying that what has happened the last 6 years is nothing to be concerned about and there is no danger from CO2 and its GHG warming. Denialists? Likely. -
tallbloke at 19:12 PM on 29 May 2011Climate Change Denial book now available!
"would be surprised if the person offering the negative review has even read the book in its entirety." " I added my review (having read most of the book). Definitely worth 5 stars!" Clearly, people form opinions of books without reading them in their entirety. However, the negative reviewer makes statements which (s)he couldn't be certain of without doing so. I think (s)he misses the point though. Why would (s)he expect a book with this title and cover to be a middle of the road, even handed review? -
Tsumetai at 17:54 PM on 29 May 2011The Critical Decade - Part 1: The Science
According to my Data UAH shows a warming trend of +0.0174 degrees per year for the last decade (2000-2010), RSS shows a warming trend of +0.009 degrees per year for this same period. GISS shows a warming trend of +0.015 degrees per year for the last decade. Oddly, the CRU (the ones the Contrarians accuse of "doctoring" climate data) show only a +0.005 degree warming per year for 2000-2010.
I'd imagine the error bars on each of those encompass the point estimate for the trend over the previous 20-30 years, too.Response:[DB] Certainly, one could imagine it. But that would be unnecessary, as the actual analysis has already been done:


Note the error bars do not include zero in either dataset until 2001; thus, the warming since 2000 is statististically significant.
And remember that the Aughts (the decade 2001-2010) were the warmest in the instrumental record, with 2010 being tied for the warmest year on record. So, one can safely say that GW is carrying on its busy, obeying-the-laws-of-physics way, blissfully ignorant to the dissembling of those who would have us debate the existence of gravity.
-
Tom Curtis at 16:49 PM on 29 May 2011How Jo Nova doesn't get the tropospheric hot spot
mike williams @40, my statement was correct. If you want to replace it with a falsehood for your own rhetorical purposes, it is only informative about your character. As to using wind speed as a measure of temperature, we currently use the following methods to measure temperture: a) the expansion of metals in glass tubes; b) the differential expansion of different metals; c) the change of plasticity in waxs and other compounds; d) the change in colour of waxes; e) the change in conductivity of metals; f) the colour of light from a source; and g) the change in the velocity of sound. Those methods are just the ones that come immediately to mind, and I am sure they are not exhaustive. Apparently you cannot recognise the use of wind shear data as a valid means of measuring temperature. As you have not advanced a single argument against the method beyond your disbelief, that shows us only that you are rejecting the analysis because you dislike the conclusions. -
mike williams at 16:43 PM on 29 May 2011The Critical Decade - Part 1: The Science
"In Parts 2 and 3 we will examine the report's chapters on risks associated with climate change and implications of the science for emissions reductions." Should be interesting..will you be explaining how a tax on CO2 in Australia will make Australian climate "better" in the future when the other industrial "polluters" dont reduce their own CO2 emissions. Flannery: Just let me finish and say this. If the world as a whole cut all emissions tomorrow the average temperature of the planet is not going to drop in several hundred years, perhaps as much as a thousand years because the system is overburdened with CO2 that has to be absorbed and that only happens slowly. Quote"It's also important to note that uncertainties can go either way, and the consequences of climate change are just as likely to be more damaging than we expect as less. Uncertainty is not our friend." Translated..it might not be as bad as 99% of the stories in the media portray.. I am not sure why a lot of the posters on this excellent site really worry so much about the science being misrepresented or not.. We are getting a CO2 tax..which is exactly what you all wanted..!! We will probably get emissions trading..which is exactly what you wanted right.? The majority of the media never question any statement by anyone rightly or wrongly trying to link absolutely anything on earth to Human created CO2..which is exactly what you want right..? And..who could have predicted the Orwellian term "Minister for Climate Change"..ever being created..You must be happy with that as well. ?? And last but not least..all the political parties support CAGW..at different extremes of course.. CAGW...has won.!! Relax.. : )Response:[DB] "Translated..it might not be as bad as 99% of the stories in the media portray.."
Further translated: It might be worse.
-
mike williams at 16:18 PM on 29 May 2011How Jo Nova doesn't get the tropospheric hot spot
Tom Curtis at 13:51 PM on 24 May, 2011 mike williams @34, the sentence you quote is poorly phrased. As the current warming is predominantly due to the enhanced greenhouse effect, any tropospheric hotspot observed will also be due to that enhanced greenhouse effect. Thanks Tom..perhaps it should be.."the sentence you quote is wrong". : ) I still dont understand if using "..indirect calculations of temperature based trends in the vertical differential in zonal wind acceleration from radiosonde measurements." is using a novel/ad hoc ? method for measuring temperature. When I asked what other areas of science use methods like this no one replied..so i will stay confused. Regarding John Cook`s statement "It fails to explain how we can have short-term positive feedback and long-term negative feedback",, Thanks for that, it rare to see the term "negative feedback" mentioned in the msm. -
Tom Curtis at 16:03 PM on 29 May 2011The Critical Decade - Part 1: The Science
Camburn @38, in its 1944 voyage, the St Roch sailed north of Victoria Island and South of Banks Island, as shown here. As you can see on the following map, in 2007 it was clearly possible to follow a route north of Banks Island: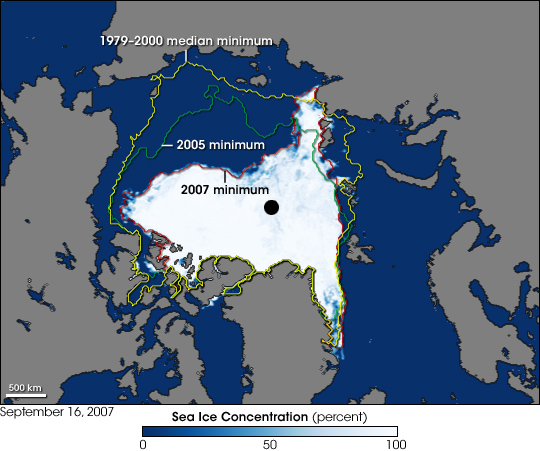 The route north of Banks Island was also ice free in 2010, though not in 2008 and 2009:
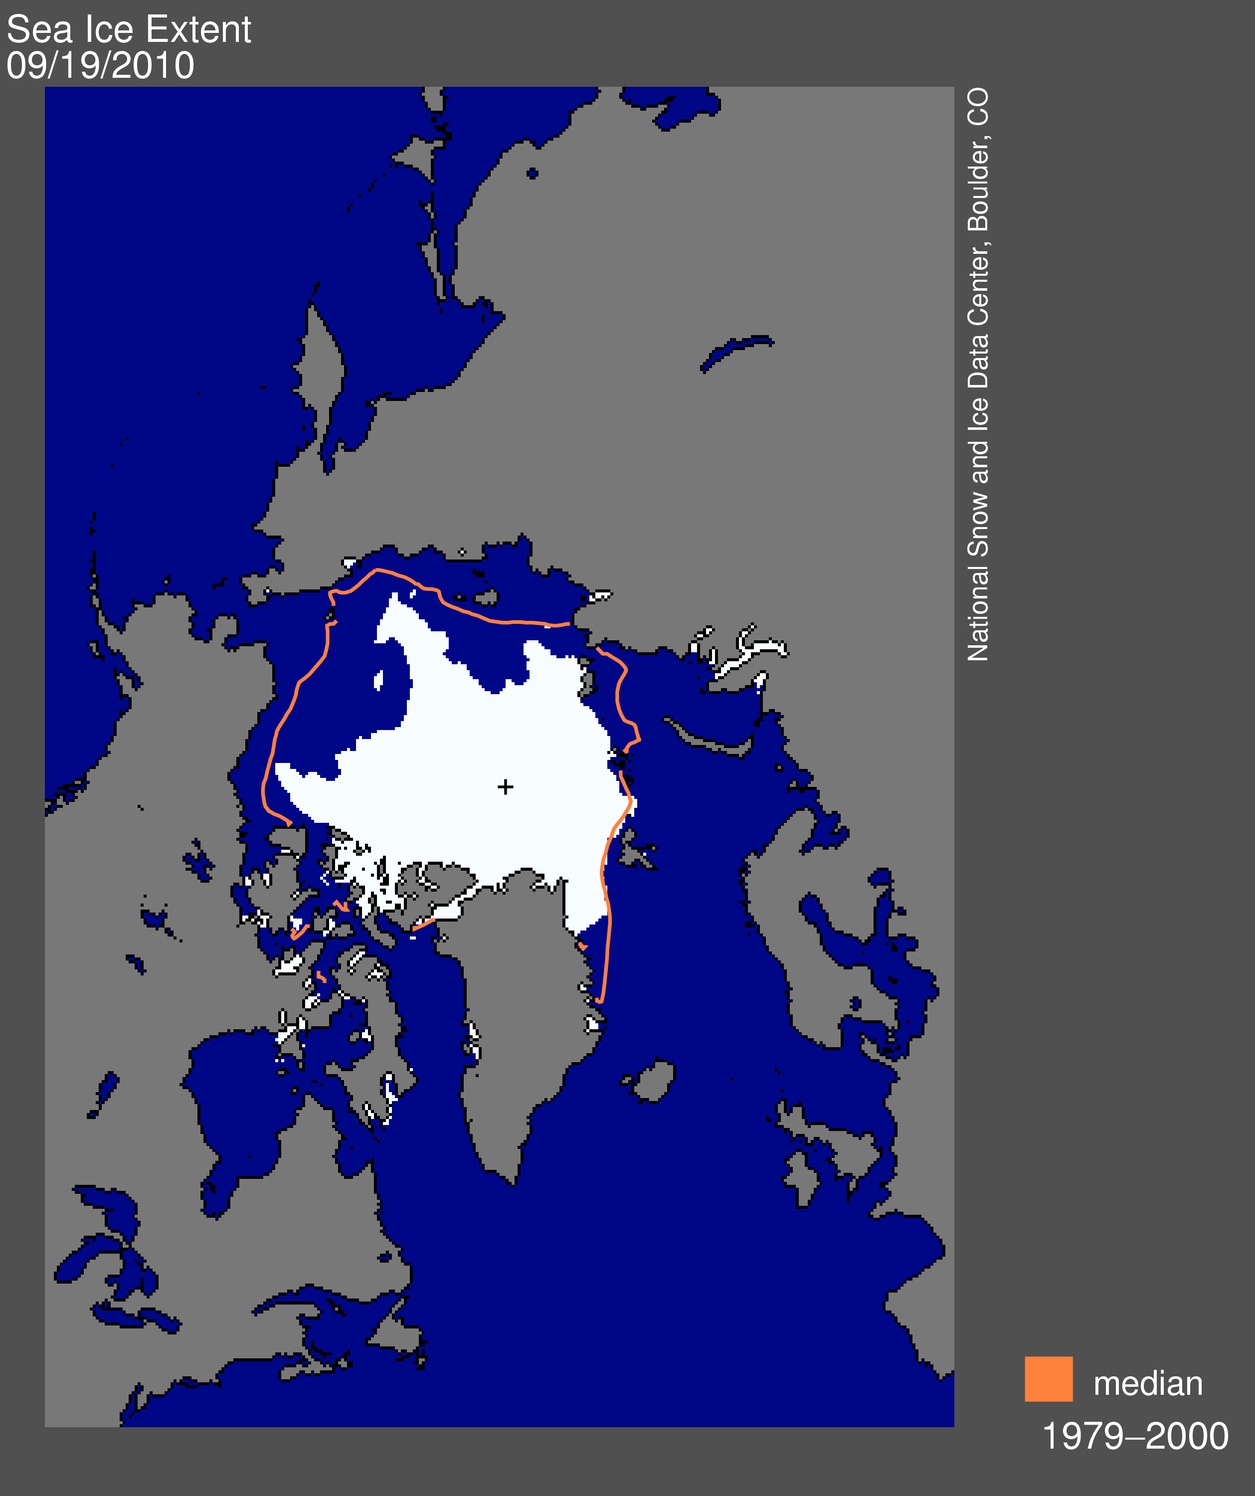 In contrast, the even the St Roch's more southerly 1944 rout was not entirely ice free.
-
scaddenp at 15:21 PM on 29 May 2011Can we trust climate models?
No GC - history also show MCA occurring at different times in different places in agreement with paleoclimate reconstructions. History shows it was cold globally, especially in NH, also in agreement with paleoclimate. Where is problem there? No denial of history at all. What you falsely claim is that models cant reproduce this. I just showed you that they can. Any of them on that diagram. Still think TV trumps science? The gist of your argument I guess was that if models couldnt reproduce historical climate then there is some deep mysterious forcing at work that is miraculously going to save us. However, not so, when you have a global picture which show that you can reproduce it all from known forcings. That is not to say that there might not be something that somehow eludes our measuring systems but that is hope in the face of data. By MBH 1998 and related, can I take it you mean all paleoclimate reconstructions done since then by all groups? with all sorts of proxies. You seriously think that is a realistic position that we should respect? -
Camburn at 14:57 PM on 29 May 2011The Critical Decade - Part 1: The Science
JMurphy@24: The passage that the St Roch sailed has not been sailed since. The ships are so far using the southern route in the NWP. The northern route that the St Roch sailed is still closed. I can once again only suggest that you contact the museum in Vancouver to get the book that has the logs of Capt Larson in them. I have asked for permission to post them online, but so far it has not been granted. -
Camburn at 14:55 PM on 29 May 2011The Critical Decade - Part 1: The Science
Tom: From your quote on the link embedded: "This evidence clearly supports the view that ice loss from West Antarctica significantly excedes that from East Antarctica, but is ambiguous about whether East Antarctica is loosing ice. On balance, it is probably loosing ice, but the GRACE experiment may well be overestimating the rate of loss" When you read current literature about East Antarctica, no one is claiming that it is loosing ice. They all admit, as you do, that there is no trend plus or minus. -
Marcus at 14:52 PM on 29 May 2011The Critical Decade - Part 1: The Science
Ken Lambert. According to my Data UAH shows a warming trend of +0.0174 degrees per year for the last decade (2000-2010), RSS shows a warming trend of +0.009 degrees per year for this same period. GISS shows a warming trend of +0.015 degrees per year for the last decade. Oddly, the CRU (the ones the Contrarians accuse of "doctoring" climate data) show only a +0.005 degree warming per year for 2000-2010. Either way, there is *no* real flattening of the warming trend-especially when you take into account the decade of deep solar minimum that we've been through. Also, why were 8 of the 10 hottest years in this decade, if the warming trend had leveled off? -
Tom Curtis at 14:48 PM on 29 May 2011The Critical Decade - Part 1: The Science
Ken Lambert @13 pt 4 As discussed here, the balance of evidence suggests that East Antarctica is loosing ice, though at a slower rate. Even if it was not loosing ice, however, one wonders at the relevance of a specific mention. The volume of ice from just Greenland and West Antarctica is more than sufficient to drive sea levels many meters higher, and projected accelerations of the rate of loss in these two regions are sufficient to drive sea level gains of from 1 to 2 meters in the coming century, with potential but contentious rises as high as 6 meters. Given these facts, is it really so urgent to advise the Australian public that East Antarctica is not expected to contribute significantly to the deluge for another century or so? (On a side note, you will note the difference in word count between a rebutall of Lamert's inane suggestion and that needed to make it. It is that difference which makes his post a clear Gish gallop.) -
Riduna at 14:37 PM on 29 May 2011The Critical Decade - Part 1: The Science
Apart from the point raised by boba 10960, I have only one minor quibble with this informative article, which states … “humans are causing dangerous global warming”. I would argue that the past tense would be more accurate …”humans have caused” or … “humans continue causing dangerous global warming”. Humans have now emitted sufficient greenhouse gases to initiate methane emissions from onshore permafrost and offshore clathrates, both entering the atmosphere as CH4. Those emissions were 4 and 8 tonnes per annum in 2005 and neither the melting of ice or the magnitude of their release is going to decrease. Both are predicted to increase –Shakhova et al (2010). Hansen et al (2011) warn that as a result of anthropogenic emissions and these slow emissions, polar temperature can be expected to more rapidly reduce sea ice and increase Arctic amplification. This is predicted to result in decadal doubling of ice loss from the Greenland Ice Sheet, initiating its eventual collapse and raising sea level by 5m before 2100. Hansen goes further. He expresses the view that as ocean warming continues it will result in them releasing CO2 and those releases increasing in magnitude such that the net ability of oceans to absorb CO2 reduces. It should be noted that this outcome is expected to occur during a period when human emission of greenhouse gases can be expected to increase. It seems to me that these developments provide sufficient pointers to the fact that humans have been causing dangerous global warming for well over a decade and are continuing to do so, irrespective of consequences which are dire indeed! -
Tom Curtis at 14:36 PM on 29 May 2011Antarctica is gaining ice
Following up on posts by Camburn here, the most recent paper on Antarctic Ice Mass Balance I can find is Rignot et al 2011, published in March of this year. It finds:"In 2006, the Greenland and Antarctic ice sheets experienced a combined mass loss of 475 ± 158 Gt/yr, equivalent to 1.3 ± 0.4 mm/yr sea level rise. Notably, the acceleration in ice sheet loss over the last 18 years was 21.9 ± 1 Gt/yr2 for Greenland and 14.5 ± 2 Gt/yr2 for Antarctica, for a combined total of 36.3 ± 2 Gt/yr2. This acceleration is 3 times larger than for mountain glaciers and ice caps (12 ± 6 Gt/yr2). If this trend continues, ice sheets will be the dominant contributor to sea level rise in the 21st century."
It does not distinguish between ice lost from West or East Antarctica. The most recent article I found that does distinguish between them is a review article by Cazenave and Llovel (2010) which finds the majority of the ice loss on the West Antarctic Ice Sheet, with East Antarctica being found to be "in near balance". The most recent GRACE data I can find is from Chen et al (2009) which finds:"In agreement with an independent earlier assessment, we estimate a total loss of 190 +/-77 Gt yr^1, with 132 +/-26 Gt yr^1 coming from West Antarctica. However, in contrast with previous GRACE estimates, our data suggest that East Antarctica is losing mass, mostly in coastal regions, at a rate of 57 +/-52 Gt yr^1, apparently caused by increased ice loss since the year 2006."
This evidence clearly supports the view that ice loss from West Antarctica significantly excedes that from East Antarctica, but is ambiguous about whether East Antarctica is loosing ice. On balance, it is probably loosing ice, but the GRACE experiment may well be overestimating the rate of loss. -
gallopingcamel at 14:06 PM on 29 May 2011Can we trust climate models?
scaddenp @49, You should be aware that AR1 included a paleo temperature reconstruction that Hubert Lang would have approved. The TAR showed an entirely different paleo reconstruction based on MBH 1998. In this analysis the MWP disappeared and the LIA was just a gentle dip in temperature. It was really easy for the climate models to create hindcasts that agreed with the TAR reconstruction as the temperature from 1000 A.D. to 1850 was shown as a gently falling straight line. What I am trying to tell you is that the TAR and subsequent IPCC publications demand that you ignore history. [snip] History Rools!Moderator Response: [Dikran Marsupial] Moderator trolling snipped. -
Camburn at 13:53 PM on 29 May 2011The Critical Decade - Part 1: The Science
More on Black Carbon; http://ehp03.niehs.nih.gov/article/fetchArticle.action?articleURI=info%3Adoi%2F10.1289%2Fehp.119-a172 As I have stated before, I am very keen on seeing particulate pollution reduced as the health benifits are without question. -
Camburn at 13:40 PM on 29 May 2011The Critical Decade - Part 1: The Science
Tom Curtis @27: I must be getting either older or tired. Here is a link to the effects of black carbon etc on Arctic temps: It was Shindell, not Lindell. That is the reason both of us had such a hard time finding it. http://www.nasa.gov/topics/earth/features/warming_aerosols.html -
Camburn at 12:55 PM on 29 May 2011The Critical Decade - Part 1: The Science
Tom Curtis @ 27: It was published in science, the paper by Schmidt/Lindell. I will see if I can find a link. As far as East Antarctica, where over 90% of the worlds ice is, there is no conclusive evidence that the ice in increasing, nor is there evidence that the ice is decreasing. It appears to be static at this time.Response:[DB] Please take further discussion of this to the Antarctica Is Gaining Ice thread.
-
SoundOff at 12:02 PM on 29 May 2011Of Averages and Anomalies - Part 1A. A Primer on how to measure surface temperature change
Glenn, will you be addressing in a later part why station numbers might change? For example, in the GHCN the Toronto Canada temperature station has one of the longest records of both max & min temperatures in the world so it’s a good one for certain analyses. But it had Station ID CA006158350 from 1840 to mid 2003 and then temperature reporting ceased (though precipitation records continue until now). There’s a gap of a few months and then from 2004 to present Toronto temperatures are reported as Station ID CA006158355 instead. The latitude, longitude & altitude are identical for both Station IDs. Major instrument changes maybe? This complicates getting the full data set. -
scaddenp at 11:54 AM on 29 May 2011The Critical Decade - Part 1: The Science
Camburn, the paper you are looking for is Chen 2009. There is some small ice loss in East Antarctica but as everyone points out, the is net ice loss for all of Antarctica and it appears to be accelerating. -
Bern at 11:20 AM on 29 May 2011The Critical Decade - Part 1: The Science
Ken Lambert: here's an SkS post from a year and a half ago that suggests that the East Antarctic Icesheet is now losing mass. I'd say, though, that more data is needed over a longer timeframe to definitively answer that question. I'd suggest the "Antarctica is gaining ice" thread is the appropriate place to discuss this, though. -
Tom Curtis at 11:07 AM on 29 May 2011The Critical Decade - Part 1: The Science
Ken Lambert @26, yes cherry picking because you continue to insist or reporting only the recent short term trend when the duration of that trend is no where near long enough to determine if it is a genuine change in the long term trend, or merely a short term fluctuation. Labelling of the various denier cherry picks and gish gallops as cherry picks and gish gallops may have become uncomfortably frequent, but the solution lies entirely in denier hands. Stop producing them and we will no longer have to call you on it. -
Tom Curtis at 11:03 AM on 29 May 2011The Critical Decade - Part 1: The Science
Camburn @18, can you provide a clearer reference to Schmidt Lindall et al. I can find no relevant paper from them in a search of google scholar. What I did find was a paper by Screen and Simmonds (2010), who write:"Here we show that the Arctic warming is strongest at the surface during most of the year and is primarily consistent with reductions in sea ice cover. Changes in cloud cover, in contrast, have not contributed strongly to recent warming. Increases in atmospheric water vapour content, partly in response to reduced sea ice cover, may have enhanced warming in the lower part of the atmosphere during summer and early autumn. We conclude that diminishing sea ice has had a leading role in recent Arctic temperature amplification. The findings reinforce suggestions that strong positive ice–temperature feedbacks have emerged in the Arctic, increasing the chances of further rapid warming and sea ice loss, and will probably affect polar ecosystems, ice-sheet mass balance and human activities in the Arctic."
(My emphasis) Black carbon is, it appears, hardly worth a mention in the Arctic. That is not surprising given the large distance to the primary sources (India, China) and the low residence time in the atmosphere of black carbon. -
Ken Lambert at 10:23 AM on 29 May 2011The Critical Decade - Part 1: The Science
"[dana1981] I don't have the time to respond to this entire Gish Gallop, but you're cherrypicking. The last 30 years includes the last 10 years." I was responding to the "main points" of the report in your original post. So that is a cherry pick? Labelling uncomfortable facts 'gish gallops' and 'cherry picks' is becoming a devalued currency on this site.Response:[dana1981] Pulling 10 years out of the 30 year period being evaluated is pretty much the definition of a cherrypick.
-
Ken Lambert at 10:11 AM on 29 May 2011The Critical Decade - Part 1: The Science
Southwing #15 #20 I pointed out that the report highlighted the Greenland and West Antarctic ice loss without mentioning the majority of the planet's ice in East Antarctica. An AGW cherry pick par excellence I would have thought. Last time I looked, East Antarctica was neutral or slightly increasing ice mass, and the overall Antarctic was a slight loss (Camburn might correct me on this if I am not right up to date). This overall loss equates to a 0.12mm contribution to the global SLR which is officially 3.1mm/year, but Jason 1 and 2 show 1.7-2.0 mm/year. Global tide gauges are showing even less than this. Overall global ice melt is very small contribution to the net global energy imbalance even when Hansen's smaller imbalance is taken into account. -
JMurphy at 09:57 AM on 29 May 2011The Critical Decade - Part 1: The Science
Anyone who really wants to know the facts about crossings of the Northwest passage (as Tom Curtis has noted), can easily discover the truth and will notice the difference between previous trips and those that are currently undertaken : In 1944, St. Roch returned to Vancouver via the more northerly route of the Northwest Passage, making her run in 86 days. The RCMP ship was the 104-foot, schooner-rigged St. Roch, which was specially built for resisting the crushing pressures of sea ice that would destroy her. Although the return trip to Vancouver presented certain navigational difficulties, these were far less life-threatening than the ones encountered on the more southerly route. It took only 86 days to sail from Halifax to Vancouver. The route taken, through Parry Channel, and then Prince of Wales Strait at its western end, will most certainly be the one first used by commercial shipping as global warming accelerates the thinning of the Arctic ice cover. 1st commercial ship sails through Northwest Passage. Rayes, who was on the vessel during its trip through the Northwest Passage, said the company informed the coast guard, which put an icebreaker on standby. "They were ready to be there for us if we called them, but I didn't see one cube of ice," he said. "They were informed about our presence [and] they were ready to give us the support needed. However, since there was no ice whatsoever, the service was not needed, we didn't call for it." In 2009 sea ice conditions were such that at least nine small vessels and two cruise ships completed the transit of the Northwest Passage. On 28 August 2010, Bear Grylls and a team of 5 were the first rigid inflatable boat (RIB) to complete the North West Passage [in 11 days]. -
Charlie A at 09:38 AM on 29 May 2011Can we trust climate models?
Re Kevin C #51. Glad to see we get the same results. I used the RadF.txt file from the same page as your NetF.txt file. It has the radiative forcing components broken out separately. The sum of forcings differs from your file by 0.0001 W/m2 here and there from roundoff errors. No real effect. It is interesting to compare this dataset of forcings with the ones in Hansen et al 2011 white paper. The ones used for the 1800-2003 AR4 simulations flatlined the aerosols at the 1990 levels. The Hansen whitepaper sets the sum of forcings from aerosols to be exactly -0.5 time the sum of wmGHG forcings. I'm still looking for a copy of the latest forcings from GISS, but lacking that, I'll just estimate them from the Hansen paper. ------------------------ One other thing to consider in your model is the effect of doing annual steps rather than continuous integration. A reasonable argument can be made for replacing your R(t) = 0.0434*exp(-t/1.493) + 0.0215*exp(-t/24.8) with R(t) = 0.06066*exp([-t+0.5]/1.493) + 0.02194*exp(-[t+0.5]/24.8) Where the time constant is long compared to the step (as in the 24.8 year exponential decay) the annual steps are reasonable approximation of exponential decay. But for the 1.493 year time constant, having the first coefficient of R(t) be a 1.0 isn't as good of an approximation as having the 1st coefficient be the value of R(t) at the midpoint of the year. Another way of looking at this 2 box model is that the forcings are passed through an exponential filter. The sum of the 1st 250 coefficients is 25.3023 for the 24.8 year filter, and 2.0484 for the 1.493 filter. For a continuous exponential filter, the area under the weighting curve is simply the tau. The discrete version is only 2% high for the long filter, but is 37% high for the short one. Shifting R(t) over 1/2 year makes the sum of coefficients 24.7973 and 1.46545 -- essentially equal to tau for the long filter and about 2% low for the fast one. Replacing your 0.0434 weighting factor for the short filter with 0.06066 compensates for the change in sum of filter coefficients. I haven't done the calculations, but I'm pretty sure that moving from annual to monthly calculations won't change the optimization as much if you start with R(t+0.5)as the estimate for annual response. The sum of coefficients makes for an easy test on the equilibrium sensitivity: 0.0434*2.0484 + 0.0215*25.3023 = 0.6329 C step response from 1 watt m-2. So if CO2 doubling is 3.7W m-2, the doubling sensitivity will simply be 0.6329*3.7= 2.3 C/doubling of CO2. ------------------------------------------------ Next on my agenda is to look at the correlations between various models and global anomaly time series, and then see what happens when different forcing sets are used with my emulations of the various AOGCMs. Some prelim data is that my ultra simple model using just one exponential, approximated by 6 coefficient terms, has R of 0.99 or R-squared of 0.98 with the GISS-E model. GISS-E model to GISS observed Global-Average-Temperature-Anomalies is only 0.76 r-squared. Your parameters do better than GISS with r-squared of 0.82. If the GISS observed GATA was filtered a bit, I'm pretty sure your model will come out even better in comparison to GISS-E AOGCM. IPCC suggested a 5 point filter with coefficents of 1-3-4-3-1 to reduce the year-to-year and El Nino timeframe variation. It still leaves most of the decadal variation. -
newcrusader at 09:00 AM on 29 May 2011The Critical Decade - Part 1: The Science
Tom Curtis unless there is photographic evidence showing that ice melt comes close to the years 2006-2010, and the minim of 2007, The highly esteemed RCMP report as eyewitnesses to an ice free passage can be taken for what it is worth. Sorry. I guess I like to see absolute empirical evidence. In 1944 there was obviously no Satellites to preserve such an event. It seems improbable in 1944 when C02 levels where still below 300ppm. Nonetheless some kind of anomaly cannot be totally dismissed- misunderstood or misinterpreted perhaps. -
Tom Curtis at 08:45 AM on 29 May 2011The Critical Decade - Part 1: The Science
newscrusader @19, doubting the Royal Canadian Mounted Police when they claim to have transited the North West Passage is unwarranted. On the other hand, Camburn's suggestions that ice conditions now match those of 1944 when in recent years when transits have now become common place, even by cruise liners, and two yachts circumnavigated the globe through the north east passage and north west passage in a single season in 2010 are ridiculous. -
Glenn Tamblyn at 08:45 AM on 29 May 2011Of Averages and Anomalies - Part 1A. A Primer on how to measure surface temperature change
Gary Thanks. This is the first in a series of 4 posts on this over the next week or so. -
jfreed at 08:30 AM on 29 May 2011The Stockholm Memorandum
a. is there a group of Nobel Laureates, in any field, that hold a position in essence contrary to the one held by this group? b. is this group going to influence policy anywhere? c. I agree that so-called climate skepticism is a luxury we can ill afford. But, it is just so damn much fun! -
Kevin C at 07:42 AM on 29 May 2011Can we trust climate models?
Oh, I found it. I posted the right equation but the wrong plot. Yours is spot on. Mine was an earlier version where I fixed the exponential periods to 1 and 50. Sorry for wasting your time. The old version is more stable, as you might expect, but still needs 60 years of data. I need to track down whether the instability is overfitting or the general problem with exponentials. -
Kevin C at 07:20 AM on 29 May 2011Can we trust climate models?
I confirm the first 8 numbers of the step response match yours. (I actually rounded before posting, so I went back and redid my calc with the rounded values. I get an indistinguishable plot to my original.) Your understanding of c is correct (I didn't match the means, I just threw this into the minimizer as another refineable parameter.) For the total temp rise on step forcing I get 0.62925 after 123 years - I didn't got to convergence, I'm guessing you did? (Not that I trust the long tail of the response function.) Could we be using different forcing data? I picked up the NetF.txt file from http://data.giss.nasa.gov/modelforce/. Here's a few sample values: 1880 .0000, 1900 -.0569, 1920 -.0652, 1940 .2839, 1960 .3988, 1980 1.0099, 2000 1.8661 Otherwise, I confess I'm a bit baffled here, but I'll carry on looking at it. I'm getting interesting (non-)results on the cross validation front too. Results are only stable if the data covers at least 1920-2000 or 1900-1990. Truncating before 1990 means you lose the short response completely. I expected to need a volcano to get the short response, but I'm surprised Agung doesn't do it. Fitting exponentials is always tricky, and I'm using a simplex optimizer, which might be the issue. -
scaddenp at 07:06 AM on 29 May 2011Can we trust climate models?
"Writing off the TV presentation without even bothering to watch it." I dont say that TV cant get it right, but mostly doesnt so I dont bother. It did if it is the source of these statements: " the end of the MWP came suddenly and the recovery from the LIA came rapidly too." MCA varied in extent in timing around the world. See figure here and here for SH but especially the Mann et al 2009 paper. "Climatologists are still trying to identify the smoking gun or guns. " "A major reason for doubting the predictions based on GCMs is their inability to model these abrupt climate change events that occurred during historic times." If you believe these, then can I suggest you read the Paleoclimate chapter of AR4 and the papers that would say otherwise. Particularly note of figure this figure showing many model reconstructions of those periods. "Incidentally, you could not classify that History Channel program as "Denialist". " Wouldn't have clue but would doubt it. However, the director will be trying to make a program that people pay money to watch and I doubt very much his skills at surveying science compared to the IPCC panel. -
SouthWing at 06:46 AM on 29 May 2011The Critical Decade - Part 1: The Science
@Camburn; Will we have a rebound in ice in years to come? My gut instinct, which is worth nothing scientific says yes. My dear Camburn, gastroenterologists have determined that the human gut contains no rational thoughts. What it is full of is pretty well known. -
SouthWing at 06:40 AM on 29 May 2011The Critical Decade - Part 1: The Science
@Camburn: Southwing: Show me where East Antarctica is loosing ice mass. And I mean a paper that the loss is out of the error bars. Why should I have to? My challenge to Lambert--and now you--is to explain why you are ignoring the mass loss of the total Antarctic ice sheet. You are cherry picking, just as he is. Indeed, why are you pretending not to notice that the ice mass of the entire planet is shrinking? -
newcrusader at 06:21 AM on 29 May 2011The Critical Decade - Part 1: The Science
Camburn sorry to disagree with you- but the 1944 'story' has never been scientifically verified. I also disagree with you that there will not be an ice free arctic by 2030- by that time C02 will have reached 425-430ppm- and global temperatures will have risen another 1 degree C. What you are saying here, basically flies against what Hansen and Sato have said (which has been very accurate) The IPCC said ice late summer would occur around '2065' and a sea level rise under a foot. (this has recently been changed- to the higher level- 3 feet--- Since the huge melt in 2007, 2008, and last year- and the thin ice now in the arctic 1 & 2 years, and disappearing thick ice, your predictions are totally different then what NASA, the NOAA and the NSIDC predict. -
Charlie A at 06:12 AM on 29 May 2011Can we trust climate models?
@Kevin C, #33. Am I correct in assuming that a step forcing of 1 watt into your model (without the extra offset term) results in a final equilbrium temp increase of 0.6329 degrees? With the first few years being 0.0649, 0.1078, 0.1390, 0.1638, 0.1851, 0.2042, 0.2219, and 0.2385 ? I did in a spreadsheet the formula you posted, and came up with similar, but slightly different results. I overlayed the two results in the graph below. Blue is your plot, red line is mine. Note how my plot rounds off the corners a bit more, particularly in the earliest part of the plot. My plot is without an offset added. You said "c is -0.0764641223, which is a constant which fits the equilibrium temperature." I assume that you really meant to say that c was to match the mean of the GISS observed anomaly temp series and the mean of your model anomalies. Correct?
-
Camburn at 06:00 AM on 29 May 2011The Critical Decade - Part 1: The Science
newcrusader: I am not convinced that the Arctic will be ice free in late summer by 2030. I do think this year will have a very low min...my prediction is approx 3.5 using Jaxa data. The particulates coming from China are playing a very heavy toll on sea ice. The last paper that I have read concerning the Arctic was by Schmidt/Lindall etal where they showed that soot etc was more responsable for the decline than co2. The last time that Arctic Ice was flowing out as it is now was in 1944, the year that the St Roch sailed the deepwater Northwest Passage. You can buy the book from the museum in Vancouver that has Capt Larson's log in it where he describes ice conditions on that journey. Will we have a rebound in ice in years to come? My gut instinct, which is worth nothing scientific says yes. Time will tell if my gut is right. I think that pollution in China will become such a social issue that they will take known steps to curb it. I think they are very foolish right now to be using their country as a dumping ground when the teck is well proven with scrubbers etc to virtually eliminate particulate pollution from burning coal.

Prev 1707 1708 1709 1710 1711 1712 1713 1714 1715 1716 1717 1718 1719 1720 1721 1722 Next


