Climate Science Glossary

Term Lookup

Enter a term in the search box to find its definition.

Settings

Use the controls in the far right panel to increase or decrease the number of terms automatically displayed (or to completely turn that feature off).

Term Lookup

Settings


All IPCC definitions taken from Climate Change 2007: The Physical Science Basis. Working Group I Contribution to the Fourth Assessment Report of the Intergovernmental Panel on Climate Change, Annex I, Glossary, pp. 941-954. Cambridge University Press.

Home Arguments Software Resources Comments The Consensus Project Translations About Support

Bluesky Facebook LinkedIn Mastodon MeWe

Twitter YouTube RSS Posts RSS Comments Email Subscribe


Climate's changed before
It's the sun
It's not bad
There is no consensus
It's cooling
Models are unreliable
Temp record is unreliable
Animals and plants can adapt
It hasn't warmed since 1998
Antarctica is gaining ice
View All Arguments...


Username
Password
New? Register here
Forgot your password?

Latest Posts

Archives

Does Urban Heat Island effect add to the global warming trend?

Posted on 24 September 2008 by John Cook

It's well established that urban areas are warmer than surrounding rural areas. However, does Urban Heat Island (UHI) contribute to the global warming trend? Short answer, no. Two thirds of global temperature data comes from ocean records, free of UHI effect. For land records, urban trends are compared to nearby rural data - anomalous urban trends are homogenized to match rural records (Hansen 2001). However, in most cases, the urban temperature trend is observed to be little different to the rural trend. A new paper Urbanization effects in large-scale temperature records, with an emphasis on China (Jones et al 2008) looks at this in more detail.

Comparing rural and urban sites in London and Vienna

The paper begins by looking at 5 sites in and around London. Figure 1 shows absolute temperatures, clearly indicating a UHI influence on the urban sites at London Weather Centre (brown) and St. James Park (dark blue). The coolest record is the rural based Rothamsted (dark green). However, the excess urban warmth has no effect on the temperature trend - all sites show the same overall trend.


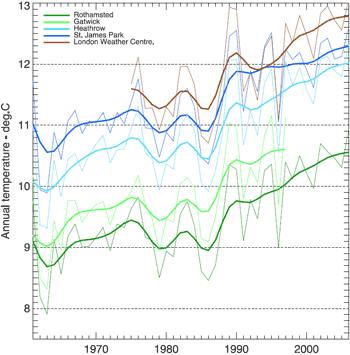
Figure 1: Annual temperature trends for five sites in and around London. Brown and dark blue are urban sites, green are rural.

A similar comparison was made between two sites in Vienna. Again, the absolute temperature is greater for the urban site but both sites show near identical trends.


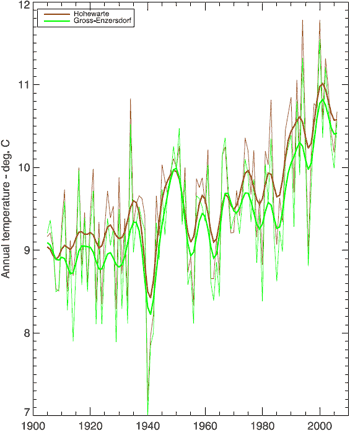
Figure 2: Annual temperature trends for two sites in Vienna – Hohewarte in the center (brown) and the rural location of Grossenzersdorf (green). 

Comparing rural and urban networks in China

So established urban areas show the same trends as surrounding rural areas. What about urban areas that are still developing? China, in contrast to Europe, has experienced rapid economic growth over the last 30 years with a dramatic increase in its city areas. If there were to be significant urban-related warming, it ought to be in this region and over recent decades. Figure 3 compares a range of temperature datasets:


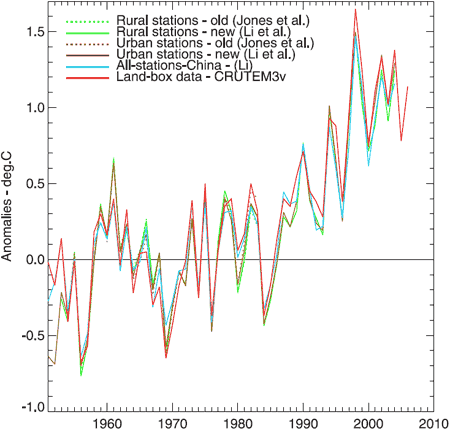
Figure 3: Annual average temperature anomalies. Jones et all (dotted green and brown) is a dataset of 42 rural and 42 urban sites. Li et al (solid green and brown) is a homogenized dataset of 42 rural and 40 urban sites. Li (blue) is a non-homogenized set of 728 stations, urban and rural. CRUTEM3v (red) is a land-only data set (Brohan et al., 2006). This plot uses the 1954–83 base period.

That there are hardly any differences between the six series tells us several things. Small datasets of 40 stations show the same result as the 728 station dataset. In other words, for a region of this size, the average can be constructed from a limited number of sites, implying that for the 728 station network there is considerable redundancy.

As the scale increases, the overall impact of homogeneity adjustments diminishes. This might be a bit heartbreaking for those hard working boffins who spend hundreds of hours pouring meticulously over station data, ensuring the data is all homogenised (but of course, they don't do it just to calculate global trends).

And of course, the most significant finding: the trend is the same for both urban and rural groups over any of the periods. Even in the case of developing urban areas, when averaged out over large areas, urban heat island has little impact on the warming trend.

0 0

Printable Version  |  Link to this page

Comments

Comments 1 to 32:

  1. It's not as simple as that. The link below is aprecis of new work from NASA which ascribes most of the warming this century in California to urbanisation http://www.nasa.gov/topics/earth/features/heat_wave_los_angeles.html
    0 0
  2. From the url in Greg's comment: "They tracked the number of extreme heat days and heat waves from 1906 to 2006. The team found that the average annual maximum daytime temperature in Los Angeles has risen by 5 degrees Fahrenheit (2.8 degrees Celsius) over the past century, and the minimum nighttime temperature has increased nearly as much." The first lines in John Cook's post: "It's well established that urban areas are warmer than surrounding rural areas. However, does Urban Heat Island (UHI) contribute to the global warming trend? Short answer, no." I think for Greg's comment to be relevant, we'd have to see Los Angeles versus rural So Cal or surrounding areas over the last 30 years, rather than an attribution since 1906 when Los Angeles was less urban.
    0 0
  3. Steve McIntyre looks at urban and rural temperature data since 1885 from Peterson www.climateaudit.org/?p=1859 and has a couple of graphs where the two subsets are separated. He has a couple of possibilities for the trend difference.
    0 0
  4. Re #1 Greg's post is incorrect, and highlights the problems associated with careless interpretations of pretty straightforward studies. The url that Greg cites relates to a study of temperatures in Los Angeles. This shows a rise of 2.8 Celcius over the past century. That's a massive rise in temperature. And of course much of it is due to an urban effect in the city. However the analysis of temperature rise associated with global warming (by NASA or the NOAA or the Hadley Centre in the UK, and so on) takes the urban heat effect into account, by either (i) ignoring all urban temperature data sets, or (ii) correcting urban data sets by comparison with surrounding rural data. The SPECIFIC error that Greg makes is in stating that "NASA which ascribes most of the warming this century in California to urbanisation". In fact NASA do nothing of the sort. If one looks at the surface temperature data compiled by NASA for California as a whole, the temperature increase is around 1 - 1.5 oC: http://data.giss.nasa.gov/gistemp In the NASA GISS data, the surface temperature has been corrected for urban effects, either by eliminating the latter or correcting this by referencing with respect to the rural data. The mistake that Greg has made is in taking the massive temperature rise of 2.8 oC for LA reported in the study that he links to, and then assuming/pretending that because NASA ascribe most of this temperature rise IN LOS ANGELES to urbanisation, that this applies to CA across the board. That's simply incorrect, as perusal of the NASA GISS temperature anomaly data indicates (see my link - you can create your own temperature anomaly data there). That's the SPECIFIC error in Greg's post. The more GENERAL error relates to the attribution of global warming to urban heat effects. It's rather obvious that massive attenuation of mountain glaciers and polar ice caps and sea ice, particularly in the Arctic, has ZERO relation to urban heat effects, since these regions are far from urban centres. Likewise the large warming of the ocean surface cannot have any relation to any urban heat effects. We could go back to California and look at this more closely. For example, in Northwestern USA, global warming has seen an extension of the wildfire season since the 1970's, resulting from an earlier onset of Spring (and Spring snowmelt), higher summer temperatures and an extension of the wildfire season into late summer. The greatest increase in wildfires is in the regions with elevations around 2000 metres, where progressively earlier Springs, and earlier Spring snowmelt reduces snow and meltwater protection of timber with respect to wildfire hazard. Once the snowmelt is completed, the forsts are rather quickly prone to combustion. Westerling, et al. (see abstract below) have shown that since the 1970's, global warming has extended the wildfire season by well over two months, with rather large increases in costs and damages. Obvoulsy the earlier Spring, greater summer temperatures, and greatly extended wildfire season in NW CA has nothing whatsoever to do with urban heat effects in LA! Westerling AL et al (2006) "Warming and earlier spring increase western US forest wildfire activity" SCIENCE 313, 940-943. Abstract: "Western United States forest wildfire activity is widely thought to have increased in recent decades, yet neither the extent of recent changes nor the degree to which climate may be driving regional changes in wildfire has been systematically documented. Much of the public and scientific discussion of changes in western United States wildfire has focused instead on the effects of 19th- and 20th-century land-use history. We compiled a comprehensive database of large wildfires in western United States forests since 1970 and compared it with hydroclimatic and land-surface data. Here, we show that large wildfire activity increased suddenly and markedly in the mid-1980s, with higher large-wildfire frequency, longer wildfire durations, and longer wildfire seasons. The greatest increases occurred in mid-elevation, Northern Rockies forests, where land-use histories have relatively little effect on fire risks and are strongly associated with increased spring and summer temperatures and an earlier spring snowmelt."
    0 0
  5. OK, hold on. I lived outside of and worked in LA in the late 90's. At the turn of the century my pipes froze on the roof. I asked why they installed a system without taking freezing into consideration and the answer was it never froze before (within their lifetime). LA was hot (for me at least since I grew up in NY) but the rural areas I found comfortable but my neighbors (native californians) complained it had been getting colder over the years. Why does this not show up in the data from NASA?
    0 0
  6. Re #5 Quietman, I expect that it doesn't "show up" because the NASA data is obtained from measurements rather than from personal anecdotes! In any case Southern California hasn't warmed that much in living memory. Less than 1 oC overall and if one focuses on the winter (when your pipes would have frozen) there hasn't been significant warming in Southern CA at all since the 1930's, for example. All of this does show up in the data from NASA. You can accss this yourself very interactively. Try: http://data.giss.nasa.gov/gistemp/maps/ where you can create your own spatially-resolved maps defining the measured temperature change over any specified period. You can analyze this by month, by season or annually. You'll see that Southern CA has been an oasis of cool during the winter months....
    0 0
  7. chris That at least makes sense. But personal anecdotes based on the known freezing point of water are indeed relavent. The reason so many people do not believe in GW is infact that it isn't global. They see zero warming. I have yet to live in an area that has warmed other than NJ where it was noticable close to NYC. Here in PA there has not been any warming trend. The only way I know it's actually warming is from reading the news on the web. It is a perception issue for most people.
    0 0
  8. PS Measurements differ by point and instrumentation. It is a large planet and I have little faith in the observers or the designer's of their equipment.
    0 0
  9. PPS But photographs of the Arctic and Antarctic do tell a story.
    0 0
  10. Quietman, I have lived in the Alps and I have seen significant difference in the ski season: duration, accumulation, altitude making a ski area viable etc... Wine growers in England do not need news to tell the difference. There are many more examples opposite to your experience. I'm not sure that having more faith in individual anecdotal reports than in observers and their equipment is necessarily wise.
    0 0
  11. Philippe You are missing the point that I was trying to make. By calling this "Global Warming" instead of "Climate Change" the natural reaction for people unaffected is "what warming?" any there are obviously a lot of people in this category. I have heard it called "Climate Shift" also. Shift or Change describes what is happening much better than Global Warming and is accurate. Global means all, the entire planet. But it is not all, not the entire planet and this causes a psycological rejection of the concept.
    0 0
  12. any s/b and
    0 0
  13. Could you please post a link to a copy of the actual method used to eliminate Urban Heat Island effect from the record?
    0 0
  14. You are very selective in your cherry picking. Do you ever research anything or simply mine for what you want the outcome to be?
    0 0
  15. glider Please address your comments. How do we know who you are addressing. Who is cherry picking exactly?
    0 0
  16. One issue about UHI seems to be swept under the carpet...namely they affect weather - not just locally but over quite large distances. Warm air plumes,wind shadows,water vapour additions all serve to change the local microclimate which in turn affects the general conditions. Whilst the thermal data may be adequately corrected for UHI effects, how do you factor in the physical changes caused by the very existence of cities?
    0 0
  17. global warming is caused by bad gas emmitions, not artificial heating of a area. to fight global warming i think every one needs to make green choises. i have a site that tells people about reel mowers and the positive effects. if you are interested here is my link: greenmowers.org
    0 0
  18. Since when did a Gas become bad?
    0 0
  19. I don't know about the results in China, I would have to examine the data set involved, but in the Western US, specifically in more Arid regions...the Urban Heat Island effect has been great (on the order of 10 F increases in annual mean temperature)since 1970, and the number of stations involved is increasing due to Urban Sprawl. NASA has not corrected for this....nor have then excluded Urban areas in their computations. Also please note that they have been greatly overestimating the SST Anomalies over the Pacific by arbitrarily changing the long term mean temperature downward...by close to 1 C. Not a skeptic, just a scientist looking for the truth.
    0 0
  20. >"It's well established that urban areas are warmer than surrounding rural areas. >However, does Urban Heat Island (UHI) contribute to the global warming trend? >Short answer, no. Two thirds of global temperature data comes from ocean records, >free of UHI effect" Let's start with "Two thirds of global temperature data comes from ocean records ..." Looking at http://www.ncdc.noaa.gov/oa/climate/ghcn-daily/index.php?name=coverage It looks like ocean stations comprise the minority of the data. Even if one refers to Hansen, J. and Lebedev, S. 1987. "Global Trendsof MeasuredSurfaceAir Temperature" http://pubs.giss.nasa.gov/docs/1987/1987_Hansen_Lebedeff.pdf and includes shipboard data, it is still hard to account for "two thirds of global temperature data" coming from ocean records. An actual reference list for all that ocean data would really be helpful. I would find it far more credible if the source assertion for ocean temperatures was based on satellite observations rather than surface observations ... Once the actual data source counts can be sorted out, one must then validate that those sources are indeed "free of UHI effect." Specifically, one would need to look a stations in island cities, military bases, and onboard specific platforms. Density considerations are necessary when analyzing instrumentation details on sea going platforms and in coastal installations. I have collected environmental data both on land and at sea, including temperature altitude profile data and bathymetric profile data. When it comes to accounting for UHI, I'd be especially careful to account for it when it's "coming from ocean records." I remain fully skeptical and unconvinced regarding the assertion: "Two thirds of global temperature data comes from ocean records, free of UHI effect. " It would be really useful to overlay geospatial population density, transportation density, and power generation/consumption with respect to the temperature stations under consideration. Shipboard data needs to be corrected for navigational parameters, instrumentation, location and platform type. Finally, going to the Jones et al reference abstract linked in the first paragraph of the blog, one finds "Urban-related warming over China is shown to be about 0.1°C decade−1 over the period 1951–2004, with true climatic warming accounting for 0.81°C over this period." http://www.agu.org/pubs/crossref/2008/2008JD009916.shtml The period spans more than five decades (1951-2004) ... so the UHI effect is 0.5°C. One then examines Jones et al abstract again "Global surface temperature trends, based on land and marine data, show warming of about 0.8°C over the last 100 years." It's not clear from the abstract if Jones et are saying that the total change in their study is (0.81 + 0.5 = 1.3) or (0.81 total). If the first case holds, UHI accounts for 38% of the increase. If it's the latter case, then UHI accounts for 62% of the increase. The question and answer posed by the blog "does Urban Heat Island (UHI) contribute to the global warming trend? Short answer, no" is inconsistent with either case: does it contribute? Yes, either 38% or 62% depending on the case and presuming that the total climatic increase is for the same five decades and not 100 years. If it is for the entire 100 years, then it may well account for the entire change.
    0 0
  21. The increase in urban heat is not only by the natural causes in climate change but the Green house gases are the main cause of global warming. The gases like Carbon dioxide, methane and nitrous oxide are the main hazards to the global warming which are mainly found in the Urban atmosphere than in the less polluted rural areas. Effects of Global Warming
    0 0
  22. But we're only interested in the trends, not the raw temperatures. These analyses work whether the comparison is from tropical, polar, ocean, urban or rural areas. The trend is picked up regardless of the records averaging around -30C or +25C. If an urban area is always or usually a degree or two above a neighbouring rural area, that's fine. What matters is not whether one or the other is higher or lower, but whether the temperature increase or decrease is similar or wildly different.
    0 0
  23. adelady #22 But theoretically increasing urbanisation can cause an increase (or decrease) in the trend independent of the baseline value. I'd be interested in hearing of experimental work of the effect of concrete surfaces of different sizes on temperature maxima and minima.
    0 0
  24. #22 adelady at 18:19 PM on 12 October, 2010 If an urban area is always or usually a degree or two above a neighbouring rural area, that's fine. What matters is not whether one or the other is higher or lower, but whether the temperature increase or decrease is similar or wildly different. Keep in mind each urban area started off as a rural one some time in the past. Let's consider two nearby sites, one is urban the other is rural, the urban one being a degree or two warmer, as you say. If trends are the same at both sites all over their history, even if we go back in time until both sites are found to be equally desolate, the would-be urban site is still a degree or two warmer. How can that be? I bet weather is not endowed with precognition, therefore the only remaining possibility is the urban heat island effect has nothing to do with land use, man made structures and the like but people simply prefer natural hot spots for settlements. Is that what you claim?
    0 0
  25. BP #24 Pretty much a duplicate of my post #23, except you seem to be implying that the effect size must be large and significant, whereas I enquire about the empirical evidence that there is an effect, and what it's magnitude is. See how the two approaches differ? Which do you think is more likely to provide an objectively correct answer in the long run?
    0 0
  26. BP #24 (again) My hypothesis is that the urban heat island effect will cause an increased variance of local temperature rather than an increase in absolute value due to decreased heat capacity and reduction of the capacity of vegetation to buffer temperature changes.
    0 0
  27. And then there's all those arguments I've seen elsewhere about more concrete and other urban land use changes increasing local albedo. There may be particular places where there is a definite effect one way or the other, but the graphs in the post tell us that for these researchers and these regions, the swings and roundabouts have apparently balanced each other.
    0 0
  28. Re: jadesmith (21) CO2 is a well-mixed gas; it's greenhouse effects takes place primarily well above the surface layer, so any localized concentrations near emitter sources get redistributed fairly quickly. See Comment 1 at this thread for some nice animations showing the mixing effects of CO2 over time. The Yooper
    0 0
  29. Thanks for sharing this important information effect of global warming. We should concentrate more on alternative energy to reduce carbon emissions and save the earth.
    0 0
  30. I see how they correct for UHI in the urban areas by using nearby rural areas.  However, a difference in urbanization between city and rural would not skew global warming as much as the difference in urbanization rates between city and rural.  In other words, a city that stays the same size would not give a false global warming effect.  But a rural area that turns into a town that grows to a city would.

    How do the correct for the urbanization of rural areas? 

    0 0
  31. I dont think I understand your point at all. A rural area that has become urbanized is no longer "rural" for the purposes of correcting the record and cannot be used for such. I highly recommend that you read some of the detailed methodology. Eg Hausfather et al, 2013

    0 0
  32. EE

    Your right that it is a change in the local characteristics of a site that can potentially skew the results.

    How do they corrrect for this changing? Hopefully the metadataassociated with each station is updated as any such change occurs.

    Also, the GHCN dataset that is used as the basis for some of the temperature products uses an automated pairwise adjustment method, contrasting nearby stations with each other to look for unusual variations in any station.

    The data set produced by NASA GISS goes further. They use satellite data about lights at night to estimate degree of urbanisation, independent of station meta data. So any evolution of a site from rural to urban, at least in the satellite era can be detected.

    0 0

You need to be logged in to post a comment. Login via the left margin or if you're new, register here.


The Consensus Project Website

THE ESCALATOR

(free to republish)


© Copyright 2024 John Cook
Home | Translations | About Us | Privacy | Contact Us