


 Arguments


Recent Comments
Prev 1727 1728 1729 1730 1731 1732 1733 1734 1735 1736 1737 1738 1739 1740 1741 1742 Next
Comments 86701 to 86750:
-
Bern at 20:42 PM on 22 May 2011Skeptical Science Educates My Students
chris1204: I think the point Tom Curtis is making, is that while it is important that students learn *about* Aristotle and similar contributors to the early bodies of science, you wouldn't want to teach some of Aristotle's now-discredited hypotheses as to how the physical universe works. At least, not in a standard physics class, where you're trying to educate students as to how the world actually works, to the best of our current scientific knowledge. Perhaps in a class looking at the history of physics, though. -
chris1204 at 20:34 PM on 22 May 2011Skeptical Science Educates My Students
Tom Curtis @ 33: So nothing taught today in science classes is based on a priori considerations? I'm sure Aristotle as a true philosopher or lover of knowledge would be utterly delighted to see his physics overturned by Newton, Einstein, and the proponents of quantum physics. The scientist who is ignorant of Aristotle and his contributions is a scientist impoverished. The Aristotelean corpus above all trains the student in the analysis of argument and an assessment of internal and external consistency. The student need not explicitly affirm his or her dependence on Aristotelian antecedents so long as s/he knows how to use them well. Understanding logic as opposed to rhetoric lie at the core of the scientific method. -
Tom Curtis at 20:02 PM on 22 May 2011Skeptical Science Educates My Students
chris 1204 @30, you don't need to teach a double major in philosophy who Plato and Aristotle are. But nor do you need to teach me that Aristotle's physics was based primarily on a priori considerations, and that it has been definitively refuted by experimentation since Galileo's experiments. Aristotle, therefore, has no place in the physics class room, unless, of course, your purpose is not to teach science but to sow confusion. Likewise, Creationism has had no place in the class room since the 19th century; and AGW denialism has had no place since about 2000. (Some AGW denialist theories have never had a place, because they are out right contradictory, or simply pseudo-scientific.) I would add that no self-reflective scientist would want their theories taught in the class room until they have taught a majority of their peers of the validity of those theories. Those peers are experts in the most important sense of the word, they know how to avoid all the basic mistakes in the subject. Therefore, if they are not persuaded, it is probably because of a genuine mistake in the novel theory. In contrast, it is patently obvious that children, even teenagers do not have the mental tools to objectively assess complex theories. Even undergraduates are normally just developing those tools, and an undergraduate course will not be able to provide even a significant fraction of the relevant information. Clearly high school students and undergraduates are non-expert in the most important meaning of that term. They are likely to make fundamental errors, and therefore to be easily persuaded to make those errors if confronted with false theories in the class room. Any scientist who wants to persuade children where they cannot persuade their peers is seeking all the rhetorical advantages of indoctrination over honest persuasion. -
Tom Curtis at 19:36 PM on 22 May 2011Skeptical Science Educates My Students
Dikran Marsupial @31, the worst feature of debates is that time is allocated, in a debate, equally between both parties. In journals, in contrast, space is allocated in proportion to the evidence that can be adduced in favour of a position. That is why denier view points are almost entirely absent from journals, but every where purveyed in public "debates". -
Dikran Marsupial at 19:30 PM on 22 May 2011Skeptical Science Educates My Students
Stephen Baines@28 You are absolutely right, a debate would be a very poor way to resolve a scientific issue, and science discovered that a long time ago (which is why science is now pushed forward via journals rather than public debates). The reason why it is a bad idea is that debates are won by rhetoric and oratory, not necessarily by truth. Debate favours the quick-witted, rather than the deep-thinker. Science needs deep thinkers more than it needs a ready wit (although some have both). Organising such a debate in a science lesson may be enjoyable for the students, but would be profoundly counter-productive if the aim was to give the students an idea of what science is about. It is a search for the truth, it isn't about "winning". -
chris1204 at 18:44 PM on 22 May 2011Skeptical Science Educates My Students
Tom Curtis @ 25: It's a shame your teachers didn't mention Aristotle who together withPlato remains the bedrock of philosophy and especially logic and without whose contributions much of modern science would very likely not have emerged. Of course, Aristotle’s thinking was limited by the primitive state of scientific knowledge of his day. Significantly, Sir Isaac Newton for all his insights into modern physic had his own raft of odd idea (at least by the standards of today). It would be fascinating to see what our descendants might make of some of our more treasured notions a mere two hundred years from today. -
JMurphy at 18:40 PM on 22 May 2011Skeptical Science Educates My Students
I'm amazed that anyone can seriously believe that a debate can determine the validity of any science. That is the sign of someone who knows the science is against them, so wants to be able to rely on debating skills - knowing, particularly, that those who work in the sciences are hardly the best at communicating and/or debating against ideological polemicists. Presumably, if h pierce had his way, there would be a debate and vote on Evolution in America, thereby leading to its dismissal and replacement in education establishments (if opinion polls are true) by some form of Creationism. -
Riccardo at 17:48 PM on 22 May 2011Wakening the Kraken
These are the weapons of the Kraken ... -
Riccardo at 16:48 PM on 22 May 2011Climate sensitivity is low
RW1 immagine a light source and a absorbing medium. A transmission experiment will give you the fraction of light passing through the medium along the line connecting the source and the detector. On the contrary, the light eventually re-emitted by the medium has no preferential directions. You should not expect the transmittance to saturate at 0.5. -
RW1 at 16:02 PM on 22 May 2011Climate sensitivity is low
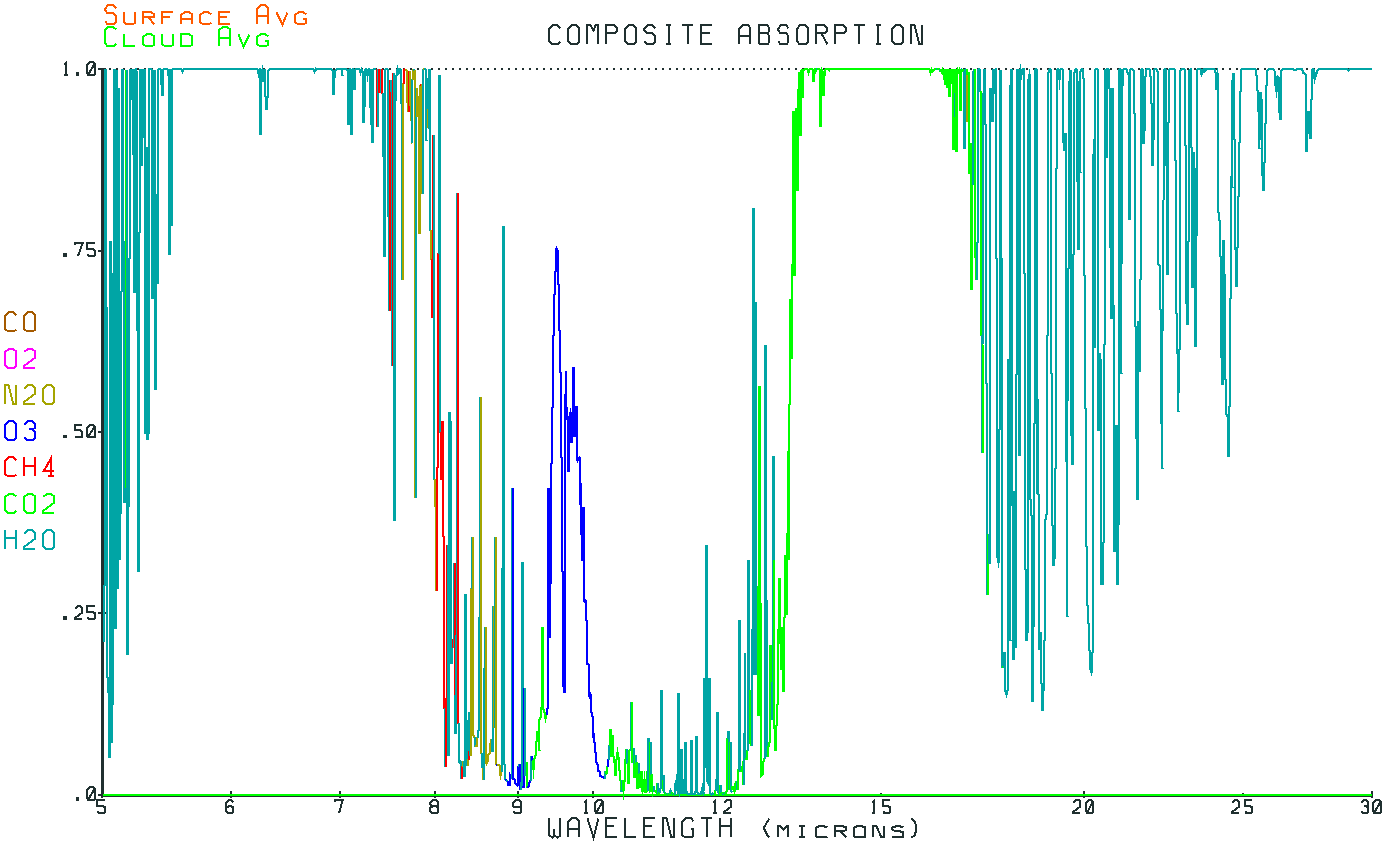
Here is the composite absorption with the emitted energy spectrum (grey line), which gives 255K. You can see that where the wavelengths are completely saturated (i.e. the 15u band of CO2), the transmittance is zero. If the halving effect was included, the maximum for the saturated bands would be only 0.5 and not zero: Click -
RW1 at 15:45 PM on 22 May 2011Climate sensitivity is low
Here is another showing which gases are most responsible for absorption at various wavelengths: Click -
RW1 at 15:36 PM on 22 May 2011Climate sensitivity is low
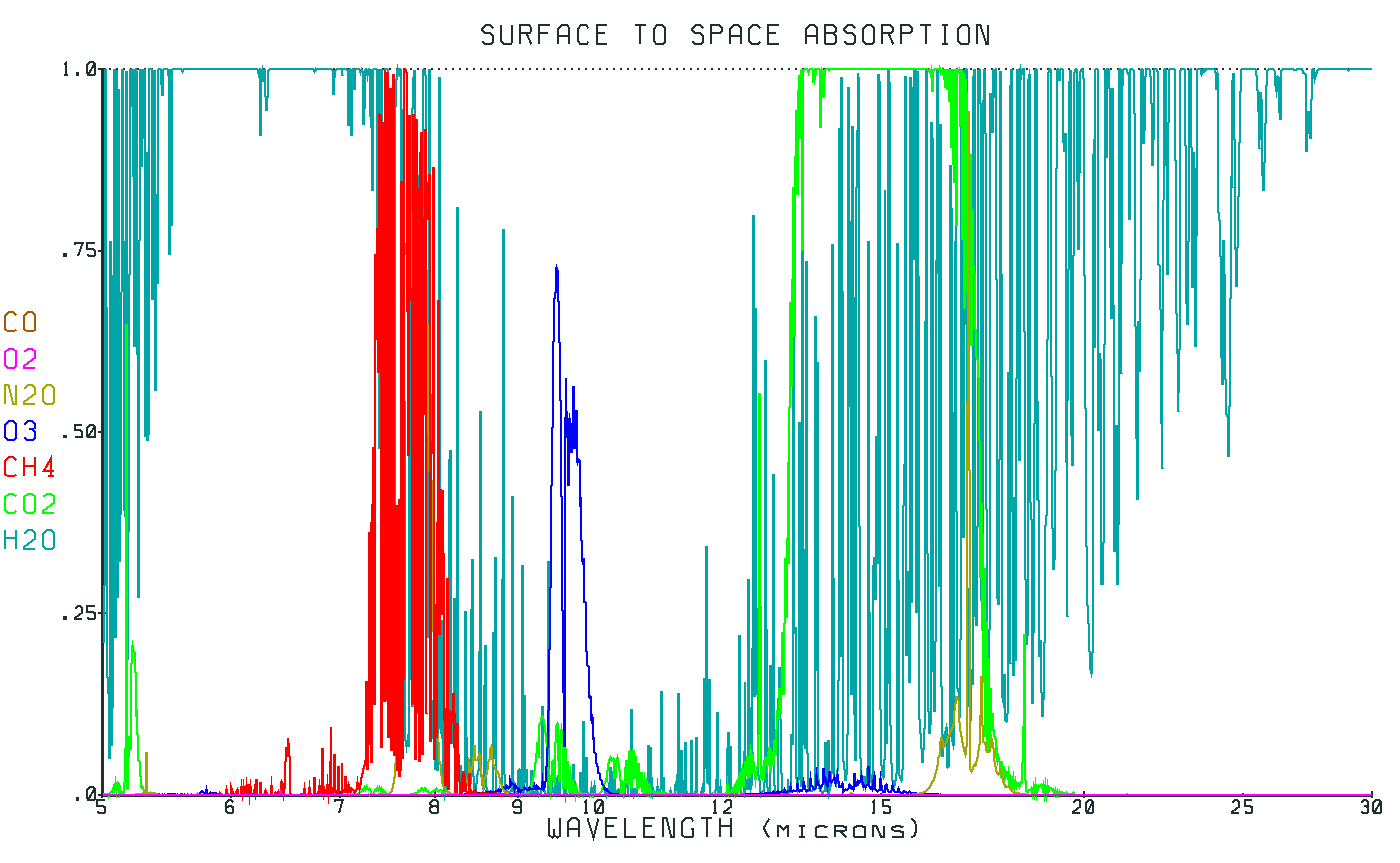
A brief follow up: I've spent quite a bit of time emailing around the climate science community on this. None of the scientists I've communicated with seem to know much about it, and appear to have more or less just accepted the number with little (if any) thought. I'm still pursuing the issue with one of them in particular though. Meanwhile, GW has given me the details on the simulations he's done and I see no indication that he's incorrectly interpreting the results as claimed here. For example, this is plot of the clear sky absorption spectra he used, where each gas is represented by a different color. The Y axis is the amount of emitted surface power absorbed by the atmosphere. You can clearly see that the line by line transmittance is 1 minus the value. If the half up/half down effect was included, the maximum value would be 0.5 and not 1.0, because even if 100% is absorbed, half is emitted to space anyway: Click -
Stephen Baines at 15:22 PM on 22 May 2011Skeptical Science Educates My Students
"He could arrange a debate on AGW where the "Against Team" challenges the "For Team". After the debate, he could have the audience vote on the performance of the teams." Ive been trying to think about why this idea as formulated struck me as particularly bad. I mean, I'm all for democracy and having open debate. I think it comes down to two things. First, a debate should never be structured as "For" and "Against." The latter position is so much easier to maintain - you just have to sew doubt, while the other side must defend against every competing idea around, no matter how nutty. Sounds familiar. Second, public debates are actually very poor analogs for what happens in science. They are too defined in time, and in structure. As a consequence, their outcome hinges too much on rhetorical and dramatic skills of the debaters, the predispositions of the audience, and the terms of the debate. None of those have much to do with evidence. In science, the setup is actually quite different. A group of people work on a related set of problems for an indefinite period of time. Useful ideas survive and become part of settled science while non-useful ideas don't. Personality can play a role, but only temporarily. That's because scientists are not presenting evidence to a bunch of naives who aren't vested in whether their judgement is correct. Rather they are sharing with colleagues who often know as much or more about the evidence. That enforces a strict focus on the evidence, as artifice will be found out. If your colleagues accept an idea, it's because that idea has enough validity to be useful to them in future investigations. They are vested in making good decisions about which idea is wrong or right. I wonder how one could create something more akin to the activity of science in the classroom. -
Leland Palmer at 15:19 PM on 22 May 2011Wakening the Kraken
Here's another recent paper, which uses a state of the art atmospheric chemistry model to predict much stronger positive feedback from indirect atmospheric chemistry effects of large methane releases, than from the methane itself. They are talking about several hundred percent increases in stratospheric water vapor, for example, increased methane lifetime of roughly 100 percent for very large releases, and large increases of tropospheric ozone. The hydroxyl radical, by their modeling, decreases in the troposphere, where it is needed to oxidize methane, and increases in the stratosphere. The positive feedback factor that they calculate (eta) ranges from 1.5 for small releases, up to 2.9 for large ones. Strong atmospheric chemistry feedback to climate warming from Arctic methane emissionsHere we apply a “state of the art” atmospheric chemistry transport model to show that large emissions of CH4 would likely have an unexpectedly large impact on the chemical compositioof the atmosphere and on radiative forcing (RF). The indirect contribution to RF of additional methane emission is particularly important. It is shown that if global methane emissions were to increase by factors of 2.5 and 5.2 above current emissions, the indirect contributions to RF would be about 250% and 400%, respectively, of the RF that can be attributed to directly emitted methane alone.
It's a very important result, IMO, which could provide a bridge from mild CO2 based warming to runaway methane and atmospheric chemistry change based greenhouse heating. It's a very different atmosphere that they are talking about, with sustained methane release rates of 4 to 13 times those of today. Stratospheric water vapor and stratospheric hydroxyl radical increase, tropospheric hydroxyl radical decreases, and tropospheric ozone increases, leading to indirect warming several times that of the warming from methane itself. It's particularly worrisome because this appears to be an honest result, resulting from a fair query of a state of the art atmospheric chemistry transport model. If this work holds up, it may help explain the strong positive feedback of past apparent methane catastrophes including the Paleocene-Eocene Thermal Maximum and the End Permian mass extinction, I think. -
Leland Palmer at 15:05 PM on 22 May 2011Positive feedback means runaway warming
Here's another recent paper, which uses a state of the art atmospheric chemistry model to predict much stronger positive feedback from indirect atmospheric chemistry effects of large methane releases, than from the methane itself. They are talking about several hundred percent increases in stratospheric water vapor, for example, increased methane lifetime of roughly 100 percent for very large releases, and large increases of tropospheric ozone. The hydroxyl radical, by their modeling, decreases in the troposphere, where it is needed to oxidize methane, and increases in the stratosphere. The positive feedback factor that they calculate (eta) ranges from 1.5 for small releases, up to 2.9 for large ones. Strong atmospheric chemistry feedback to climate warming from Arctic methane emissionsHere we apply a “state of the art” atmospheric chemistry transport model to show that large emissions of CH4 would likely have an unexpectedly large impact on the chemical compositioof the atmosphere and on radiative forcing (RF). The indirect contribution to RF of additional methane emission is particularly important. It is shown that if global methane emissions were to increase by factors of 2.5 and 5.2 above current emissions, the indirect contributions to RF would be about 250% and 400%, respectively, of the RF that can be attributed to directly emitted methane alone.
It's a very important result, IMO, which could provide a bridge from mild CO2 based warming to runaway methane and atmospheric chemistry change based greenhouse heating. It's a very different atmosphere that they are talking about, with sustained methane release rates of 4 to 13 times those of today. Stratospheric water vapor and stratospheric hydroxyl radical increase, tropospheric hydroxyl radical decreases, and tropospheric ozone increases, leading to indirect warming several times that of the warming from methane itself. It's particularly worrisome because this appears to be an honest result, resulting from a fair query of a state of the art atmospheric chemistry transport model. If this work holds up, it may help explain the strong positive feedback of past apparent methane catastrophes including the Paleocene-Eocene Thermal Maximum and the End Permian mass extinction, I think. -
muoncounter at 13:26 PM on 22 May 2011Skeptical Science Educates My Students
hpierce #24: "make available to the students the sources of all points of views on the topic" Yes. Teach both sides; let the students decide. Where have we heard that before? The 'debate' and subsequent vote between 'magic' and 'physics' should be quite entertaining.
-
Albatross at 12:56 PM on 22 May 2011Skeptical Science Educates My Students
Tom @25, Excellent points. Likely lost on the confusionists though. And I second Daniel's request @ 24 for h pierce to apologize to Prof. Mandia. The contrarians have nothing and it is showing. -
sailrick at 12:02 PM on 22 May 2011New SkS graphic: the Respiration Carbon Cycle
Shouldn't the graphic include water as part of the active carbon cycle? -
Tom Curtis at 11:15 AM on 22 May 2011Skeptical Science Educates My Students
h pierce @24:An honest instructor should make available to the students the sources of all points of views on the topic, and then let them form their own conclusions and opinions.
Really? In grade 11 when my physics teacher was teaching my Newtonian laws of motion, and Newtons law of universal gravitation, not once did he bring out an Aristotelian. He did not bring out any geocentrists or flat earthers either. Did that make him dishonest? And why do you limit yourself to "both points of view"? There are at least five or six distinct theories presented by various kooks in opposition to evolution. There are about as many distinct denier theories on climate. But, revealingly, all lose any desire to criticize each other when a chance to attack climate scientists is in the offing. What you mean by an "honest instructor" is simply a person who will uncritically feed pseudo-science to their students without distinguishing it from the genuine article, taking great care, of course, to not give the students the critical skills needed to distinguish between the two. -
h pierce at 11:02 AM on 22 May 2011Skeptical Science Educates My Students
DB at 3 An honest instructor should make available to the students the sources of all points of views on the topic, and then let them form their own conclusions and opinions. He could arrange a debate on AGW where the "Against Team" challenges the "For Team". After the debate, he could have the audience vote on the performance of the teams. ( -Off-topic and inflammatory snipped- ).Response:[DB] "An honest instructor"
A truly appalling way to begin a comment. While that may be de rigueur in your usual venue of choice, the insinuation of dishonesty you make here is a violation of the Comments Policy.
An apology to Professor Mandia should be in the offing.
-
Tom Curtis at 09:49 AM on 22 May 2011Most of the last 10,000 years were warmer
Adelady @14"Why would sustained, slower, less spectacular, releases of aerosols have different physical characteristics?"
Because it is convenient for some to believe so, of course. -
Chris Colose at 09:48 AM on 22 May 2011Skeptical Science Educates My Students
apiratelooksat50, with respect: Your post #12 is backwards. Professionally, these aren't controversial subjects. Personally, they are. This is what separates a proper scientific education from teaspooning some odd sense of democratic sensibility into our youth, and letting them think that "all opinions" are equal. It's also what separates first-rate education at top research universities from second-rate education typical of elective meteorology courses at a community college. This is where Scott Mandia and his class is a strong exception, and I like that. But my textbooks in climate and atmospheric radiation never came with a disclaimer saying "this is all a theory" as some anti-science groups demanded happen to evolution texts. This isn't to say that I agree with the indoctrination of students into a particular world view; rather, a proper evaluation of the relevant physics (or in the case of evolution- the biochemistry, genetics, geological evidence, etc) will inevitably lead the student to the right answers, or in the case of real skepticism, actually learning to ask the right questions. I am of the perspective that teaching someone how something works is better than teaching them what is wrong with 50 fallacious arguments. The latter is how SkepticalScience is set up, which is fine. For some reason, when it comes to climate change and evolution, the latter is sometimes the more efficient setup for educating the casual reader. Furthermore, any real education will give the student a good perspective on the things which are well-known (like the validity of Planck's law) and those things which aren't too well-known (like the magnitude of cloud feedbacks). Teaching something like "anthropogenic global warming," which is not really a theory in itself, but a consequence of many different lines of physics, as intrinsically "controversial" is just doing an injustice to your students and the subject. People pay tuition for a reason, you know. -
Tom Curtis at 09:46 AM on 22 May 2011Most of the last 10,000 years were warmer
NikFromNYC @ 10: 1) The "very misleading" graph shows the actual temperatures as the GRIP site with the small crosses, and the anomaly relative to the GISP2 core with the higher of the two horizontal lines. This can only be misleading to those who read neither the information on the graph, nor the article, which states immediately below the graph:"The GISP2 series — the red line — appears to be identical to Easterbrook’s version. The bottom black line shows his 1855 “present”, and it intersects the red line in the same places as his chart. I’ve added a grey line based on the +1.44ºC quantum calculated from the GRIP temperature data, and two blue crosses, which show the GISP2 site temperatures inferred from adjusted GRIP data for 1855 and 2009."
It is hard to be clearer than that. Further, to be "mislead", a reader would have to also ignore the information in the graph plotting the temperature change at the GRIP site from 1855 to the present. 2) The clarity and openness with the information in the above article contrasts sharply with the practise of deniers. They either treat the temperature rise evident in the GISP2 core just prior to 1855 as the 20th century temperature rise (as does Easterbrook), or add a bar representing global temperature increase from (typically) 1905. The global temperature increase is significantly smaller than the local temperature increase, and comparing the two is inevitably misleading. Curiously, you find neither of those practises misleading, but find a clear debunking of the worst of them to be misleading because it clearly presents the relevant data. You must be using some non standard definition of "misleading" such as "shows my views on climate to be a house of cards". 3) In addition, Easterbrook's graph is is misleading because it treats a regional temperature index as a global temperature index. As just noted, regional temperatures have greater fluctuations in temperature than do global temperatures; a consequence of the fact that regional temperatures do not vary in synch. As can be seen from this graph of Holocene temperature proxies, regional temperature vary widely, but their average shows little variability: Indeed, the GISP2 record (light blue on the chart) shows more variability than most regional proxies, a fact that should be well known to any frequent commentator on climate. Even the average on this chart probably shows more variability than the true global mean temperatures because of the low number of proxies, and because the proxies in this chart have a Northern Hemisphere bias (with half the the proxies coming from the NH extratropics).
As clearly indicated on the chart, 2004 temperatures are significantly above the average of even the Holocene Warm Period.
Of course, it is rather difficult for you to comment on Easterbrook's misleading practise of treating a regional temperature proxy as a global record given that you do the same thing in your comment.
3) It is a bit rich you commenting on "misleading ... debunking[s]" when you claim that "If you actually match up the 1855 temperatures, as any sincere effort would require, you get exactly what skeptics claim history is like: a just as hot MWP and a hotter Roman period." As can be clearly seen from your plot, modern regional temperatures on the Northern Greenland ice cap are about as much warmer than the MWP as they are cooler than the Roman WP at that location. And honest description, then, would be that modern temperatures are hotter than the MWP at that location, though the Roman WP was hotter, at that location.
Indeed, the GISP2 record (light blue on the chart) shows more variability than most regional proxies, a fact that should be well known to any frequent commentator on climate. Even the average on this chart probably shows more variability than the true global mean temperatures because of the low number of proxies, and because the proxies in this chart have a Northern Hemisphere bias (with half the the proxies coming from the NH extratropics).
As clearly indicated on the chart, 2004 temperatures are significantly above the average of even the Holocene Warm Period.
Of course, it is rather difficult for you to comment on Easterbrook's misleading practise of treating a regional temperature proxy as a global record given that you do the same thing in your comment.
3) It is a bit rich you commenting on "misleading ... debunking[s]" when you claim that "If you actually match up the 1855 temperatures, as any sincere effort would require, you get exactly what skeptics claim history is like: a just as hot MWP and a hotter Roman period." As can be clearly seen from your plot, modern regional temperatures on the Northern Greenland ice cap are about as much warmer than the MWP as they are cooler than the Roman WP at that location. And honest description, then, would be that modern temperatures are hotter than the MWP at that location, though the Roman WP was hotter, at that location.
 Of course, globally, both where probably warmer than the 1950's, but cooler than the last decade.
-
citizenschallenge at 09:37 AM on 22 May 2011Book reviews of Climate Change Denial
Yippy my copy showed up today. I've read through chapter 2 and am impressed. Well written! Thoughtful and I'm looking forward to digging into the next chapter's deconstructing of the five types of denial arguments. It'll come in very handy. Very nice clean formatting, enough references to keep me reading from here to eternity. Thanks for all the effort you folks put into it. -
adelady at 09:25 AM on 22 May 2011Abraham reply to Monckton
Kane. You might have time to watch an occasional video presentation. There are 3 here at Fool Me Once And this is the first of 4 items on Monckton's presentations at Potholer. -
Paul D at 09:12 AM on 22 May 2011Skeptical Science Educates My Students
apiratelooksat50 "Anytime I teach a controversial subject such as AGW or evolution.." Erm, they aren't controversial. Or rather any controversy is not universal. It maybe controversial in the US, which is rapidly losing any direction due to internal extremism, but it isn't very controversial in the UK. -
adelady at 09:12 AM on 22 May 2011Most of the last 10,000 years were warmer
Nik, aerosols "They might not have any truly discernible and certainly not modelable cause at all.." I realise your response slipped straight over to models and maths and never got back to the physics. But I'm still concerned about the physics and observable responses to aerosols. Just looking at the histories of calamitous volcanic eruptions near the equator which spread dust and all manner of gunk across the skies worldwide. We know from written records about the effects on temperatures, colder, and agriculture, ruinous, of these events. Why would sustained, slower, less spectacular, releases of aerosols have different physical characteristics? -
David Horton at 09:04 AM on 22 May 2011Roy Spencer’s Latest Silver Bullet
Whenever I read about Spencer's stuff the same simple (I think) unanswered question always comes to me instantly. If there is a "silver bullet" which will prevent increasing ghg emissions from warming the planet - why didn't it operate in the past? -
Alexandre at 07:40 AM on 22 May 2011Skeptical Science Educates My Students
Harry Seaward at 01:24 AM on 22 May, 2011 says Pirate's post begs a question: what if the student decided the skeptic argument was valid? What if a student "decided" (interesting choice of words) Beer-Lambert's Law, or Planck's Law was wrong? Well, he could be a genius, but chances are on the side of his being just a pranck trying to draw attention to himself. Anyway, if you "decide" established science is wrong, be prepared to back your assertions with very good data. Better data or better explanation of the data than the previous theory. -
NikFromNYC at 07:01 AM on 22 May 2011Most of the last 10,000 years were warmer
"if it wasn't the aerosols, how do you account for the physics of excluding them" They might not have any truly discernible and certainly not modelable cause at all if in fact climate represents a chaotic system on century time scales. And what system might be less expected to be prone to chaos than a huge land/air/ocean biosphere subject to solar output and orbital variations? The argument from ignorance of "forcings" is thus even less supportive of CO2 as the only alternative than I had thought. Forcings might not even be required if suddenly the ocean currents shift drastically to alter now heat is released or withheld by them for a century or two at a time. There's too many formal mathematical Platonists in climatology and not enough dynamicists, I suggest. It's assumed that weather is chaotic, but why not climate too? I suddenly have a hilarious vision of a watchmaker riding a bull. -
Stephen Baines at 05:03 AM on 22 May 2011Skeptical Science Educates My Students
JMurphy. Don't generalize to broadly about american education from someone posting on a general public blog about climate science! That said, I know people in certain parts of the country who, even at university level, feel pressure to "teach the controversy," despite the fact that there is none on scientific grounds. It's a trend that blurs the lines between "current events" curricula and science curricula. I can see nothing good coming of it, at least in this manifestation. But, people often surprise me. -
Camburn at 04:45 AM on 22 May 2011Antarctica is gaining ice
Because of errors in Grace data extrapolation, it has been determined that the ice mass on Antarcica is neither shrinking nor growing. So, no net change there.Response:[DB] Umm, you seem to be confused. Please read the OP and the comments, with particular attention to Ned's comment at 30 above. If still unsure, try the Intermediate version of this post. The totality of Antarctica (the Antarctic Peninsula, the WAIS and the EAIS) are all losing mass, beyond that of the error bars. And the rate of mass-loss is itself increasing.
-
Ari Jokimäki at 04:30 AM on 22 May 2011Roy Spencer’s Latest Silver Bullet
It should be noted that Spencer's inclusion of OHC down to 2000m doesn't fix the problem. Recent research has shown that there's significant amount of warming in the very deep ocean (below 2000m). -
JMurphy at 04:19 AM on 22 May 2011Scientists tried to 'hide the decline' in global temperature
Indeed, Rosco - as Tom Curtis points out, do you have your graphs mixed up ? Whichever you intended, I can't recall the media "sensation" you mention. Do you have any examples you can link to ? But, some questions : What propaganda or message do you believe the IPCC were supposedly trying to put out "at the time" ? (You can respond here) How can the IPCC have been trying to validate anything "for decades" ("deceptively" or not) when it only began in 1988 ? (You can respond via the above link) What examples can you give, in the real world, of this "huge backlash" ? (You can respond here) When do you believe that the term "global warming" was dropped for the term "climate change" ? (You can respond here) What is the "consistent" 'sceptical' "point of view" ? (You can respond here) Finally, can I tell you what I think is "more corrupt to the public" ? Corruption. -
dana1981 at 04:16 AM on 22 May 2011Roy Spencer’s Latest Silver Bullet
Great post, Barry. Spencer seems to be forming a pattern of making faulty modeling assumptions which happen to give him the answer he's looking for. -
Stephen Baines at 04:00 AM on 22 May 2011Abraham reply to Monckton
KaneWilliams at 88 I coudn't disagree more strongly. You (and others) should listen to the slide in Abraham's talk more carefully. It's a good indication of how wrongheaded Mockton's criticisms of Abaraham are. Abraham said that Monckton modified a graph from Hathaway and, by adding lines to it that emphasize the long term increase in solar radiation after the Maunder Minimum in the 1700s, used it to argue that warming could be caused by long terms variation in solar energy. I think that's a fair assessment of Mockton's intent with that graph. Abraham then contacted Hathaway to get his sense of whether it was appropriate to interpret his data in the way Monckton has. Hathaway said no. Specifically, in his email he said solar variability is not a major driver of climate - el Nino, GHGs and aerosols from volcanoes are more important (slide 94 of Abraham's presentation). That statement cuts right to the core of Monckton's argument since it suggests that long term increases in solar flux are not relevant to climate in the way Monckton suggests. Of course, that is only the first step in Abraham's argument. He then goes on to point out many papers showing that the science is in unform agreement that solar variation have contributed little if anything to the recent warming over the last 40 years. This context is directly pertinent to Mockton's argument, but not provided by Monckton. Monckton certainly has the right to interpret that graph from Hathaway anyway he wants. And Abraham has the right to point out that Monckton has not provided a lot of relevant information that may alter our assessment of his positions. We are then allowed to draw our conclusions. That is what scientific debate is about. As for Abraham's tone, if all reviewers were as civil and fair as Abraham was about this, my life as a scientist and editor would be a lot easier! Most reviewers would be absolutely livid at Mockton's repeated failure to acknowledge large bodies of literature and to twist interpretations of the original work. Scientist are not allowed the privelege of only aknowledging those pieces of evidence that agree with our position. As has been pointed, Monckton has been far less civil in his responses to Abraham as well, not to mention in his suggestions of conspiracy. In my opinion, critizing Abraham for lack of fairness and civility in this case is kind of like criticizing the victim of a mugging for using his/her face to hit the mugger's fist. -
Peter Bellin at 04:00 AM on 22 May 2011Skeptical Science Educates My Students
I think this is a good model for a course directed at students generally. The skills learned can be expanded to other 'controversies' such as the value of immunization. I would love to see this course developed for a Moodle (online) environment, publically available, for other educators to copy and model for their own use. Moodle allows easy use of the internet, video, etc. in the course material. I would like to work with faculty interested in teaching the science, not the false controversy, of climate change. Can we develop a course that can be public domain? How about a series of courses that touch on climate change and its impacts? -
JMurphy at 03:57 AM on 22 May 2011Skeptical Science Educates My Students
Is apiratelooksat50 showing an example of the type of teaching now going on in American schools (where evolution and creationism, AGW and denialism have to be taught side-by-side in science classes) ? If so, I am aghast. How will American children, being taught in this way, be able to develop any form of scientific method ? It is faith-based thinking gone mad. -
Albatross at 03:54 AM on 22 May 2011Abraham reply to Monckton
When Kane first posted here, their post hinted at concern troll-- and their link to the disinformer blog WUWT did not help. I did not jump in right away, as I wanted to see how things progressed. Sadly my suspicions have been confirmed. -
JMurphy at 03:52 AM on 22 May 2011Abraham reply to Monckton
Come off it, KaneWilliams - you may see nothing wrong with Monckton using that particular graph (and a reference to an IAU conference, alongside clearly denialist views about the sun's impact on our climate) and implying support from that graph (and conference), in order to try to bolster the scientific case for his nonsense. He's very good at implying and creating associations, without actually stating the facts : in fact, he makes up his own 'facts' and tries to use the work of others to fit in with his own agenda, thereby misleading the credulous and the naive, while denying having actually intentionally creating any such implicit associations. The only manipulation going on here is being carried out by Monckton and the way he tries to broadcast his propaganda. Don't be taken in by it - stick to the views of the scientists, not the propagandists. -
les at 03:51 AM on 22 May 2011Skeptical Science Educates My Students
ProfMandia - very good. Not on only from the perspectives you describe - but your students are fortunate to be guided through what 'debate' looks like, sometimes, in the public sphere, compared with the world of science etc. e.g. apiratelooksat50 "Personally, evolution is not controversial. Professionally, it is." It may be like the dark ages where public opinion goes bad! So, ProfMandia, I'm very glad you're not confusing your students by bowing to this silly trend of agreeing that evolution, AGW etc. are scientifically controversial! -
Albatross at 03:51 AM on 22 May 2011Skeptical Science Educates My Students
apirate@15, You are going to have to do much better than that. Empty rhetoric does not advance argument, whatever that may be. -
apiratelooksat50 at 03:28 AM on 22 May 2011Skeptical Science Educates My Students
Skywatcher @ 13 You're right, climate change theory is not controversial. Anthropogenic climate change theory is certainly controversial. -
ProfMandia at 03:28 AM on 22 May 2011Skeptical Science Educates My Students
The course outline clearly shows how the content is developed for the course. Natural climate forcing is carefully explained as well as human climate forcing. There is no controversy about evolution and there is no controversy about what is causing most of the modern day global warming. You do not need to take my word on that because there is overwhelming evidence and scientific consensus. Where there is a debate is which solutions and policy choices we need to make and that is clearly where students will make up their own minds after presented with choices. I chose this particular assignment to illustrate the various myths that are prevalent on the web and in books but do not appear much in the peer-reviewed literature. This site does a very good job of carefully explaining why these myths are not accurate and how the scientific method is used to show the holes in these arguments. This is one assignment and not a representative catch-all for the entire course. It is not wise to judge the entire course based on this blog post. :) Their weekly HW assignments were also illuminating. Each week they had to do a Google News search, find a climate change-related article, and explain the content while also relating that content to what was learned in class. Frequently they found very scientifically-weak articles and then proceeded to show why the "science" was wrong. Given that these students are freshman and non-science majors, I was quite impressed. -
skywatcher at 03:24 AM on 22 May 2011Skeptical Science Educates My Students
Seeing as the fundamentals of the theory of climate are not controversial, and validated many times over, it would be very hard to grade a student highly that considered one of the main skeptic arguments valid. One of the reasons would be that they would have to come to this conclusion without the support of the peer-reviewed literature, and therefore would not have done their research properly. 'Controversy' in climate theory is limited to such questions as 'will the warming be bad, very bad or horrific for modern civilisation as we know it'?, or 'will the Arctic be September sea ice-free in 2020, 2030, or as late as 2050'?, or 'Will doubled CO2 lead to a 2C, 3C or even a >4C rise in temperature?' The problem with these questions is that although there is room for 'controversy' (really just valid scientific debate), the underpinning basics of climate theory are entirely sound, and there is not room for people with the view that everything will be just fine if we continue BAU... -
apiratelooksat50 at 03:16 AM on 22 May 2011Skeptical Science Educates My Students
JMurphy@11 Personally, evolution is not controversial. Professionally, it is. -
JMurphy at 03:09 AM on 22 May 2011Skeptical Science Educates My Students
apiratelooksat50, do you really think that evolution is "controversial" and that your students should be able to form their own opinions about it ? -
Camburn at 02:59 AM on 22 May 2011Skeptical Science Educates My Students
To look objectively at AGW, one must look at all the science. The little presented on this site is informative, but deffintely not the defintive source of knowledge. There is a lot more to climate than the level of co2 in the atmosphere. I don't know if we will ever be able to quantify all the variables, and their relationships. I would hope that Prof Mandia understands this when he is teaching. I would also hope that the use of this site encourages students to broaden their knowledge of understanding as to the uncertainty that we are at the present time. -
KaneWilliams at 02:53 AM on 22 May 2011Abraham reply to Monckton
Thanks JMurphy I had seen those links, although not read through them in their entirety. I have heard Monckton say that Abraham's 83 page assignation of his talk does indeed make him sound bonkers and that he has misrepresented other's scientific studies, but that is only because Abraham has cleverly twisted and misquoted what he actually said. One example is states Abraham claimed he said in his presentation that David Hathaway concluded that Solar activity is the dominant cause for global warming, when in fact all he did was use a graph produced by David Hathaway and drew his own conclusion from the graph, never once stating that this is the conclusion reached by Hathaway. He did however site the conclusions made by Skaffeta and West regarding solar activity and climate change. This is just one example and it does seem like some manipulation of Monckton's words has taken place? -
Eric (skeptic) at 02:45 AM on 22 May 2011Skeptical Science Educates My Students
Send them all to remedial English class.

Prev 1727 1728 1729 1730 1731 1732 1733 1734 1735 1736 1737 1738 1739 1740 1741 1742 Next


