


 Arguments


Recent Comments
Prev 1764 1765 1766 1767 1768 1769 1770 1771 1772 1773 1774 1775 1776 1777 1778 1779 Next
Comments 88551 to 88600:
-
Daniel Bailey at 00:26 AM on 30 April 2011Wakening the Kraken
@ CBDunkerson In days of Oelde, it was once called Dûr Helcaraxë, the Grinding Ice. One might now refer to it as Aear Forodgalad, the Sea of Northern Lights. In Tengwar Quenya:
-
Hoskibui at 00:23 AM on 30 April 2011Climate Change Denial book now available!
I hope to get a copy today or after the weekend - amazon.co.uk sent my copy a week ago - or so they told :) -
muoncounter at 00:19 AM on 30 April 2011A Flanner in the Works for Snow and Ice
KL#139: "nub of this thread is the size of the extra heat gain compared with other parts of the planet." No, the nub of this thread is the change in the northern hemisphere; in particular, the northern part of the northern hemisphere - what may someday no longer be called the cryosphere. See the Flanner paper, whose title states "Radiative forcing and albedo feedback from the Northern Hemisphere cryosphere ..." So by voicing agreement with Petrovich, you must also agree with Flanner as well as the author of this post. -
Ken Lambert at 00:02 AM on 30 April 2011A Flanner in the Works for Snow and Ice
138 Muomcounter I have no argument with your quotation. viz: "As the multi-year ice pack declines and more of the Arctic has a seasonal ice cover, more solar heat will be input to the ice–ocean system, resulting in an enhanced ice-albedo feedback" The nub of this thread is the size of the extra heat gain compared with other parts of the planet. -
Ken Lambert at 23:52 PM on 29 April 2011How climate change deniers led me to set up Skeptical Science website
JMurphy #22 "I cannot understand how anyone commenting on a website (even one as interesting and important as this one) can assume that what they have to say can be important enough to need the attention of someone like Dr Trenberth; or that the owner of said website should be spending all his hours trying to make such an interaction happen. I find that astounding. Perhaps if someone on here feels they have shaken the foundations of some of the science, they should publish in the appropriate peer-reviewed manner ?" If you don't think that you could conduct a conversation with the authors of the scientific papers cited on SKS, then you probably should not be commenting on them at all. Understanding of a scientific paper is not the exclusive domain of paid full time scientists in the field. I have conducted an email correspondence with Dr Trenberth myself - he is very approachable and generous with his responses. I could ask what we are all doing here if not to get an understanding of the science concerning 'the greatest moral challenge of our age'. -
CBDunkerson at 23:52 PM on 29 April 2011How climate change deniers led me to set up Skeptical Science website
KL: "Cries of foul always come more readily from those who see their viewpoint being demolished." "Most of it was tolerated by Moderators who were clearly on the side of my opponents" In the same post no less! Is this a new record in the self-defeating arguments category? -
Ken Lambert at 23:44 PM on 29 April 2011How climate change deniers led me to set up Skeptical Science website
chriscanaris #15 You have put my concerns perfectly. Cries of foul always come more readily from those who see their viewpoint being demolished. I am not made of sugar candy - and will slug it out with the best of them if I think the point is important enough -but the "Flanner" thread is an extreme example of crying foul everytime my opponents made another correction and bizarre attempts to impugn my motives and claim error on my part. Most of it was tolerated by Moderators who were clearly on the side of my opponents even though same were continually shown wrong in their numbers.Moderator Response: [muoncounter] Everyone:It accomplishes nothing to speak of 'sides' here; if you have a point to make, state your case. If others refute your point, take their objections into consideration and, if necessary, rebut. Do not merely keep repeating 'you made a mistake' or 'I'm right and you're not.' That is schoolyard behavior. If you cannot live within rules of civilized discourse, you probably don't have much of a point to make in the first place.
Enough carping about who said what. And most certainly, enough carping about moderation.
-
Bob Lacatena at 23:39 PM on 29 April 2011Clouds provide negative feedback
157, RW1,I do not see where the issues I've raised has been addressed or answered.
That's because you ignore the statements that do address them. 1. Your theory is inconsistent with all of the lines of evidence which point to a climate sensitivity of 3˚C or greater. You have seen this presented to you now at least 6 times, and you keep dodging it. How does your theory account for this? Until you answer that question, your theory fails. 2. Your theory is inconsistent with the observational evidence (Dessler 2010) that demonstrates a positive, not negative, feedback in response to short-term warming. While this cannot necessarily directly support a long-term positive effect, it directly refutes your "was negative before, so must be negative in the future" theory. 3. Your argument that models "assume" and require a positive cloud feedback is wrong. While clouds do represent a large area of uncertainty in the models, it is incorrect to think that the scientists who have done the modeling have not thought things through a little more carefully, and in more detail, than you have. You cast aspersions by generalizing their work into the word "assume," and yet provide no direct evidence (other than the general positive/negative thing) that their work is not well considered. 4. Your argument that current warming "depends" on the positive cloud feedback is exaggerated, as has been demonstrated. It reduces potential warming from 3˚C to 2.5˚C or 2˚C, which while helpful is not an inconsequential amount of warming. Like many deniers, you exaggerate one point to try to make it the single, decisive, "AGW killing" argument. 5. Your argument that cloud effect is negative and would not "switch" to positive is at its root flawed and too simplistic. It's rather like saying that May was warmer than April, and June was warmer than May, so every month from now on will get warmer and warmer forever. It takes a too simple premise, and draws an invalid conclusion, because it avoids the complexities of the system. Instead of Occam' razor, your theory uses Occam's guillotine. It is based on a very broad, general, simplistic approach to the problem. It does not consider any details in the issue, such as why the current effect would be negative, or how clouds might or will change. It assumes that all effects are linear and additive. It simply takes the childishly simple view that if current net effect is negative, then a warmer climate must mean more clouds, which must mean more negative. You may feel that this logic is persuasive, and for simple minded people who like to stop thinking as soon as they see an argument that supports their predetermined beliefs, this might well be persuasive. But it doesn't persuade me in the slightest. It matters very, very much where additional clouds form in a warming world (high latitudes, or near the equator), when they exist (during daylight, summer hours, or nighttime or winter hours), and what kind of clouds form (i.e. low, reflective clouds or high, heat trapping clouds). -
Bob Lacatena at 23:00 PM on 29 April 2011How climate change deniers led me to set up Skeptical Science website
JMurphy, Well said!!!! -
Phil at 22:10 PM on 29 April 2011How climate change deniers led me to set up Skeptical Science website
Chriscanaris @23 Can you please explain how the quote you gave was "reinforced" by my response ? I merely suggested a possible alternative explanation to your observation. -
chris1204 at 21:34 PM on 29 April 2011How climate change deniers led me to set up Skeptical Science website
les @ 17, Phil @ 21 & JMurphy @ 22: ...some people will always excuse anything from anyone...as long as they feel they are on the same side. My sentiments exactly and reinforced by your responses. Over and out. -
CBDunkerson at 21:22 PM on 29 April 2011Wakening the Kraken
Ah, that explains the 'ice' connection. Unfortunately, my knowledge of Finnish is limited to its influences on Tolkien's Quenya language... so not gonna be much help coming up with a replacement for Jäämeri. -
JMurphy at 21:18 PM on 29 April 2011How climate change deniers led me to set up Skeptical Science website
I think we still have a long way to go against denial, as evidenced even on this thread. It seems that some people are so stuck in that denial (for whatever reason but normally nothing scientifically rational) that they will never be able to admit that they are wrong or, indeed, that anyone that they feel is on the same side as them can be wrong either - witness the lack of criticism of Lindzen, Carter, Monckton, etc. from any of the so-called skeptics on here over the last several months. Witness also the lack of awareness of their own mistakes or lack of awareness that they could possibly make ANY mistakes - to admit such things are obviously too painful for them to bear. Witness also the language used : Ken Lambert "You have to remember that Dr Trenberth is a proponent of AGW..." No - Trenberth does not argue in favour of or support AGW : he is a scientist whose "primary research has focused on the global energy and water cycles and how they are changing, and his work mainly involves empirical studies and quantitative diagnostic calculations. Trenberth is a primary advocate for the need to develop a climate information system that is an imperative for adaptation to climate change." Ken Lambert "When your AGW enthusiasts are making uncorrected extreme claims of warming which bear no relation to scientists like Dr Trenberth's numbers - then it is time to say that this site has lost its scientific mojo." How ridiculous to call anyone an "AGW enthusiast". Some people seem more concerned to label others in a manner which conforms to their own belief-system and, to me, that is very childish. chriscanaris : "I have no problem with this site having a “warmist” perspective – after all, its raison d’être." Does "warmist" mean anything outside the circles of denial or so-called skepticism ? Again, it is a term made-up and used by those who have their own belief-system, involving their own words, their own meanings and their own little self-confirming congregation of like-minded devotees. The reason for this site is plain for all to see, if they want to, and is given in the article above or in the linked GUARDIAN article. Simple as that - nothing "warmist", 'coolist', whateverist about it. Two other examples. Ken Lambert : "John Cook is also seeming slow about getting Dr Trenberth on to this site. Do you fear a couple of skeptical science interactions with Dr Trenberth John?" I cannot understand how anyone commenting on a website (even one as interesting and important as this one) can assume that what they have to say can be important enough to need the attention of someone like Dr Trenberth; or that the owner of said website should be spending all his hours trying to make such an interaction happen. I find that astounding. Perhaps if someone on here feels they have shaken the foundations of some of the science, they should publish in the appropriate peer-reviewed manner ? Just a thought... Finally : chriscanaris : I did notice poor old Gilles..." I'm sorry, but this is like writing : "I did notice poor old Poptech..." and shows that some people will always excuse anything from anyone...as long as they feel they are on the same side. -
Berényi Péter at 21:03 PM on 29 April 2011CO2 effect is saturated
#160 KR at 07:33 AM on 29 April, 2011 Confess? What does Anderson have to confess to? Having written a rather clear paper on comparing data from two different platforms, that you have misinterpreted? Nothing. He himself does not have to confess anything. What I have written is even his spectra are not adjusted until they confess, which means exactly what you say: his paper is rather clear and extracts information by straightforward methods from measurements which were actually performed. It is a good paper. However, his data do not "confess" about the radiative effect of trace greenhouse gases, most notably about the relative importance of saturated vs. unsaturated ones. By "saturated" I mean saturated in a spectral interval around the absorption line center (like CO2 around 15 μm). In spectral regions like this the photosphere (the layer of atmosphere from where thermal IR photons have a reasonable chance to escape to space) is high up in the stratosphere, where the lapse rate is zero or even negative. It means the more stuff you put in, the higher the photosphere gets, that is, to a warmer level in the stratosphere (where thermal inversion prevails). Of course it is not saturated in the wings of the absorption band, where absorption gradually decreases to zero.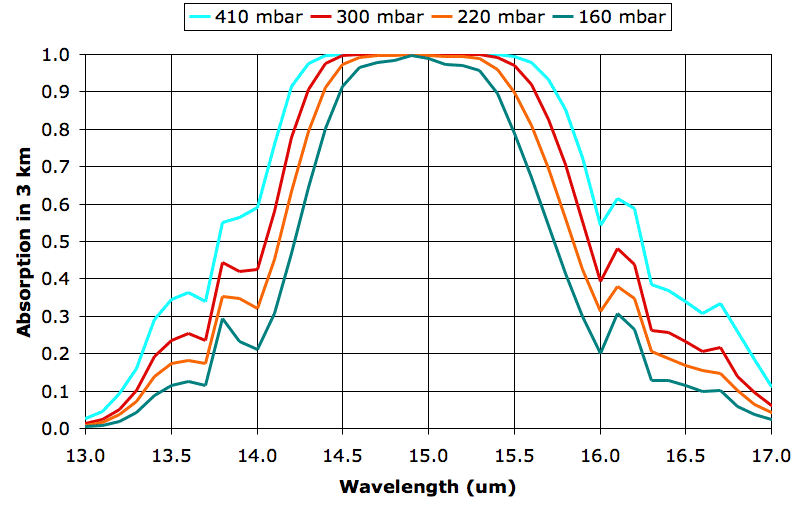 For your convenience: 14 μm is wavenumber 710 cm-1, the lower frequency limit in the Harries graph. The 160 mbar level is above 13 km altitude.
The really important question is the relation between radiative effects of a saturated absorber (like CO2) and an unsaturated one like CH4 which has a strong absorption line centered near wavenumber 1300 cm-1 (7.7 μm) with its own wings, but is not saturated at the line center, that is, thermal IR radiation has some chance to escape to space from the surface even there.
Anderson's difference spectra (and raw difference spectra of Harries as well) show a much more pronounced decrease of brightness temperature in the methane band compared to the almost negligible one in the carbon dioxide wing.
To bring them to comparable levels, one needs to assume unmeasured quantities like changes in atmospheric moisture and temperature fields behave in a certain way and adjust difference spectra accordingly. That step is not measurement, that's theoretical derivation using an extremely convoluted and basically unpublished, intrinsically unverifiable theory called CRUTEM3, embodied in thousands of lines of low quality computer code.
So. We of course know (from first principles) that the CO2 effect is not saturated (in the wings of the absorption band centered at 667 cm-1). The same way we do know Earth is not a sphere. But would it follow from this proposition it must be flat?
For your convenience: 14 μm is wavenumber 710 cm-1, the lower frequency limit in the Harries graph. The 160 mbar level is above 13 km altitude.
The really important question is the relation between radiative effects of a saturated absorber (like CO2) and an unsaturated one like CH4 which has a strong absorption line centered near wavenumber 1300 cm-1 (7.7 μm) with its own wings, but is not saturated at the line center, that is, thermal IR radiation has some chance to escape to space from the surface even there.
Anderson's difference spectra (and raw difference spectra of Harries as well) show a much more pronounced decrease of brightness temperature in the methane band compared to the almost negligible one in the carbon dioxide wing.
To bring them to comparable levels, one needs to assume unmeasured quantities like changes in atmospheric moisture and temperature fields behave in a certain way and adjust difference spectra accordingly. That step is not measurement, that's theoretical derivation using an extremely convoluted and basically unpublished, intrinsically unverifiable theory called CRUTEM3, embodied in thousands of lines of low quality computer code.
So. We of course know (from first principles) that the CO2 effect is not saturated (in the wings of the absorption band centered at 667 cm-1). The same way we do know Earth is not a sphere. But would it follow from this proposition it must be flat?
-
Phil at 20:49 PM on 29 April 2011How climate change deniers led me to set up Skeptical Science website
Chris canaris @15 Moreover, I notice an increasing tendency to block arguments germane to an issue via redirection to another “more relevant” thread. While I appreciate the need to stay on topic, I note this seems to happen much more with sceptical commentators (though I readily admit to possible observer bias and don’t have time to trawl through posts to try to prove my point). You also ignore the possibility that deniers simply use this rhetoric tactic more. -
Arkadiusz Semczyszak at 20:11 PM on 29 April 2011CO2 is plant food? If only it were so simple
@Marcus ”Still, I've noticed you've got a habit of cherry-picking only the stuff that supports your claims, whilst ignoring anything which undermines it.” I only supplement - a very incomplete (in my opinion) this post. Well, because if this post ignores the most positive effects ... I worked 10 years (including: for the Department of Agriculture - the U.S.) on the influence of climate on aphids - and their "enemies” (10 years I taught the students of agriculture, what you should know about: pest control - climate). The most interesting - to my - "paradox" here was that after every cold winter - usually - there were more aphids (unlike the “warm” winter). "Enemies" of aphids, they are simply being reduced more strongly - by frost - during the cold winters - more strongly than aphids. Therefore, in European Climate Change Programme, Working Group II Impacts and Adaptation, Agriculture and Forestry, Sectoral Report, in: Implications of Climate Change on Agriculture - has been positive - it is written: "Reducing the occurrence of certain pests and diseases." I think that despite the passage of years, is still valid position Bubyko of 1998: - “Assessing the importance of expected climate change y its impact on world agriculture, we can conclude that growing anthropogenic global warming and, in particular, the increase in carbon dioxide concentration in the atmosphere can have a favorable effect on crop productivity in many regions of the earth.” (The Close Relationship between Climate and the Global Food Problem, 1998). - “On balance, it is very difficult to conclude with higher accuracy whether the projected global warming would be globally beneficial to human society or not.”(Global Climate Warming and its Consequence. Blue Planet Prize, 1998). However, if we prefer the latest papers ... As was in the past? Europe. It is generally thought that it was mostly dry conditions in warm climates limit the positive effects of increase p.CO2 for photosynthesis - the yield of crops. But let us be careful of such conclusions. The Medieval Climate Anomaly in Europe in simulations with data assimilation, Goosse et al., 2011.: “Evidence for a generally drier climate from ca. 1000-1200 AD is expressed in all compilations. Overall, wetter summers are found during the 13th and 14th centuries, in parallel to the global onset of the LIA, and may have added to the widespread famine in northern/central Europe in that period ...” -
les at 19:01 PM on 29 April 2011How climate change deniers led me to set up Skeptical Science website
19 - Rowdy... ... yes, but no one has calculated the warming due to dark mater nor dark energy... there's huge uncertainty about this so clearly the science isn't settled at all. In fact, I've done a search and can't find any publications relating dark energy to global warming... I suspect a cover-up. -
Kevin Hood at 18:45 PM on 29 April 2011How climate change deniers led me to set up Skeptical Science website
FYI recently someone offered a reason for denial that isn't on your list. This is closely related to the (false) claims that the sun is burning hotter. Instead, we're closer to the sun before. The reasoning went like this: The sun is slowly going nova, and as it does it is slowly turning into a red giant, and that means the sun is expanding, but since the earths orbit is the same, the result is that the sun's surface is now closer to the earth. A good rebuttal might be: The sun might be going red giant, but the universe is expanding at an accelerating rate. -
les at 18:26 PM on 29 April 2011How climate change deniers led me to set up Skeptical Science website
17 - Chris... really! I think most people have been around enough bulletin boards and such to have seen the "this site isn't what it used to be..." and "poor old X, how unfair" discussion which soon follows the disruption & changes wrought by trolls. It is a fact of such places that one or two individuals, with a will, can infuriate enough people so as to totally undermine the atmosphere. If you are actually not familiar with the pattern, I'd suggest you spend some time on just about any bulletin-boards on just about any subject. You will find, I'm sure, that the pattern of posting of 'some people' on the 'denialistism' side is really no different from anyone posting contrary views on any subject anywhere. -
Paul D at 18:09 PM on 29 April 2011Climate Change Denial book now available!
Re 7: do books exist?? Well, most information doesn't exist. We use mediums, like paper, orientation of particles etc to store information. Which leads to the question... what is a book? -
chris1204 at 17:55 PM on 29 April 2011How climate change deniers led me to set up Skeptical Science website
Albatross @ 16: I have no brief to speak for Ken who I'm sure is big and ugly enough enough to fight his own battles. His comments were but a springboard for my personal perceptions which have grown over some months. I did notice poor old Gilles seems to have been copped a bit of a shellacking - "troll du jour" anyone? There has to be a lighter side to this blogging business. I've only just received John's book in the mail and so have given it only a very quick glance. It seems well-produced, well-referenced, wide-ranging, and clearly a labour of love. I'm looking forward to some challenging reading. -
Bern at 17:13 PM on 29 April 2011Climate Change Denial book now available!
sgmuller: ah, but here we're not talking about the African Ostrich (Struthio camelus), but rather it's better known cousin, the Metaphorical Ostrich (Struthio metaphoricus). In addition to sticking it's head in the sand when frightened, it only looks at the ground six inches in front of it's feet, and tilts it's head sideways when running uphill so it doesn't seem like it's going upwards (they're terribly afraid of heights, thus the head-in-the-sand thing). -
Albatross at 17:07 PM on 29 April 2011How climate change deniers led me to set up Skeptical Science website
Chris @15, I'm sure that you mean well,and that your comments are well intentioned, but a perusal of Ken's comments runs counter to your assertions. In fact, you need have only read #13 above to find examples of rhetoric and hyperbole and yet another off-topic comment: "When your AGW enthusiasts..." Scientists and those in the know who understand the gravity of the situation are not at all enthused about it. and "then it is time to say that this site has lost its scientific mojo." and "Do you fear a couple of skeptical science interactions with Dr Trenberth John?" And I recall seeing much, much worse comments made by the person in question before they were deleted. I am noticing an increasing tendency for contrarians posting here to go off topic, obfuscate and try and derail the threads-- see the efforts by poster Gilles, to cite but one recent example. Now Chris, do you have any thoughts on John's book and his Guardian article? -
chris1204 at 16:53 PM on 29 April 2011How climate change deniers led me to set up Skeptical Science website
Ken Lambert @ 2 & 13: Sadly, the courtesy that once characterised this site has become quite scarce. Ken's contributions are infrequent but thoughtful and incisive (I say this not just because they are sceptical). Dismissing his concerns as no more than intransigence over his inability to defend his argument misses the point. I draw your attention to the comments policy: You may criticise a person's methods but not their motives. I've raised similar concerns in a previous post in which I felt another commentator was being poorly treated. I cited the comments policy. I received a series of responses saying nice things about me but saw no redress for my fellow commentator. Overall, I can't help but feel a growing disappointment over the increasingly ad hominem tone by commentators on this site. For example, on the Flanner thread, Tom Curtis wrote: I will request that the moderators take notice of your obvious trolling. I thought this quite over the top given the antisocial connotations of trolling. Admittedly, another inflammatory comment from Tom was snipped (now that must have been pretty strong stuff!) though I would have thought accusations of trolling warranted similar intervention. Some of Ken’s later comments seem also to have been snipped. Subsequently, one commentator wrote: I will not engage with anyone who demonstrates a blatant and total lack of integrity. only to receive the mildest of rebukes from the moderator(s) on the lines of: While you are certainly free to question another's statement and advise others to question them, questioning personal integrity is not necessary. Whereas the comments policy explicitly states: Any accusations of deception, fraud, dishonesty or corruption will be deleted. This applies to both sides. Stick to the science. Moreover, I notice an increasing tendency to block arguments germane to an issue via redirection to another “more relevant” thread. While I appreciate the need to stay on topic, I note this seems to happen much more with sceptical commentators (though I readily admit to possible observer bias and don’t have time to trawl through posts to try to prove my point). I have no problem with this site having a “warmist” perspective – after all, its raison d’être – and have found much fascinating material upon which to ponder. However, the increasingly polemic tone of the commentariat generates disengagement.Moderator Response: [muoncounter] Perhaps what you detect as a loss of courtesy is due to a recent onslaught of deniers who seem to have no interest other than derailing legitimate conversation. We've already seen a number of folks disengage, no doubt in frustration over what is very definitely 'trolling.'A request that 'moderators take notice' of a poster's behavior is not ad hominem; it is a call to address behavior that is heading out of bounds.
The increasing number of requests to keep comments on topic is a response to an increasing amount of scattergun-style commentary. You should note that these begin as requests that are often disregarded.
-
sgmuller at 16:40 PM on 29 April 2011Climate Change Denial book now available!
This book doesn't actually exist. Its a myth. I know because I searched for it on Google Earth. Anyway, even if it did exist, Ostriches don't really bury their head in the sand. http://www.abc.net.au/science/articles/2006/11/02/1777947.htm -
Philippe Chantreau at 16:25 PM on 29 April 2011Cosmic ray contribution to global warming negligible
Eric "Whether that results in a GAT change is a super stretch." That amounts to saying that a climate-scale effect is a super stretch. Which indeed it is, as far as the evidence shows. -
Bern at 15:36 PM on 29 April 2011Climate Change Denial book now available!
Ok, ordered my copy. With the 20% discount, the Aussie price from NewSouthBooks is much closer to the rest of the world price (though not quite as keen as some prices I saw on Booko - which says the book is available from 23 different online retailers!) Look forward to reading it. Will give me something to do if this rainy weather continues here in Brissie... -
BaerbelW at 14:25 PM on 29 April 2011Climate Change Denial book now available!
I already have my order placed at Amazon.de. They sent an email with an availability date of May 20 and I hope that this holds true. Can't wait to read it. And I second Dan's hint about the Kindle... -
muoncounter at 13:46 PM on 29 April 2011Cosmic ray contribution to global warming negligible
Eric #49: "why are you looking for clouds in a temperature graph?" Isn't that the entire point? These GCR-stimulated clouds are supposed to cool; during GCR lows (solar highs), the lack of these clouds is supposed to be an agent of warming. So why not look in a temperature graph? Read the first and last sentences of the post. Is the paper you linked Dong et al 2010? Link to full pdf The cloud fractions (CFs) derived from ARM radar-lidar and ceilometer measurements increase significantly from March to May (0.57→0.84), remain relatively high (∼0.80–0.9) from May to October, and then decrease from November to the following March (0.8→0.57), having an annual average of 0.76. Seems to be a seasonal effect, which isn't a hallmark of GCRs. The sensitivity study has shown that LW CRFs increase with increasing cloud fraction, liquid water path, and radiating temperature with high positive correlations (0.8–0.9). Negative correlations are found for SW CRFs, but a strong positive correlation between SW CRF and surface albedo exists. CRF=cloud radiative forcing; more clouds -> greater retention of LW energy. -
Eric (skeptic) at 13:35 PM on 29 April 2011Cosmic ray contribution to global warming negligible
#44, muoncounter, why are you looking for clouds in a temperature graph? Cloud fraction at Barrow AK dropped from 1998 to 2008 http://www.agu.org/journals/jd/jd1017/2009JD013489/2009JD013489.pdf I would expect local areas of the globe to react differently to GCR regarding clouds. Whether that results in a GAT change is a super stretch. -
muoncounter at 13:23 PM on 29 April 2011A Flanner in the Works for Snow and Ice
Another paper along the same lines as Flanner: Perovich et al 2011 Solar partitioning in a changing Arctic sea-ice cover The summer extent of the Arctic sea-ice cover has decreased in recent decades and there have been alterations in the timing and duration of the summer melt season. These changes in ice conditions have affected the partitioning of solar radiation in the Arctic atmosphere–ice–ocean system. ... Results indicate a general trend of increasing solar heat input to the Arctic ice–ocean system due to declines in albedo induced by decreases in ice concentration and longer melt seasons. The evolution of sea-ice albedo, and hence the total solar heating of the ice–ocean system, is more sensitive to the date of melt onset than the date of fall freeze-up. ... Our analysis applying a multiyear ice albedo evolution algorithm to seasonal ice overestimates the albedo and thus underestimates the solar heat input. As the multi-year ice pack declines and more of the Arctic has a seasonal ice cover, more solar heat will be input to the ice–ocean system, resulting in an enhanced ice-albedo feedback. -
dana1981 at 13:21 PM on 29 April 2011Lindzen Illusion #2: Lindzen vs. Hansen - the Sleek Veneer of the 1980s
michael - thanks. Spencer and Christy screwed up the satellite temp data analysis, but acknowledged when it was corrected. It's not really a comparable situation. mdenison - I'm not really sure why you think I misinterpreted Lindzen. Your interpretation seems no different than mine. -
Dan Moutal at 13:09 PM on 29 April 2011Climate Change Denial book now available!
I am buying a copy right now, and I'll buy another copy if it becomes available for the kindle... hint hint.Response: I've asked our publisher about an eBook version - there probably will be one down the track but I can't say when. Will announce it here when it happens. -
mothincarnate at 11:57 AM on 29 April 2011How climate change deniers led me to set up Skeptical Science website
I started for much the same reason. Around the time Monckton visited Aust and that farmer-wannabe went on a hunger strike up a post, I thought I had to say something... A lot of noise was being sold off as news. I've enjoyed your work here mate! -
Bern at 11:51 AM on 29 April 2011Climate Change Denial book now available!
The Australian pricing is depressing compared to the rest of the world (especially at US$1.09 to the AUD - although I fully understand it's not the book shops that are to blame). Nevertheless - does one of those links above provide a commission that would help support this site? That would significantly influence my purchasing decision...Response: Only the Amazon link provides a commission at the moment. Yes, bit of a shame about the Aussie price being high compared to other places :-( -
jyyh at 11:45 AM on 29 April 2011Wakening the Kraken
CBDunkerson - ah yes, that's the etymology - thank you. The point got lost in tranlation since in finnish Arctic Ocean - Jäämeri(Ice Ocean). Thought Arcticum meant something related to cold. -
Clouds provide negative feedback
RW1 My point is there is really no physical or logical reason why the net cloud feedback would suddenly switch from negative (cooling) to positive (warming) on the next few watts incident on the surface It doesn't need to switch to a net positive effect in order to be a positive feedback. If the total effect is currently negative, and a warmer climate causes structural changes in cloud cover that makes the total effect less negative, then that will result in additional warming beyond the original forcing. In other words less cooling is equivalent to warming. -
mdenison at 11:00 AM on 29 April 2011Lindzen Illusion #2: Lindzen vs. Hansen - the Sleek Veneer of the 1980s
Having read the article quoting Lindzen it seems to me that Lindzen is mostly concerned with the measured rise being comparable with the magnitude of natural variability. I think Dana has misinterpreted Lindzen's comments. He was not trying to claim that the temperature rise was 0.1C but rather that the effect excluding natural variation was only 0.1C since noise renders it pretty much impossible to detect a meaningful signal. "As far as the data goes, I would argue that we really don't have the basis for saying it's a half degree plus or minus 0.2. That is false use of science. What we have is data that says that maybe it occurs, but it's within the noise." When we compare 1880 decade with average temperatures of the next 100 years we see that it is below average but not so far below as to make us believe it could not have dropped to this level by natural variability. In other words the 1880's are colder than the norm, ie. in Lindzen's anomalous minimum. Likewise we see that the 1970's are above average but again no more than can be explained by than magnitude of natural variation. In other words he believes that most of the warming is explained by chance switch from an unlikely cold state to an unlikely warm state. It is just unfortunate that the GISS record happens to begin and end on these extremes. Therefore we must attribute most of the surface temperature rise to natural noisy redistribution of heat and only a small amount 0.1C could be due to heat input to the system and even that estimate is very uncertain. He states "Even if the Sun's output were fixed, even if the radiative input were absolutely constant, even if there were no change in the absorbing gases, the ocean itself can take up and store heat and release it..." and later he states "On the planet the most wonderful constituent is water with its remarkable thermodynamic properties. It's the obvious candidate for the thermostat of our system, ...." The real problem for Lindzen in 1989 is natural variability. The oceans an clouds are clearly important but are poorly understood. Greenhouse warming may be occurring but he feels that given the size of observed effects natural variation is the more important given the amount of noise it creates. He believes the noise is clearly drowning the signal of CO2 induced warming and therefore CO2 warming must be small and will remain of little significance. "I argue that the greenhouse effect does not seem to be as significant as suggested." He was wrong. There was a signal and it was indicating a rising CO2 effect. Jim Hansen spotted it despite the noise. "The predicted CO2 warming rises out of the 1sigma noise level in the 1980s and the 2sigma noise level in the 1990s" In 1989 Lindzen had some excuses. There was less data and it was noisy. By 1981 a good deal of the temperature rise was natural or at least not due to CO2 and much was masked by poorly understood aerosols. 23 years later he still appears to be clinging to this position that natural variation in the oceans and/or clouds can explain the warming even though no one has yet made a case that indicates this is possible. And this despite the fact that the signal is well out of the noise of natural variability and consistent with the warming expected due to greenhouse gases. It would appear that no matter how high temperatures rise this is, for him, an indicator that natural variability is ever greater than we had supposed. -
RW1 at 10:40 AM on 29 April 2011Clouds provide negative feedback
Sphaerica (RE: 156), "But there is. You're just denying that it exists. Hint: Go to the top of this web page and actually read the post." I have read the post. I do not see where the issues I've raised has been addressed or answered. -
David Huber at 09:53 AM on 29 April 2011Climate Change Denial book now available!
My next book purchase. Thanks John! -
Ken Lambert at 09:45 AM on 29 April 2011How climate change deniers led me to set up Skeptical Science website
Daniel Bailey Thats the point Daniel - I was not shown to be 'in error' on the Flanner thread - quite the reverse. The main respondent Tom Curtis made error after error and had to admit such while ploughing on to the next calculation, which eventually got closer to the Trenberth number. You have to remember that Dr Trenberth is a proponent of AGW - just one of the leaders in the field who we rely upon for the numbers. When your AGW enthusiasts are making uncorrected extreme claims of warming which bear no relation to scientists like Dr Trenberth's numbers - then it is time to say that this site has lost its scientific mojo. John Cook is also seeming slow about getting Dr Trenberth on to this site. Do you fear a couple of skeptical science interactions with Dr Trenberth John?Moderator Response: [e] Tom Curtis currently has the last comment on the Flanner thread addressing your claims. Please take any further discussion over there where it belongs. -
michael sweet at 09:34 AM on 29 April 2011Lindzen Illusion #2: Lindzen vs. Hansen - the Sleek Veneer of the 1980s
Dana, Terrific post. Are there records for Spencer and Christy for a comparable post for them? I think all three of them claimed that the satelite record was better than the surface record. That has been proved incorrect. The skeptics like to say Hansen's predictions are bad becasue they are not exactly correct. By comparing Hansen to the skeptics it becomes clear who has been more accurate over time. -
Marcus at 09:34 AM on 29 April 2011CO2 is plant food? If only it were so simple
"you seem to intimate that root-pathogens, insect pests and other diseases are going to emerge as new problems" @John D. No, what I'm intimating is that these are going to become even *more* dominant problems in an enriched CO2 world-a fact backed up by at least one FACE trial in each of the 3 cases (insect pests, weeds & soil-borne diseases). Even assuming we can overcome these problems quickly enough, it will only be done at a significant increase in the cost of farming-a cost which will be passed on to the consumer. Also, given that the upbeat assessment for yield increases you cite actually seem to all come from just the *one* 3-year FACE trial (Meta-analysis of FACE trials over the last 15 years-most of which were performed under otherwise ideal conditions-shows only a 5-7% yield increase in rice and and 8% yield increase in wheat), I find it slightly hypocritical that you easily dismiss the results of FACE trials which highlight the *downsides* of an enriched CO2 world. Still, I've noticed you've got a habit of cherry-picking only the stuff that supports your claims, whilst ignoring anything which undermines it. -
Marcus at 09:26 AM on 29 April 2011CO2 is plant food? If only it were so simple
@Arkadiusz Semczyszak. I see you're being true to form-another long winded post that essentially says *nothing*. "We should also remember that the increase in CO2 usually: - increases the number of leaves and flowers," Actually, CO2 usually increases the vegetative biomass (stems & leaves)-at the *expense* of reproductive biomass (fruits & seeds). Unless you intend to start eating leaves & stems in the near future, I'd suggest that's *not* a good thing. Also, as those leaves will contain less Nitrogen-a major component of the chlorophyll in those leaves-then I'd suggest that this will lead to a decline in total photosynthesis-again in contradiction to the claim that "CO2 is a plant food". "The current "mechanisms" of photosynthesis exist hundreds of millions of years. C4 grasses arose as a reaction to the unusual - in the history of life on Earth - a decrease in the concentration of CO2 - just a 3? million years ago ..." Yes, & guess which kinds of plants are the most dominant in agricultural terms? That's right, the grasses which first evolved 3 million years ago under a "low" CO2 regime. Rice, Wheat, Barley....amongst other "grass-based" crop plants. Again, sort of defeats your argument, doesn't it? "Being (in my country) at an scientific conference on pests - warming - I heard that you get from us (as a result of global warming), The Western Corn Rootworm, Diabrotica virgifera ... I have a question - that the yields and profitability of maize production is higher in my country, or where there is a Western Corn Rootworm ?" ....and what exactly are you trying to even say here? It sounds like a pretty weak attempt to avoid the issue if you ask me. "Consequently, adequate data are not available to reliably estimate the extent to which amelioration of drought stress at elevated [CO2] will improve yields over the range of C4 crop growing conditions and genotypes." Even if this were the case, & I've seen plenty of evidence to the contrary, then at best it simply proves the fact that claims that "CO2 is plant food" is not only overly simplistic, its also extremely premature. -
robert way at 08:40 AM on 29 April 2011Climate Change Denial book now available!
Congrats John, You will be remembered as one of the real heroes in this great fight -
johnd at 08:38 AM on 29 April 2011CO2 is plant food? If only it were so simple
Ian Forrester at 00:41 AM, in the context of the paper you referenced, referring to any differences as being CO2 induced is a means of differentiating the results from the control results. However until the grain and flour properties of the higher yield/ lower protein grains are compared head on head with grains with the same higher yields/ lower protein characteristics grown under non CO2 enriched conditions, then it is not possible to establish whether the differences are merely growth related, or if there is in fact some direct biological link to CO2. Bear in mind that the FACE and laboratory studies are relatively narrow focused, and without the much longer and broader database that has been accumulated by the grain growing and flour milling industries that has seen virtually every combination of factors, apart from CO2, that are possible. The qualities that the paper you referenced focused on as being important, were developed by the industries themselves through the accumulation of knowledge as commercial interests sought to refine the quality and productivity of both the end and the primary products. The battle between yield and protein, and the relevance of nitrogen, is, and has been long and well understood by every grower from even before nitrogen based fertilisers began to be used, and from whom much of the existing knowledge has originated. -
dorlomin at 08:31 AM on 29 April 2011How climate change deniers led me to set up Skeptical Science website
Keep em coming John, great blog gets put to near daily use on the Guardians enviroment pages. Great to see so many people from other parts of the world keen to stand tall and explain a science others are hell bent on smearing. I think you have done a fantastic job with where you are pitching the blog in terms of both tone (its very easy to get dragged into the name calling and by hell I am guilty of that) but also being so well aimed at people who may not have strong science backgrounds but are smart enough to pick it up. Its easy for a professional to knock out a very nerdy and science dense technical blog posting and its easy to knock out blogs about the social or political aspects of climate science but you manage to put together one that is about the technical aspects but that the man "on the Clapham omnibus" can understand. Hats off. -
CO2 effect is saturated
Berényi, Moderators (Emphasis as in originals) KR: "- Most importantly; Anderson's spectra are not corrected for global warming, to the equivalent black body temperatures. Anderson is showing the raw differences between the two satellite spectra with some fairly impressive corrections added. But this is not corrected for the equivalent black-body spectra (Brightness Temperature) as Harries did, and hence does not show what you claim it does." (hence overlaying these two different graphs is incorrect) Berényi: "You are right. However, I would use a different wording: Anderson's spectra are not adjusted until they confess. The reason I am saying that is because Harries at al. do not simply correct for equivalent black body temperatures, they perform a vastly more sophisticated transformation." -- Confess? What does Anderson have to confess to? Having written a rather clear paper on comparing data from two different platforms, that you have misinterpreted? Moderators, I think this is going entirely too far. These constant unjustified insinuations and accusations of bad science and data manipulation are clearly outside the Comments Policy limits. Berényi, unless you have proof of malfeasance, I would suggest you drop the accusations. If you disagree with a paper, point out the issue you disagree with. But attributing bad practice and data manufacture (as you have done at least twice in this thread alone) is a completely unjustified, insulting, and repetitive ad hominem fallacy.Moderator Response: [DB] Agreed. This goes no farther without links to proof of malfeasance. No more insinuations, no more implications. Further remarks not complying with the Comments Policy will be simply deleted. -
littlerobbergirl at 07:25 AM on 29 April 2011CO2 is plant food? If only it were so simple
great post Dawei. but, oh dear, wot adelady says in 23. it's all wiped out by other factors. grown women weeping here at unseasonal infestations of various bugs, despite best efforts of carefully encouraged wild life, slow worms, toads, and even the final solution - blitzing with chickens! a month of drought at a time of normally wet weather can undo any advantage of raised co2 levels. -
littlerobbergirl at 07:15 AM on 29 April 2011Wakening the Kraken
'the kraken wakes' comes to me from wyndham's science fiction - so i'm a pleb. well, it wont matter soon... i was on the loo with a back copy of the new scientist just today reading another possible reason for the PETM - massive methane release triggered by a spreading ripple from a pulse of magma - hot blob - from the geologic hotspot at iceland. pay to view but here is the chap proposing the main theory; http://www.esc.cam.ac.uk/people/research-staff/bryan-lovell
Prev 1764 1765 1766 1767 1768 1769 1770 1771 1772 1773 1774 1775 1776 1777 1778 1779 Next


