


 Arguments


Recent Comments
Prev 1766 1767 1768 1769 1770 1771 1772 1773 1774 1775 1776 1777 1778 1779 1780 1781 Next
Comments 88651 to 88700:
-
adelady at 23:30 PM on 28 April 2011Video on why record-breaking snow doesn't mean global warming has stopped
That'll only work, Ken, if the snow hangs around long enough to reflect any worthwhile input from the sun. A lot more snow/albedo at a time when there's very little radiation from the sun makes little to no difference. If we could find a way to make it stay on through spring and summer, then we'd be talking! -
Harry Seaward at 23:30 PM on 28 April 2011A Convention for Persons Displaced by Climate Change
This is seriously not a trolling question. Are the people in the American South (194 dead and many more homeless)from the storms that rolled through in late April considered climate refugees? -
adelady at 23:26 PM on 28 April 2011How climate change deniers led me to set up Skeptical Science website
That's an interesting point about the sun "argument". I did notice a couple of people mentioning the sun in an entirely different way. I just hadn't put it together - that no-one seems to be saying "It's the sun - so there!" any more.Response: We do keep track of how often climate myths appear (although if more people used the SkS Firefox Add-on, this data would be more comprehensive, hint, hint). I should dig into the data, see how often the sun myth has appeared in recent years. Then do a correlation check with traffic to the sun rebuttal webpage. Hmm, maybe we can quantify this... :-) -
Ken Lambert at 23:26 PM on 28 April 2011Video on why record-breaking snow doesn't mean global warming has stopped
Hey Sphaerica, Just think of the INCREASE in albedo for all that record area of snow white snow covering the NH areas for a few extra weeks. Could lead to an unnatural cooling. -
johnd at 23:02 PM on 28 April 2011CO2 is plant food? If only it were so simple
Marcus at 16:46 PM, regarding your point (1), and the requirement to consume more in order to maintain protein input. I have no argument with that, it is a well established fact, however what you are continually missing in the bigger picture is that the extra grain needed to be consumed to make up for the lower protein is less than the total extra amount of grain produced, thus leaving a surplus. I have continually pointed this out, that despite the lower protein levels, the increased yield means that more total protein is produced per hectare, thus each hectare is able to supply the protein requirements of more people. Surely that is what is important in the big picture. Regarding your point (4), you seem to intimate that root-pathogens, insect pests and other diseases are going to emerge as new problems, when in fact they will not be new, but are existing problems that are continually having to be overcome. What the FACE trials have not been able to replicate so far, as far as I know, are the strategies that are implemented in commercial operations as a matter of course in order to break the cycles of the problems that concern you. The utilisation of break crops, crop rotation etc. Only once the FACE trials have been running long enough utilising such techniques will anyone be able to say whether or not the pest and disease status is going to be any worse than what it is now. Of course the safe position is always to be a pessimist, because surely at some point, even if things don't turn out as bad as predicted, it can always be claimed that they are still worse than what they otherwise could have been. -
Bob Lacatena at 22:45 PM on 28 April 2011CO2 is plant food? If only it were so simple
Dawei, Excellent post. One modification that I would suggest is to add a section (like those on temperature and ozone) on precipitation. All of the information provided is important to understand, and I think helps to indirectly address the main flaw behind "CO2 is plant food" as a statement, which is to say that it grossly oversimplifies the problem, trying to reduce something complex and interactive to the level of a parent's explanation to a child of the awkward question of where babies come from ("the stork brings them"). I also think that precipitation changes are the big bullet in the climate change gun. Certainly, they are the most difficult to predict, but it will not take much in the way of the wrong amounts of rain at the wrong times to obviate any possible benefits from raised CO2 levels and to greatly reduce crop production. The state of the Amazon after the 2005 and 2010 droughts will seemingly soon become a prime example of this. My (personal, uneducated) guess is that one more major drought in the next 3-5 years will have huge ramifications; it's like the largest and most disheartening (unintentional) FACE trial ever performed by man. BTW, Climate Wizard is a useful site for researching projected changes in temperature and precipitation by region under different scenarios. -
CBDunkerson at 22:36 PM on 28 April 2011Lindzen Illusion #1: We Should Have Seen More Warming
Hey, if it is "too early to say" that we should have seen more warming... and yet Lindzen already DID say that we should have seen more warming... then Argus clearly disagrees with Lindzen. Good on you chap. See, 'skeptics' don't always back each other no matter what nonsense one is putting out. -
CBDunkerson at 22:32 PM on 28 April 2011Wakening the Kraken
Arctic, from the greek 'arktikos', meaning 'North' or literally, 'of the bear'... a reference to the constellation Ursa Major which is visible in the northern sky. Ergo, since it will still be in the far North I suspect it will still be called the 'Arctic Ocean'. As to the likelihood of massive methane release. Still hard to say. However, it isn't just the clathrates we have to worry about. There is plenty of methane trapped in 'permafrost'... and there's some stuff which is definitely going to need a new name. 'Not so perma frost'? 'Formerly perma frost'? 'Expermafrost'? -
Bob Lacatena at 22:24 PM on 28 April 2011Models are unreliable
trunkmonkey, I just read your series of posts, starting with 339. They contain a fair number of gross misunderstandings about the physics of climate as well as how models are constructed and what they do. First, your surprise that temperature drops 6˚C in the first year if all CO2 is removed is understandable, but in the wrong direction. I'm shocked that it only drops 6˚C, but then, that speaks to the incredible heat capacity of the massive volume of water in the Earth's oceans (which keeps the temperature up, despite the loss of CO2). Second, you seem to have this feeling that models are somehow based on parametrization and statistics, and that the ongoing work on those models does not completely dwarf what was done in prior decades. My suggestion is that there is a lot of information out there on both of these subjects. Certainly, much of it is incorrect and as such leads to unnecessary confusion. I would be very, very careful about choosing your source of information. Go with things written by scientists and professors, and avoid bloggers (and engineers) of all flavors. But the answers to all of your questions and doubts are out there. I'd gladly answer them for you, except that a proper treatment of either subject would fill pages and pages of comments, and still come up short. One very well written starting point which use less math and a more narrative approach, and so is more palatable to most, is Spencer Weart's A Discovery of Global Warming. It is highly recommended to all. Please, please, please go find the answers to your questions, not by immediately looking for the answers, but instead by first building the foundation knowledge that will help you to appreciate the answers when you get there. From Jurassic Park, spoken by the "chaotician" Malcom (played by Jeff Goldblum):The problem with scientific power you've used is it didn't require any discipline to attain it. You read what others had done and you took the next step. You didn't earn the knowledge yourselves, so you don't take the responsibility for it. You stood on the shoulders of geniuses to accomplish something as fast as you could, and before you knew what you had, you patented it, packages it, slapped in on a plastic lunch box, and now you want to sell it.
Take the time to build the foundation. Great leaps made to skip deep chasms lead to wrong conclusions. -
CBDunkerson at 22:18 PM on 28 April 2011Models are unreliable
trunkmoney wrote: "First they tell me that Co2 is only 20% of the greenhouse effect, and then they tell me that when they take this 20% out of the box GAT drops six degrees in the first year." Earth's Effective Temperature = ~255 K Earth's Actual Surface Temperature = ~288 K 288 - 255 = 33 K greenhouse effect 33 * 20% = 6.6 K greenhouse warming from CO2 That said, the '20%' figure for CO2 contribution to the greenhouse effect is somewhat arbitrary and probably not how they got to the 'six degrees' figure you cite. The absorption spectra of the various greenhouse gases (GHGs) overlap. If we take the percentage of greenhouse warming which CO2 would cause if it were the only GHG over the total warming it comes out to about 26%. However, if we consider only the portion of greenhouse warming which CO2 causes that would not also be caused by other GHGs then it drops to about 9%. Thus, that 'six degrees in the first year' is more likely 33 K * 9% = 2.97 K immediate cooling plus a similar amount from immediate water vapor feedback effects and a bit more from the start of ice albedo feedback changes. As scaddenp noted, climate models are based on observed measurements. For instance, satellite readings of atmospheric temperature and water vapor content over time have been used to calibrate water vapor feedback. Greenhouse forcings of various gases have been calculated from their absorption spectra. Albedo differences of snow, ice, land, and ocean have all been measured. Et cetera. When you can then plug all these values and equations into a climate model and get results which closely follow the measured temperature trend since 1880... AND paleoclimate reconstructions... AND climate on other planets, it becomes somewhat difficult to claim that the model is not robust. There may be (indeed, certainly ARE) many details missing, but either the broad strokes are all included, everything is matching due to implausibly remote coincidence, or the modellers are committing massive scientific fraud... with (in many cases) open code and data. -
les at 22:18 PM on 28 April 2011Muller Misinformation #1: confusing Mike's trick with hide the decline
155 mod/DB:- My point about teaching was simply, although I admit obliquely - to point out that there's a lot of "they should do this..." and "scientists should do that..." and a range of dictums pronounced on best-practice etc. which are, on the one hand, not the absolutes people (and particularly non-science practitioners) think they are. Teachers give simple rules - which are, in practice, only rules-of-thumb. Context and common practice need to be taken note of; and deviation from those 'rules' isn't a sign of incompetence or, worse, malfeasance! In general, what's taught in class to budding scientists is what should be done in a lab book. This is really important as lab-book results are the base line of evidence - which can even have legal consequences. In this example, a graph is a review article isn't the same as one in a detailed results paper, isn't the same as one in a lab-book, or one on a power-point etc. One size-rule does not fit all. -
dorlomin at 22:12 PM on 28 April 2011Wakening the Kraken
Senator Inhoef memorial lake? -
Tom Curtis at 21:23 PM on 28 April 2011Muller Misinformation #1: confusing Mike's trick with hide the decline
Ryan Starr @155, your problem is that we have already given you a straight answer to your question, it is just not the answer that you want. That answer is that Jones did not follow best practice. He could have done it better. But that is a long way a way from the answer that you want. You have tried leading the witness, but to your chagrin, the witnesses keep on telling the truth. -
CBDunkerson at 21:13 PM on 28 April 2011Antarctica is gaining ice
Ryan, the "rising" trend in Antarctic sea ice extent is extremely small and in no way contradicts what I was saying. Indeed, breakup of sea ice, collapse of ice shelves, and increased export of land ice into the ocean all cause increased sea ice extent. -
jyyh at 20:38 PM on 28 April 2011Wakening the Kraken
on a native language email board i asked intentionally provocatively what the Arctic Ocean should be renamed once it's ice free? among the options were f.e. Open Ocean and Midnight sun/Evernight ocean (seasonal name change). now i'd like your opinion on Fossil Ocean, Dearctic Ocean, Short Track Ocean (shipping/skating) and Stinking Ocean (though methane isn't very odorous).Moderator Response: [DB] Being from da UP, I favor Dearctic Ocean, eh? -
Phil at 20:28 PM on 28 April 2011Lindzen Illusion #1: We Should Have Seen More Warming
Argus @99 & @89 Perhaps you could further justify your statement I have great respect for Professor Lindzen; he is still an established atmospheric physicist and a famous professor of meteorology and explain why you feel it exempts Professor Lindzen from the serious scientific scrutiny in the OP ? I would also suggest that you take a moment to investigate the scientists Sir Cyril Burt and Gregor Mendel, both of whom (probably) transgressed in the production of their work. Wikipedia has good pages on both. Finally I would note that Lindzen does not have quite the same respect from other climate scientists as he does from you. From the proceedings linked @41 Sir John Houghton says of Lindzen (p18): but unfortunately he is not a man who does his homework. He does not read the rest of the literature; he quotes his own papers. -
David Horton at 20:00 PM on 28 April 2011CO2 is plant food? If only it were so simple
Presumably the main point of the "CO2 is a plant food" denier meme is that plants will grow faster and faster and bigger and bigger and take up more and more of the CO2 that selfless giant corporations are making available to them out of the goodness of their hearts. So, problem solved eh? In fact under this approach we should, if possible, speed up the emissions, none of this renewable energy nonsense - get the coal out faster and faster, get into the oil shales without delay, get the methane in the permafrost released as fast as possible. Because it seems in the view of people who keep trotting out this phrase (who was it said "you call it pollution I call it life"? I can't keep the names of these people in my head for some reason) this is a win-win situation. The poor people, and the rich people I suppose, will get more and more food to eat at no cost to themselves, while at the same time all these giant cabbages will just pull the extra CO2 out of the air therefore solving the imaginary greenhouse gas problem. But hang on a moment. Hold your horsepower. If those massive Brussels Sprouts do reduce the CO2 then surely all the plants that were benefiting from it stop growing so fast, in which case the CO2 rises again. And since all the cauliflowers get eaten after one year and all that CO2 excreted again, or die and rot after one year, same result, then the following year, with another injection of CO2 (see benevolent corporations above) into the atmosphere we either have to plant even more broccoli, or the ones we do plant have to grow even bigger. But I must be misunderstanding something, surely. If this is what is going on then why oh why do the levels of CO2 keep rising and rising and rising as the years and decades of this warming planet go by? And if this is the mechanism that is going to stop us frying eggs on the top of thermometers in parking lots then why didn't it work in the past? temperatures should have stayed pretty constant for millions of years, but didn't Ian Plimer say ... oh, I can't keep track of this. My head aches, why can't I get it? Oh, I know that if the good plants are growing and aiming to feed a billion new people every decade, then so are the weeds which are competing with them for light and water and (I suppose) CO2. Probably competing extremely well since the weeds, being weeds, have all evolved to thrive on the smell of an oily rag and a bit of water every few years, and with the new higher CO2 levels it's summertime and the living is easy for thistles and any other weed you want to name. And if the weeds thrive then so will the other individual plants in the farmer's field. if every Kale plant is twice the size it used to be because of more CO2, then don't we get half as many Kale plants in the same space? Or do we make paddocks twice (4 times?) as big. Which means 4 times as much water and fertiliser. And then there's those pests. Boy, round here one good La Nina has seen Cabbage white butterflies so abundant the roads at times seem to have snow on them from all the white bodies hit by cars. And there are butterflies and moths I haven't seen before, munch munch munching away. Bigger kohlrabi leaves mean more space for caterpillars don't they? Still, one good La Nina doesn't make a summer, and in all the years leading up to this annus mirabilis, the low rainfall, dry ground, harsh winds, high temperatures meant that there was bare ground everywhere - even the grass wouldn't grow, and tough native heaths were dying - in spite of all the extra Co2 the big energy companies had been putting into the air for years for these ungrateful plants I must be dumb I guess, just don't get it. Not as keen as mustard I suppose. -
JMurphy at 19:41 PM on 28 April 2011Lindzen Illusion #1: We Should Have Seen More Warming
Argus, what do you mean that it is "still too early to say" that we should have seen more warming ? When do you believe we WILL have seen more warming, at least to your requirements ? (Hope I haven't used any "foul language" there - not that I used any before but, there you go...) -
dorlomin at 18:47 PM on 28 April 2011Wakening the Kraken
At the risk of being a heritic, but the Arctic refreezes every winter, it will leak heat back into space until it is cool enough. This plus the huge thermal inertia of 50m of water, would this not slow the release meaning there is a reasonable chance it will not accumulate so fast as to become a huge problem over the next twenty years or more? I am not saying its not a threat, just not a guarenteed threat in the medium term. -
Marcus at 18:25 PM on 28 April 2011CO2 is plant food? If only it were so simple
"Give me a grant of a few hundred thousand dollars and a few research scientists and I'll give you 500 new versions of Rubisco Activase, or more if you want. Give me another ten years funding and I'll give you a field trial on x number of genetically modified crops with a new Rubisco Activase gene." Yes, HR, & can you guarantee that *any* of them will perform better than what nature has already provided after millions of years of evolution? As someone with more than 2 decades of experience in Molecular Biology, I've become a little bit more realistic about the potential for molecular biology to solve all our problems. All GMO's have done is to give certain Corporations far too much control over our agriculture, yet with far fewer benefits for farmers & consumers than were originally promised. So forgive me if I still say that it is *more* cost effective to stop stuffing up our climate than it is to use science to adapt our crops to the conditions we're creating. -
Marcus at 18:15 PM on 28 April 2011CO2 is plant food? If only it were so simple
"but there is no logic to your suggestion that in vitro work trumps controlled in vivo work in helping us understand what will happen to this gene in the real world." That is *not* what I suggested-so please stop trying to misrepresent my position. My position is that, from an historical basis, our observations of plant physiology in the real world (outside of a controlled environment) has been backed by what we know at the cellular & molecular level-& vice versa. The same cannot always be said for glasshouse trials-as the FACE trials clearly show. The difference between them becomes even more stark when you factor in the known impacts of soil-borne diseases, competition from weeds & predation by insect pests-yet all 3 of these factors can be understood, & well predicted, by our knowledge of plant physiology gained from In Vitro work. With that in mind, I'd say Dawei is far less guilty of making "speculative leaps" than those who rely on results taken *purely* from Glasshouse trials. I'd also say that he is emphasizing a *realistic* conclusion regarding the future impact of rising CO2, whereas people such as yourself continue to push a blindly optimistic conclusion-only because that's the conclusion which will require the smallest action to be taken on CO2 emissions in the future. -
JMurphy at 17:57 PM on 28 April 2011Antarctica is gaining ice
RyanStarr wrote : "I recall a picture from the 50s showing a submarine poking through slush at the north pole." Could you post further details on the thread suggested by scaddenp. -
JMurphy at 17:55 PM on 28 April 2011CO2 is plant food? If only it were so simple
HumanityRules wrote : "Give me a grant of a few hundred thousand dollars and a few research scientists and I'll give you 500 new versions of Rubisco Activase, or more if you want. Give me another ten years funding and I'll give you a field trial on x number of genetically modified crops with a new Rubisco Activase gene." This seems to be a common refrain, and not just with reference to Climate Studies - people have written about 'pots of gold', 'rivers of cash', 'showers of coins', etc. However, when the banks hear similar stories, and various grant organisations hear similar stories (and even when they hear such stories in Dragons' Den), the answer is the same, unfortunately : "If you can prove that your idea has value and potential, the money is yours. If you can't...NEXT". That's life, I'm afraid, and (just as with the other examples I've given) you'll get very little sympathy for wishing, especially from those of a certain political persuasion : who will go on about grant-dependency, people expecting money for nothing, etc. -
Argus at 17:51 PM on 28 April 2011Lindzen Illusion #1: We Should Have Seen More Warming
Quick answers: Moderator: "Do you agree with Lindzen or not, per the topic of this post, that we should have seen more warming?" -- Answer: it is still too early to say; time will tell. #90 pbjamm -- not worth an answer. #91 dana1981: " "I like Lindzen therefore he must be correct" isn't exactly a very compelling argument." -- Answer: you are right, and that quote misrepresents what I wrote; read again! #92 Rob Honeycutt: "Is there any basis for this belief? If so I'd like to hear it." -- Answer: the basis is that 20 years is too soon state definite answers about climate. #93 JMurphy: "That comment from Argus..." -- Answer: an excellent compilation of invectives, insults and foul language, other than that deserves no answer ( -Inflammatory snipped- ).Moderator Response: [DB] JMurphy was making a generality about your comment being emblematic of stock "skeptic" responses and tactics. I see no personal insults or foul language. Any invective I read is directed at the argumentation style and mindset in general, not in specific. -
RSVP at 17:03 PM on 28 April 2011Waste heat vs greenhouse warming
To KR Comparing your remarks... exhibit A "Think of a pot on a stove. Adding AHF is equivalent to turning up the burner. The stew gets hotter, more steam comes out, it recovers equilibrium (stops changing temperature) when in = out. " exhibit B "In fact, if waste heat was the cause of warming, we would see an increase in outward IR due to the planet being over equilibrium temperature, rather than the observed decrease as the climate catches up to the GHG forcing. " In B, with respect to the analogy in A, you are basically saying less steam is observed to be coming out. If as you say, "Adding AHF is equivalent to turning up the burner.", it holds that AHF is contributing to warming. Up to there we appear to agree, but you go on to say that AHF is not the "primary" cause. This would be possible if at the same time AHF were not accumulating, but since energy cannot be destroyed, I am very afraid this needs to be accounted for before considering GHG effects. -
HumanityRules at 16:50 PM on 28 April 2011CO2 is plant food? If only it were so simple
29 Marcus My 25 years as a molecular biologist says the reason you do in vitro work on a gene is because you can further control the conditions in which the gene is operating. You are taking it one step further away from even the slightly messy conditions of a whole organism in a controlled setting. You can certainly get a more refined understanding of how a gene works but only within the artificial setting of a plastic tube. For example there are numerous co-factor and subtle transcriptional and tranlational modifications that are potentially at work in the in vivo setting that have been lost by working in vitro. There are pro's and con's to both in vitro and in vivo work that's why scientists do both but there is no logic to your suggestion that in vitro work trumps controlled in vivo work in helping us understand what will happen to this gene in the real world. I just want to emphasise I'm not critising the science. The science is the right approach. I'm questioning how much we consider these results as speculative in relation to the real world. I think Dawei has clearly taken a speculative jump here. He has rightly highlighted the speculative jump made in extrapolating from greenhouse work but has ignored the even greater speculative jump made from extrapolating from in vitro work. I think that has the effect of emphasising a more pessimistc conclusion. -
Marcus at 16:46 PM on 28 April 2011CO2 is plant food? If only it were so simple
"I don't think anyone should be writing off what may be possible, nor discounting the ability of those involved in such work, it is all really only beginning, and so little is known." As someone who is 'involved' in such work (amongst others), John D, I can tell you that you are pinning *way* too much hope on the beneficial effects of eCO2 on crop yields-over the longer term-for several reasons. 1) If the protein yield-in g/kg of total biomass-is reduced, then humans & animals will need to consume greater amounts in order to get the same benefits in terms of protein. The same is true of trace elements like iron & zinc, which have also been shown to fall under eCO2 conditions. 2) Under more stressful conditions (lower water, greater warmth), there was almost *no* significant difference in grain yield between those plants grown at eCO2 vs aCO2 conditions-but the drop in N remained about the same. 3) The FACE trials in Horsham have indicated that acclimation sets in after just 3 short years of cropping at eCO2 conditions. 4) We still don't know *exactly* what impact root-pathogens & insect pests will have on total & grain biomass under eCO2 conditions-but the evidence we have to date does *not* bode well. 5) Back on the issue of N, you seem to forget that the quantity of the enzymes that determine the rate of photosynthesis, as well as the amount of chlorophyll in the leaves, is highly dependent on the levels of nitrogen in the plant. Decrease the levels of N, & this would *suggest* that-in the longer term-you'll also get a decrease in total levels of photosynthesis-that might well suggest that any biomass gains will be short-lived. What it keeps coming back to is this-is it going to be *more* cost effective to keep adapting our agriculture to suit humanity's "tinkering" with the atmosphere/climate, or is it more cost-effective to simply *stop* with the tinkering? From everything I've read at this site for the past 2 years, I'd argue that the *latter* is true. -
Marcus at 16:33 PM on 28 April 2011CO2 is plant food? If only it were so simple
"1) All the FACE trials Dawei lists here and mentioned in the review linked in #6 suggest mainly positive, sometimes neutral and never negative effects from increased CO2 from what I can see." Do some research then HR, there are several FACE trials which have shown that eCO2-alone-will increase the susceptibility of crop plants to insect pests & increase the levels of certain soil-borne pathogens in the soil-both of which I'd define as a *negative*. There are also FACE trials which show that eCO2 can lead to decreased levels of protein, Zinc & Iron in plants. Given that nitrogen is a key component of chlorophyll, the "power-house" of photosynthesis, I'd say that greatly undermines the foundation of the "CO2 is plant food meme". All of that before we even *begin* to consider the impacts of changed hydrology & increased warming on crop yields. "2) It seems a little unfair that I should be held responsible for possible conclusions people might draw from falsely interpreting what I said." If you make overly simplistic claims, without offering up caveats, then you're actually making it more likely that people will "falsely" interpret what you said-which suggests that this is the outcome you're hoping for, & therefore you *can* be held responsible for making misleadingly simplistic claims. -
johnd at 16:32 PM on 28 April 2011CO2 is plant food? If only it were so simple
Ian Forrester at 12:29 PM, each time the subject of CO2 enrichment, and particularly FACE trials for wheat is raised, the most common response is, that despite the indicated yield increases, it is the lower protein levels that is the issue. Given that, I think something needs to be clarified in the minds of those who have little or no background knowledge on the subject. The inverse relationship of crop yield and protein levels is not, repeat, not something new, nor specific to CO2 enrichment. Instead it is a well understood, well measured response that happens every year, and has been happening forever, or at least must seem like forever for those growers whose payment is structured not only on weight delivered, but on protein content. Routinely, years of high yields show lower protein levels, whilst the lower yields of drought conditions can be offset somewhat by higher protein levels. In fact there is even a standard formula that is used to determine the nitrogen requirements of a crop that explains the relationship. Using the grain yield (t/ha), the grain protein (%) and the appropriate grain protein factor, (for wheat it is 1.75, and for all other grains it is 1.6), multiplying the yield in t/ha by the % protein by the factor gives the nitrogen requirements in kg/ha. For example a 3 t/ha crop of wheat at 12.5% protein removes 66kg N/ha (3 t/ha x 12.5% x 1.75 = 66 kg N/ha). This formula is used by growers to anticipate the amount of nitrogen that they may need to apply if they want to achieve a certain crop yield. http://www.agric.wa.gov.au/PC_92452.html
However other factors may overtake the planned outcome with the eventual yield higher or lower, but the protein will also have varied inversely if the intended amount of nitrogen was taken up by the crop.
Another point that is also overlooked is that if calculations are done using the increased yields achieved under CO2 enrichment, and the lower protein levels, it is clear that the amount of protein produced per hectare actually increases.
Where such limits may be is yet to be determined, but it may eventually be found in the ability of the plants to take up the nutrients, or it could be in the ability of the soil to give them up.
I don't think anyone should be writing off what may be possible, nor discounting the ability of those involved in such work, it is all really only beginning, and so little is known.
http://www.agric.wa.gov.au/PC_92452.html
However other factors may overtake the planned outcome with the eventual yield higher or lower, but the protein will also have varied inversely if the intended amount of nitrogen was taken up by the crop.
Another point that is also overlooked is that if calculations are done using the increased yields achieved under CO2 enrichment, and the lower protein levels, it is clear that the amount of protein produced per hectare actually increases.
Where such limits may be is yet to be determined, but it may eventually be found in the ability of the plants to take up the nutrients, or it could be in the ability of the soil to give them up.
I don't think anyone should be writing off what may be possible, nor discounting the ability of those involved in such work, it is all really only beginning, and so little is known.
-
From Peru at 16:25 PM on 28 April 2011CO2 is plant food? If only it were so simple
There are FROZEN FROGS with a label saying "domain unregistered" in place of the figures. I hope the glitch is fixed soonModerator Response: [DB] Glitch fixed; thanks for pointing that out! -
HumanityRules at 15:49 PM on 28 April 2011CO2 is plant food? If only it were so simple
11 Phil 1) All the FACE trials Dawei lists here and mentioned in the review linked in #6 suggest mainly positive, sometimes neutral and never negative effects from increased CO2 from what I can see. The extra information is certainly thought provoking but I don't see that any sufficiently undermine the findings of these trials. If you don't want to go as far as saying this points to better agricultural yields in the future that's fine, I don't think I ever put that forward. But it doesn't seem to undermine 'CO2 is plant food'. 2) It seems a little unfair that I should be held responsible for possible conclusions people might draw from falsely interpreting what I said. -
scaddenp at 15:21 PM on 28 April 2011Models are unreliable
A lot to learn here. For the attribution question, see Schmidt et al. There is two issue though. One is current state - how much of the greenhouse effect is attributable to each gas in their current concentration in the atmosphere. The other is what happens when change CO2. The other greenhouse gases do not stay in same concentration (especially water varies with temperature) so feedback must be accounted for. Temperature change affects albedo as well and to lesser extent aerosols so this is not a trivial calculation. Why would you suspect something about what you dont know? Firstly, the modelling is physical not statistical. Codes like calculating the absorption of GHGs are improved slowly but code write and rewrite happens all the time as computer speed allows more and more physics to be added to the model. Realclimate has a good FAQ on modelling; I suggest you read it, rather than suspecting. Milankovich is irrelevant to DO and there is a large literature on what the causes actually are. But relevance to modern climate is??? -
Marcus at 15:09 PM on 28 April 2011CO2 is plant food? If only it were so simple
"If Dawei is happy to put a big question mark over the greenhouse work then I'd argue that conclusions drawn from this in vitro work should be in the region of complete speculation. Nothing wrong with that either as long as it's well understood." Well, HR, that just proves how little you know about the relationship between In Vitro & whole organism biology. History has shown us that what occurs at a cellular level tells us a great deal about what will occur at the whole organism level. Greenhouse work, by contrast, only tells us about how an organism will survive in carefully controlled conditions. Once again it seems your "skepticism" only stretches to those things which contradict the propaganda of the Contrarian Movement. -
Marcus at 15:06 PM on 28 April 2011CO2 is plant food? If only it were so simple
"And "your side of the debate" seem to have given up on human ingenuity or forgotten that throughout human history our ancestors have been fighting those problems you list, and generally winning." Tell that to the hundreds of millions of people who are already going hungry-across the world-& they'll probably laugh in your face HR. What do you think the metric will be when ingenious-but costly-solutions to the problems caused by eCO2 & related global warming push the price of basic food-stuffs even *further* beyond their reach? Or what do you think will happen to the price of crops if we have more record breaking droughts, like those in Russia, or massive storms & flood damage to crops, like those here recently in Australia? What's going to happen to the price of crops when some of the most arable land is under half a meter of sea-water? Yet the way you & your ilk would have us believe, with your simplistic reasoning, eCO2 will bring about a New Age of Abundance-whereas the realists amongst us can see that what it will really bring is a whole mess of new problems, in quick succession, that even our most ingenious minds might not be able to solve in time &-even if they do-will come at the cost of much higher prices for staples-like wheat, rice & soy-beans. We realists also recognize that it will be much cheaper-in the Mid to long term-to simply *avoid* this eCO2 scenario altogether, rather than take the chance that the boffins can solve all the problems it will create in time. Still, I guess if your only concern is the profitability of the fossil fuel sector, then you'd be willing to take that chance. -
HumanityRules at 14:59 PM on 28 April 2011CO2 is plant food? If only it were so simple
25 KR I'm not hiding my head in the sand, I'm standing up against unrealistic pessimism. I suspect under your cloud of doom you can't see that. -
trunkmonkey at 14:55 PM on 28 April 2011Models are unreliable
According to NASA the greenhouse effect of CO2 is 10 w/m^2 or 20% of the total greenhouse effect. I don't know where they got this, if it contains feedback assumptions, or if it is just the net absorbtion at 385 ppm. My understanding is that NASA is the custodian of the GISS model. I have effectively zero knowledge of numerical modeling so I haave to treat the model as a black box. First they tell me that Co2 is only 20% of the greenhouse effect, and then they tell me that when they take this 20% out of the box GAT drops six degrees in the first year. I have been lead to believe that the model was tested using hindcasting. I suspect that much of the source code was written before the ice cores were drilled.I assume (this is the weakest, honestly) that during this hindcasting the presumption was that CO2 had temperature on a leash. My suggestion is that until we discovered how much easier life can be if we burn that nasty black stuff, temperature had CO2 on a leash. Apologies for the excessive breadth of 339. I don't really believe in the "cycles". It's just how they are commonly referenced. The tendency on this website has been to say that because there is spectral significance for precessional cycle in the first half of the Pleistocene and eccentricity in the second half, that paleoclimatology is a done deal and it's all Milankovitch. Milankovitch is irrelevant in both the millenial DO and the billion year "cycles". I believe these "cycles" are actually more like the ENSO. -
HumanityRules at 14:54 PM on 28 April 2011CO2 is plant food? If only it were so simple
8 SNRatio In general I've got no real problem with this article other than it has a bias towards the most pessimistic conclusions. For example "This effect may potentially nullify some of the gains expected from excess CO2 in these plants." Much of the work supporting this is in vitro work performed on isolated enzymes. That is, it's not even in the plant. Earlier Dawei rightly critised greenhouse work for not well representing the real world. How well to you think a couple of isolated enzymes in a tube represent the real world? There is nothing wrong with this scientific approach, it's getting us a basic understanding of these enzymes but it's a long stretch to Dawei's conclusion from this work. If Dawei is happy to put a big question mark over the greenhouse work then I'd argue that conclusions drawn from this in vitro work should be in the region of complete speculation. Nothing wrong with that either as long as it's well understood. In the meantime all the reports of field trials still seem to show increased CO2 is either beneficial or at worst neutral to crop growth that still doesn't seriously undermine the idea of CO2 is plant food idea. -
CO2 is plant food? If only it were so simple
HumanityRules - "human ingenuity " and "our ancestors have been fighting those problems" are no excuse for short-sightedness, or hiding our heads in the sand while the tidal wave crests. Which, by dismissing the severity of global warming and it's impact on our lives, 'skeptics' appear to endorse. -
scaddenp at 14:39 PM on 28 April 2011Antarctica is gaining ice
Ryan, try taking arctic comments to arctic sea ice melt is a natural cycle -
scaddenp at 14:31 PM on 28 April 2011Antarctica is gaining ice
Wow - trotting out the old submarine photo. It's in a polynya! For evidence of part arctic sea-ice, see arctic sea ice threads. You can find pointers to the relevant papers on past sea-ice seasonal limits there. -
HumanityRules at 14:31 PM on 28 April 2011CO2 is plant food? If only it were so simple
7 Marcus And "your side of the debate" seem to have given up on human ingenuity or forgotten that throughout human history our ancestors have been fighting those problems you list, and generally winning. And all that without even knowing Rubisco Activase existed. Not a utopian but certainly a believer in the human spirit, I'd rather that than an utter pessimist. I'm not here to paint utopian visions just to counter unnecessary pessimism. I'm a molecular biologist. Give me a grant of a few hundred thousand dollars and a few research scientists and I'll give you 500 new versions of Rubisco Activase, or more if you want. Give me another ten years funding and I'll give you a field trial on x number of genetically modified crops with a new Rubisco Activase gene. There are always solutions to problem. ( -Questioning of motives snipped- ).Moderator Response: [DB] Don't go there. -
Philippe Chantreau at 14:26 PM on 28 April 2011Cosmic ray contribution to global warming negligible
Further correction Arch (sorry, it needs to be said): The particles generated by GCR are too small to act as CCN. A plausible mechanism for particle growth is the physical process lacking to give weight to the hypothesis. -
adelady at 14:21 PM on 28 April 2011CO2 is plant food? If only it were so simple
20 Marcus ".. changes in sowing times are a poor simulation of the kinds of conditions being predicted .." Yes, I noticed that. I realise that it's very limiting trying to do these experiments in the open air - and the equipment budget was probably entirely swallowed by the CO2 delivery and monitoring systems - but temp changes, (un)seasonal conditions and precipitation unreliability need attention. Who cares if the plants themselves do better if crops are ruined by two weeks of wet/ hot/ windy/ plague conditions just before harvest? I've seen grown men bravely blink away tears over rust ruining a thriving wheat crop - and that was a long time ago. Rust one year, locusts the next - following several drought years, makes Hanrahan look hopeful. -
RyanStarr at 14:09 PM on 28 April 2011Antarctica is gaining ice
Muoncounter, we've always had and always will have seasons, climate change isn't changing that. Look at photo above showing March and September extents for both the Arctic and Antarctic. Point me to some evidence which shows arctic ice extent used to be a more static quantity than it is now. I recall a picture from the 50s showing a submarine poking through slush at the north pole. -
RyanStarr at 13:57 PM on 28 April 2011Antarctica is gaining ice
@ 80 "...rising ocean temperatures have cleared out sea ice.." Cleared out sea ice in Antartica? You need to read the article above, it attempts to explain why the observed rising sea ice in Antartica can occur in a warming climate. -
Ian Forrester at 12:29 PM on 28 April 2011CO2 is plant food? If only it were so simple
Grain quality is decreased under high Co2 concentrations:Based on the modified physiology and biochemistry of wheat plants under CO2 enrichment, the concentration of total protein in grain was significantly decreased by 7.4% in the FACE treatment. The reduction in grain protein due to elevated CO2 is consistent with previous reports (Kimball et al. 2001; Taub et al. 2008; Wieser et al. 2008; Ho¨gy et al. 2009), resulting in potentially far-reaching consequences for the nutritional value and use by the processing industry........... ....Among the grain proteins, the N- and glutamine-rich gliadin fraction was significantly decreased under CO2 enrichment, thereby lowering the gluten concentration that is fundamental in determining physical properties of dough formation and product quality
-
jyyh at 11:59 AM on 28 April 2011CO2 is plant food? If only it were so simple
A complex subject, and good overview (with citations). -
muoncounter at 11:52 AM on 28 April 2011Cosmic ray contribution to global warming negligible
arch #43: "significant more (and more convincing) evidence that it does not." I suppose that depends on what it takes to convince. We're now far enough from the solar min to make some observations. From Mewaldt et al 2010: In the energy interval from ~70 to ~450 MeV nucleon–1, near the peak in the near-Earth cosmic-ray spectrum, the measured intensities of major species from C to Fe were each 20%-26% greater in late 2009 than in the 1997-1998 minimum and previous solar minima of the space age (1957-1997) ... Cosmic-ray intensity variations at 1 AU are found to lag IMF variations by 2-3 solar rotations That rotation period is 27 1/4 days, as viewed from earth. So the maximum lag, if any, is less than 90 days. According to the model, these elevated GCR intensities should make more clouds. Do 2009-10 or 1997-98 appear to be cloud-cooled? From tamino's adjusted GISS temperature graph ("we remove the el Nino, volcanic, and annual-cycle signals we have what we’ve called the adjusted GISS data"),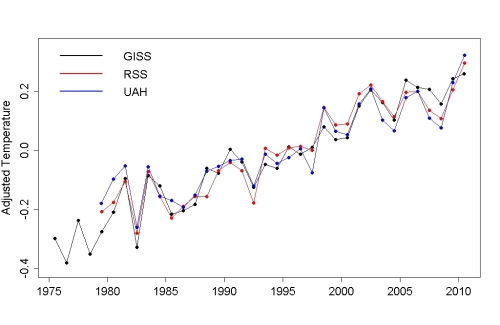 To summarize (with apologies to Sondheim),
And where are the clouds?
There ought to be clouds.
Well, maybe next year.
To summarize (with apologies to Sondheim),
And where are the clouds?
There ought to be clouds.
Well, maybe next year.
-
Marcus at 11:44 AM on 28 April 2011CO2 is plant food? If only it were so simple
"Trials to ascertain the effect of lower CO2 levels see reduced growth, growth apparently almost ceasing around 180ppm, however these obviously have to be conducted in enclosures." Which is ultimately a straw-man anyway, given that the odds of us ever experiencing CO2 concentrations of less than 200ppm are absolutely zero. The fact is that changes in sowing times are a poor simulation of the kinds of conditions being predicted when atmospheric CO2 levels really reach 560ppm-as I've said many times before. As I recall, though, the seed yield increases under those conditions (Rain-fed, slightly warmer) were negligible (when standard errors are accounted for) compared with ambient CO2-& at a cost of reduced nitrogen uptake under those conditions. Of course, other results from FACE trials show that enriched CO2 conditions favor an increase in certain soil-borne pathogens, increase the competitiveness of weeds & make plants more susceptible to attack by insect pathogens. All of which suggest, as I've said before, that the "CO2 is plant food" meme is *dangerously* simplistic. -
arch stanton at 09:47 AM on 28 April 2011Cosmic ray contribution to global warming negligible
Okay ;-) There is evidence that GCRs can trigger particles that can act as cloud condensation nuclei. There is little evidence that this has any influence of our climate, and significant more (and more convincing) evidence that it does not. Better?
Prev 1766 1767 1768 1769 1770 1771 1772 1773 1774 1775 1776 1777 1778 1779 1780 1781 Next


