


 Arguments


Recent Comments
Prev 1835 1836 1837 1838 1839 1840 1841 1842 1843 1844 1845 1846 1847 1848 1849 1850 Next
Comments 92101 to 92150:
-
MichaelM at 01:53 AM on 27 March 2011Weather vs Climate
If climate scientists predict a global warming of 3.8 degrees by 2100 and it turns out to be wrong - it was 3.9 they will feel such fools.Moderator Response: [Dikran Marsupial] Typo fixed; exactly the meaning of GEP Box's quote! -
quokka at 01:45 AM on 27 March 2011A Plan for 100% Renewable Energy by 2050
#82 Giles, Using scenarios to but some bounds on the range of the problem and to promote critical thinking about the problem is quite valid. Indeed it is essential. I don't know what you are going ob about. -
Dikran Marsupial at 01:38 AM on 27 March 2011Weather vs Climate
The fundamental answer to the canard that "we can't even predict the weather N days in advance, so how can we predict the climate M years into the future" is "because climate projection is not based on predicting the weather, but on simulating weather and then taking averages". This sort of statistical simulation is completely standard in statistics and physics, I use them myself in my own research as do countless other statisticians, physicists, computer scientists. -
muoncounter at 01:25 AM on 27 March 2011Weather vs Climate
PT#44: Irrelevant, you did not answer the challenge. You cannot possibly know the exact location and velocity of an electron; no model can defeat the uncertainty principle. By your definition, the output of your computer is thus worthless. Another example: you cannot possibly know when a cosmic ray will alter the state of your computer's memory. Since you cannot build an effective and portable shield from muons, it has happened and will happen again. You must conclude that the output of your computer is thus inaccurate and cannot be trusted. But this thread is about weather and climate. Further off-topic digressions should be deleted. -
muoncounter at 01:03 AM on 27 March 2011Weather vs Climate
PT#41, 42: Your understanding of the process used in the real world is minimal. And your continued use of 'worthless' is another example of your redefinition of words to suit your own purposes. I suggest keeping a dictionary at your computer at all times. "any result on a computer system that is not 100% accurate ... not to be trusted" OK, run a computer simulation that reports the location and velocity of an electron in a semi-conductor to 100% accuracy. If you can't, you must therefore not trust anything on your computer, or for that matter any piece of electronics you use. Better turn the lights off, because computers run those too. Or you could actually try learning about things before you pontificate. -
muoncounter at 00:46 AM on 27 March 2011Weather vs Climate
PT#34: "includes empirical testing as verification." Not always. Monte Carlo methods were introduced for the Manhattan Project (and named by physicists with a sense of humor). There was no experimental verification until the Trinity test; if memory serves, there was some doubt as to whether or not it would set the atmosphere on fire - and they went ahead with the test. There are no experimental tests in the oil industry, until you pony up and drill a well. A dry hole is merely one of the expected outcomes of a suite of potentially valid models. Best advice remains: keep your opinions to yourself unless you actually know what you are talking about. -
MichaelM at 00:41 AM on 27 March 2011Weather vs Climate
It's easy to see, in Poptech's arguments, parallels with the old creationist canard that anything less than 100% of the human eye is useless therefor it cannot have evolved. His argument is equally as easy to brush aside. -
muoncounter at 00:37 AM on 27 March 2011A Plan for 100% Renewable Energy by 2050
There are apparently two Gilles in this discussion. Gilles #63 believes "the amount of available FF is increasing with time". Gilles #82 believes that predictions of increased fossil fuel use (and thus increasing CO2 emissions) are just 'storylines.' Will the real Gilles please stand up? Preferably with some actual information in hand, rather than generic dismissals of 'basically bogus' methodologies. -
Ken Lambert at 00:30 AM on 27 March 2011A climate 'Gish Gallop' of epic proportions
John Cook and Daniel Bailey; I conducted a private correspondence with Dr Trenberth in early 2010. He is a 'class act' and was very generous with time devoted to responding while travelling to conferences etc. Since I have not asked his permission to make public any of this exchange, I am not at liberty to quote any part of it here. However, Since Dr Pielke responded to SKS in a very interesting thread - would you consider asking Dr Trenberth to respond on SKS to a number of questions regarding the current state of knowledge on the whole subject of warming imbalance and OHC measurement? I am sure many regular contributors would jump at the chance to participate. Me (and I hope BP) would be happy to ask some questions.Moderator Response:[DB] That is a great suggestion! We'll look into it; thanks for taking the time to make it!
-
Eric (skeptic) at 00:30 AM on 27 March 2011Weather vs Climate
An easy way to show how good climate models are at predicting weather is to look at climate models predicting weather, in this case ENSO, shown in forecasts from Feb 13th, Mar 16th and Mar 25th (current forecast):
My conclusion is that climate models can't predict weather. It doesn't mean climate models can't predict climate in some simplified way, but not the critical nuances (i.e. weather) that control sensitivity.
-
Refried Science at 00:27 AM on 27 March 2011Weather vs Climate
#35 "includes empirical testing as verification" And the basis of climate models are empirically tested physical laws and the results are tested by back-casting through known climate conditions. "It is interesting you mention financial analysis of which those models are just as worthless." I doubt that a corporation would keep throwing money at financial models if they didn't return something useful. -
adelady at 00:17 AM on 27 March 2011Zero Carbon Australia: We can do it
Ken "So please explain the economics of selling subsidized cheap coal to China and India and Taiwan and Japan? If we were subsidizing it, there would be a net cost to the Australian economy - not a main source of foreign exchange!" That particular economic strategy is called selling the family silver. Australia and its various resources is in much the same position as a family inheriting a large art collection and associated furniture, silver, china and valuable sculptures and manuscripts and the like as well as land and other income producing assets. Do they put in the effort to enhance their assets and earn income that way? Not a chance. Far easier to sell great-grandpa's astutely purchased paintings and granny's carefully selected Waterford crystal. Even if it costs money for valuers and auctioneers and removalists, it's so much easier to sell than to think about the best use of the wonderful resources you've been given for use and for enjoyment. And so our society, through its governments, subsidises ports, railways, transport fuel and anything else promoters of easy foreign exchange can persuade them into. And the money just rolls in. It's easy short term gains leading to long term decline when markets no longer need certain items - wool for example, or prefer valuable items we've not bothered to learn to produce or failed to take advantage of inventing - Xerox, solar thermal for examples. -
muoncounter at 00:17 AM on 27 March 2011Weather vs Climate
PT#22: "if a model produces different output per run that means something in the model is not known (randomized in some way) and thus inaccurate ... It only takes one unknown variable in a computer model to make the output meaningless. " Such summary judgments should be avoided when you don't know what you are talking about. This is exactly how many industries use computer models - to see the range of things that might happen if there is a small change in the input. Some call these Monte Carlo methods. Industries that use these type of models (petroleum exploration, nuclear engineering, operations research, military, solid-state physics, fluid dynamics, particle physics, financial analysis, network design, weather forecasting, etc) should immediately cease work because PT says they are inaccurate, irrelevant, worthless and so on. Or due to the consensus that these models are applicable, perhaps PT's assessment is inaccurate, irrelvant, worthless and so on. We can decide whether to put civilization back 50 years or ignore PT based on a flip a coin, best 2 out of 3. -
Ken Lambert at 00:09 AM on 27 March 2011A climate 'Gish Gallop' of epic proportions
CBDunkerson #5 Last time I looked the 'Measured" CERES figure quoted for the warming imbalance was +6.4W/sq.m This plainly impossible number is then 'corrected' down to 0.9W/sq.m by a process which is the equivalent of a circular scientific argument. The argument is goes like this: " Hansen (2005) thinks it is about 0.85 +/-0.15, - +0.9 for short. We build up a number of heating and cooling forcings by modelling and maths which sums to +0.9W/sq.m ". "We then 'correct' the +6.4W/sq.m down to +0.9W/sq.m and say that the meaurement agrees with the modelling!!" So CBD what is your latest information on the direct measurement of the imbalance? -
Ken Lambert at 00:00 AM on 27 March 2011A climate 'Gish Gallop' of epic proportions
Moderator - Daniel Bailey "[DB] Trenberth discusses this issue directly here on this very recent and still active Skeptical Science thread: Teaching Climate Science; a post wholly devoted to Dr. Trenberth and his work." Dr Trenberth's lecture was presented at the Symposium on Climate Change Effects on Fish and Fisheries, Sendai, Japan, 26-29 April 2009. This predates his August 2009 paper and the more recent Lyman and K&D results. Again where is a recent refutation of the K & D results?Moderator Response: [DB] K&D are discussed here. -
Ken Lambert at 23:54 PM on 26 March 2011A climate 'Gish Gallop' of epic proportions
dana1981 #7 "Ken L #4 - the Knox and Douglass paper you reference was a horrid example of cherrypicking. See Monckton Myth #1, Cooling Oceans for a better analysis of all available data." What precisely is a 'horrid example' of cherrypicking? Lyman 2010 was published in March 2010, Knox & Douglas in August 2010. Are you saying that more recent papers have refuted the Knox and Douglas results? Nothing in the link to 'Monckton Myth #1' indicates that. -
Peter Hogarth at 23:19 PM on 26 March 2011Of Satellites and Air – A Primer on Tropospheric temperature measurement by Satellite
HumanityRules at 21:31 PM on 26 March, 2011 Radiosonde thermometers are just highly accurate electronic thermometers, and will be calibrated/validated as any other precision thermometer is. The various models used will have different (but usually very high, and very repeatable) accuracy specifications, such as the one used here which claims “The deviations between the various sensors lie within a few thousandths of a degree, therefore eliminating the need for extensive calibration”. Of course small known biases between different models need correcting, and in the past some types of radiosonde thermometers have suffered from direct radiative heating from the sun. There were many papers on this as far back as the 1950s, and a great deal of effort has gone into minimising these diurnal biases and other effects in the sensor design, or more recently back-correcting the various datasets. If you Google Jean Piccard (after whom the Star Trek captain was named, apparently) you’ll get some fascinating background. -
Peter Hogarth at 22:34 PM on 26 March 2011Of Satellites and Air – A Primer on Tropospheric temperature measurement by Satellite
Glenn, a minor update for this great article, the Zou paper in your link is actually 2006, the 2009 paper is here. The T2 product in STAR V1.2 is actually corrected for diurnal drift using the diurnal anomalies from RSS. V2.0 (shown in the image) was available as of late 2010. -
HumanityRules at 22:25 PM on 26 March 2011Weather vs Climate
27 Rob Painting Do you mind explaining, in detail, exactly what scientists were predicting 4 years from the time of the prediction including some sort of uncertainty they were allowing themselves? I predict in 4 years time, barring some unpredictable event, that global temperatures will be within 0.3-0.4oC of where they are now. Does this mean I have some skill in climate science?Moderator Response: Ian has responded to you on the "Models are Unreliable thread. -
HumanityRules at 21:54 PM on 26 March 2011Weather vs Climate
Correct me if I'm wrong but the image in the article isn't a prediction. -
Gilles at 21:41 PM on 26 March 2011Weather vs Climate
given the fact that the curves are expressed as anomalies (so centered on the same average), and that there is some implicit selection of "good" parameters behind, without precision of how wide the interval of models has been chosen, doesn't like too predictive either. It is rather obvious that with some set of different bad models, centered on the right average, you can always cover a given experimental curve.Moderator Response: Ian has responded to you on the "Models are Unreliable thread. -
HumanityRules at 21:31 PM on 26 March 2011Of Satellites and Air – A Primer on Tropospheric temperature measurement by Satellite
14 Peter Hogarth You could have included this image from the HadAT website to show the global nature of the radiosonde dataset.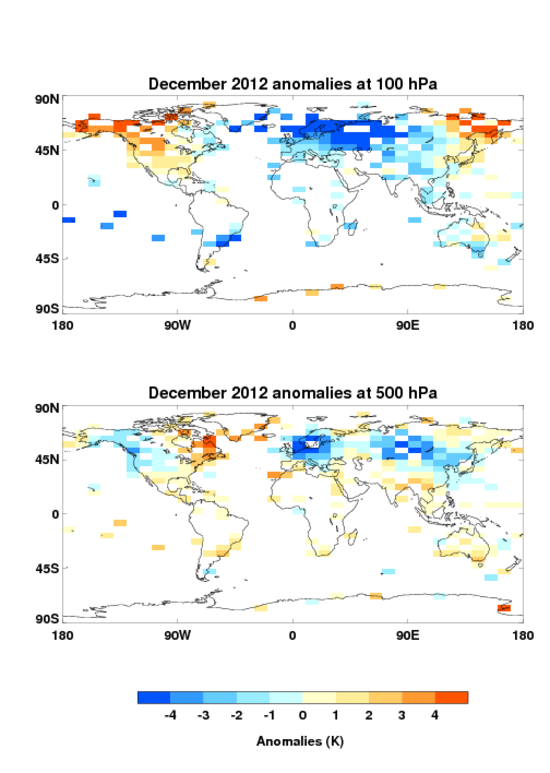 If you're validating the satellite data against the radiosonde data what do you validate the radiosonde global dataset against?
-
quokka at 21:29 PM on 26 March 2011A Plan for 100% Renewable Energy by 2050
Worldwide energy consumption in 2050 being less than today seems just a wee bit fanciful to me. IEA projects an average yearly growth of 1.2% from now until 2035 with an overall growth of 36% from 2008 to 2035. WORLD ENERGY OUTLOOK 2010 FACTSHEET Basing energy policy on wishful thinking about demand is not likely to have a benign outcome. -
Rob Painting at 21:26 PM on 26 March 2011Weather vs Climate
CharlieA @ 23 - "there is nothing in the way of proof that climate predictions have any accuracy or skill.''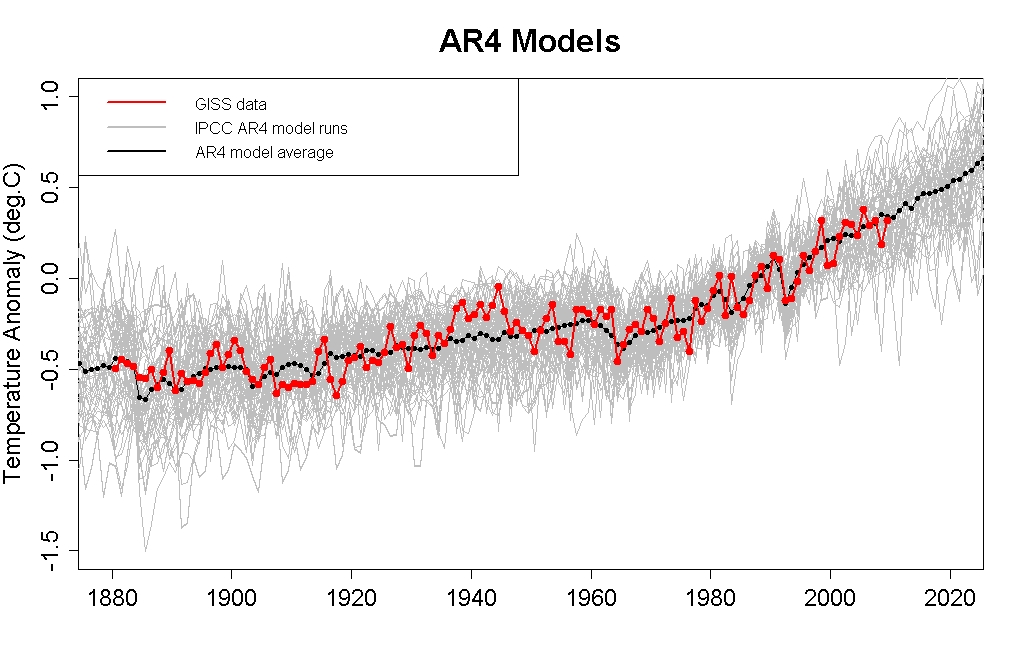 Doesn't look too shabby to me.
-
HumanityRules at 21:05 PM on 26 March 2011Of Satellites and Air – A Primer on Tropospheric temperature measurement by Satellite
Any thoughts on the spencer et al critique of the Fu work? http://mtp.mjmahoney.net/www/notes/instrument/i1520-0426-23-3-417.pdf -
Peter Hogarth at 20:56 PM on 26 March 2011Of Satellites and Air – A Primer on Tropospheric temperature measurement by Satellite
Glenn, to expand on what scaddenp has mentioned, Cloa and other readers may be interested in comparing the satellite MSU data with various global radiosonde (weather balloon) datasets for corresponding atmospheric pressure levels/altitudes, as the radiosonde data are generated from direct temperature measurements. The Remote Sensing Systems (RSS) team have generously done the work of creating and updating charts comparing RSS and UAH MSU data with radiosonde datasets such as HadAT (the UK Meteorological Office Hadley Centre Radiosonde data set) as in this chart covering most of the globe except the polar regions. There are many more plots available for the various radiosonde data sets and for comparisons at different latitude bands, including the tropics from +30 degrees to -30 degrees. It’s a great resource. There page scaddenp links to is excellent and worth repeating here as it covers data validation well.
-
HumanityRules at 20:51 PM on 26 March 2011Of Satellites and Air – A Primer on Tropospheric temperature measurement by Satellite
Glenn Tamblyn BTW thanks for the article, very informative. -
HumanityRules at 20:50 PM on 26 March 2011Of Satellites and Air – A Primer on Tropospheric temperature measurement by Satellite
10 Glenn Tamblyn "That John Christy, on of the authorts of this paper is one of the principles behind the UAH data set doesn't enter into this?" Show me a scientist who doesn't think his work is a cut above the rest? -
wild monkeys at 20:31 PM on 26 March 2011Weather vs Climate
It's like saying you can't predict that the long term average of dice rolls will be 3.5 because you can't predict the next roll. -
Gilles at 20:08 PM on 26 March 2011A Plan for 100% Renewable Energy by 2050
"There is no one single thing that correlates with the growth of wealth, but I can assure you that there are a number of other things which correlate better than either FF consumption or temperature increase" For temperatures, I agree of course. For FF consumption, show me one. ". Between coal & oil, there *is* sufficient CO2 emissions to be unlocked to make the SRES scenarios very realistic " I disagree : SRES scenarios are exactly as unrealistic for gas and coal than for oil. It's just that you didn't realize it yet, because peak oil is close and peak gas and coal a little bit more remote - but the methodology was the same for oil and for other FF : basically bogus. . SRES scenarios are just a set of storylines, and contain no scientifically assessed laws concerning energy and economy. You could have asked a 10 years old child to draw a series of bell-shaped lines with different colored pens - you would have got pretty much the same result without paying any "expert", in 5 minutes - science begins when we know how to disprove stupid hypothesis and keep the good ones - there is obviously nothing like that in the set of SRES scenarios. -
Marcus at 19:34 PM on 26 March 2011A Plan for 100% Renewable Energy by 2050
"concerning oil : I'm the first to say that we're close to peak oil, and that's why SRES scenarios are mostly unrealistic. What's your point ?" Except that oil isn't the only thing we have to worry about. Between coal & oil, there *is* sufficient CO2 emissions to be unlocked to make the SRES scenarios very realistic &-if anything-somewhat optimistic. Of course, unlike yourself, I'd rather direct our society *away* from this destructive path rather than test out the strength of the these scenarios. Seriously, I really don't know why you're wasting so much of our time with these repetitive, fact free assertions of yours. -
Marcus at 19:31 PM on 26 March 2011A Plan for 100% Renewable Energy by 2050
Marcus#77 : I already answered your questions several times : first I never stated that there was a single coefficient between GDP and energy or FF consumption. Well, just as predicted, you claim that this isn't what you've been saying, when clearly it *is* what you've been saying *all* along. Try to make up your mind Gilles. As to the correlation between temperature & wealth-well that's an even *more* bogus correlation than the one you claim exists between FF consumption & wealth. There is no one single thing that correlates with the growth of wealth, but I can assure you that there are a number of other things which correlate better than either FF consumption or temperature increase-yet still this is a fantasy that you're determined to propagate, no matter how little evidence you have to back your claims. -
L.J. Ryan at 19:09 PM on 26 March 20112nd law of thermodynamics contradicts greenhouse theory
KR 804 I "The climate, on the other hand, is driven by a band-limited solar input which does not match the thermal emissive spectra, is not greatly affected by greenhouse gases, and hence represents a fixed input, not a match to the thermal spectra at all." To further insight lets solve stepwise. The earth SURFACE has a very high emissivity (~.96)...so solar input to the earth SURFACE of 240 W/m^2 equates to~255K. Q1)Do you agree? Solar IR re-radiation via the earth SURFACE equates to ~ 240 W/m^2 emitted at 255K...this represents the temp maximum via solar radiation. Before the apoplectic visceral post, first consider the following. One litter of gasoline contains 34.8 MJ. No matter how well the losses are retarded or how slow/fast those Joules are consumed, the max possible energy/litter is as defined. Q2)Do you agree? Q3)By "thermal spectra" do you mean "atmospheric forcing"? -
WheelsOC at 19:07 PM on 26 March 2011Weather vs Climate
gallopingcamel missed the point of the pool analogy. We can project the average height of the water in the pool with a few simple variables for rate of fill, volume, etc., but we cannot predict the peak of any single wave or trough made by the splash when somebody jumps in. We can do that because predicting local, short-term weather and global average climate over long periods are two very different processes. Climate models are NOT a bunch of weather predictions glued together. Anybody trying to use this kind of argument is deeply confused on the subject. Charlie A, Skepticalscience has another post dealing with climate models and their accuracy.Moderator Response: [mc] fixed link tags -
Charlie A at 18:39 PM on 26 March 2011Weather vs Climate
The article convincingly argues that skill of climate predictions can be different than skill of weather predictions. It does not say anything about any actual comparisons of climate forecasts to actual outcomes. In other words, although it is clear that climate prediction is not the same as weather prediction, there is nothing in the way of proof that climate predictions have any accuracy or skill. -
Gilles at 18:28 PM on 26 March 2011A Plan for 100% Renewable Energy by 2050
concerning oil : I'm the first to say that we're close to peak oil, and that's why SRES scenarios are mostly unrealistic. What's your point ? -
Marcus at 18:28 PM on 26 March 2011Zero Carbon Australia: We can do it
"Wind farms need to be covered by base load reserve for the situations where light or no winds occur over a wide area. Without base load coverage - storage systems would need to cover at least a couple of day's supply to meet these weather events." ....and again, Ken, you deliberately *ignore* the existence of storage technologies more than capable of meeting 2-3 days of *zero* wind or sun. Of course the odds of the two things being *totally* absent for that length of time are incredibly slim. Also, given the large numbers of landfill & sewerage treatment plants across the Country, I'm certain that sufficient bio-gas power stations could be established to provide *emergency* base-load in those very, very rare instances when neither Wind, solar or stored power will suffice....and that's even before we consider run-of-river hydro, large-scale hydro-power & tidal stream power. Face it Ken, Coal is yesterday's news, & its only dinosaurs who desperately seek for excuses to abandon it. -
Gilles at 18:27 PM on 26 March 2011A Plan for 100% Renewable Energy by 2050
Marcus#77 : I already answered your questions several times : first I never stated that there was a single coefficient between GDP and energy or FF consumption : not more than a single coefficient between temperature and anything sensible concerning human wealth. with your logics, I could also ask : if world increase of temperature were that dangerous for mankind, how do you explain that wealth has increased by several tens during the XXth century whereas temperature have also increased ? the coefficient is not constant because a number of factors are variable : geographic, historic, improvement of techniques... again, nothing constant, just as the precise link between temperature and anything else. This does not mean that we could go to zero. look again gapminder and track the history of England , US , and China for instance; of course trajectories were not the same, not monotonous, and slopes were varying - however you cannot deny that there is a clear correlation ! -
Marcus at 18:24 PM on 26 March 2011Zero Carbon Australia: We can do it
Ken, are you *really* trying to claim that the mining industry doesn't receive the lions share of the diesel fuel rebate, which is paid for by the tax-payer? I wonder how much more expensive coal would be if the cost of mining & transporting the stuff fell 100% on the shoulders of the companies doing the mining. Rail & Port infrastructure were also built & maintained at tax-payers expense-another bill the coal mining industry doesn't have to foot. So yes, even in the export industry, the cheapness of the product relies at least in part on the subsidies enjoyed by the industry-though sheer volume also plays its part. Of course, as a commodity industry, Australia receives much less per tonne than...say, if it were to ship wind turbines or PV cells instead. Of course, Australia has been very good, this last 25 years, at getting itself into the red in terms of balance of trade. That's what comes of sending raw goods offshore for bargain basement prices, then buying finished goods back at 3-4 times what we got for the original raw materials. -
Marcus at 18:15 PM on 26 March 2011The Washington Times Talks Greenhouse Law
Here's another one for you-Ozone. In small quantities, at the top of the atmosphere, Ozone is vital for keeping out harmful levels of UV radiation-thus allowing life on Earth to flourish. Yet closer to the surface of the planet, it is an extremely harmful pollutant that can damage plants & the human respiratory tract, & contributes to photochemical smog. I'm sure there are loads of other examples of chemicals which-in the right place & quantities-are vital to us but which, in the wrong place or quantities, are extremely harmful. -
gallopingcamel at 17:01 PM on 26 March 2011Weather vs Climate
I am prepared to concede that short term weather forecasts based on Doppler radar are impressively accurate. When they tell me a storm cell will arrive in my city in 35 minutes I take evasive action. As the time window expands, predictions become more and more fuzzy. When the forecast says that it will be raining six days from now I book my golf foursome with better than 50% confidence that the weather will be fine. When the BBC predicts that the next winter will be mild I (usually correctly) expect the forecasts to be wrong to an embarrassing degree. Likewise, when various university scholars predict how many hurricanes will hit Florida I realize that their guesses made using super-computers are no better than my guess based on waving a damp finger in the air. Predicting the temperature 100 years from now is much tougher than forecasting just a few months ahead. This post does say one thing that I believe is probably correct: "A change in temperature of 7 degrees Celsius (°C) from one day to the next is barely worth noting when you are discussing weather. Seven degrees, however, make a dramatic difference when talking about climate. When the Earth's average temperature was 7ºC cooler than the present, ice sheets a mile thick were on top of Manhattan!" Many of you seem to be in favor of reducing the average global temperature. Do you hate New York so much that you want to restore that ice sheet? -
SoundOff at 16:38 PM on 26 March 2011Weather vs Climate
Weather is like a single roll of a single die (with 1 to 6 dots per face). It’s very hard to predict the outcome, even with a model. Climate is like rolling a single die roll 1000 times. It’s quite easy to predict the average outcome using a simple model. The average of all those rolls will be 3.5 +/- 0.17. Future climate is predicted by averaging many runs of a model to eliminate noise or some inherent bias towards certain initial conditions. And sometimes averages of different models are used to further eliminate bias. -
scaddenp at 15:35 PM on 26 March 2011The Libertarian Climate Conundrum
Sheesh, this is why I hate about political posts. "Comments" is now full of garbage about American politics with nothing whatever relevant to climate. Who cares who wrecked their economy - except more wrecking might improve climate. Surely there are other places for American political tribes to argue with each other? -
scaddenp at 15:30 PM on 26 March 2011It hasn't warmed since 1998
I find this a little irrelevant but I am a little out of depth. To me the "its the ocean's" argument runs like this. "An ocean cycle is causing the warming" Okay, so where is the energy coming from. "Well out of the oceans of course" So if is warming is just cycle of ocean atmosphere energy exchange, then why is total OHC increasing? I thought is was supposed to lose energy to atmosphere. Someone with more knowledge of this can tell me what I am missing.Moderator Response:[DB] Good question. If it's the ocean (discussed here), then OHC anomaly should be net zero. Since it isn't (it's actually positive, as you point out), than the ocean is retaining energy/heat (because of the Earth's radiative imbalance), despite the continual loss of heat to the atmosphere and to the melting of Arctic ice (Patrick Lockerby just released his March Arctic Ice Update #2).
See the links I just gave you for relevant discussion; a search on the term "It's the ocean" yields these results. Hope that helps.
-
Rob Honeycutt at 14:30 PM on 26 March 2011The Libertarian Climate Conundrum
PT.... Denominator? -
Albatross at 14:27 PM on 26 March 2011Weather vs Climate
"The predictive limitations are the same for climate models as they are for weather models." Nonsense. I'll elaborate later, but if someone wishes to debunk this myth please go ahead. -
grypo at 14:19 PM on 26 March 2011The Libertarian Climate Conundrum
Poptech says that there is no debate, and the premise for his argument is that the people making it are not libertarians. Another premise of that premise is that there are only one group of people who can call themselves libertarians and regard maximizing individual liberty as high value. Another premise must be that only libertarians that Poptech believes are libertarians can make arguments about libertarians, or else "no debate". This premise needs a lot of citation, not personal beliefs I'm afraid this argument PT is making fails on several levels. -
grypo at 13:51 PM on 26 March 2011The Libertarian Climate Conundrum
"No effort was made in this post to actually get feedback from real libertarians to the proposition presented. Instead a poor attempt was made to distort libertarian principles to push an agenda." This thread is about the debate inside libertarianism and which actions are more appropriate to the first two libertarian principle according to the Libertarian Party preamble. I have presented at least two libertarians who disagree with the political mainstream thought within the movement, and say that those principles are not being adhered to. Jonathan Adler describes CATO's ideas as utilitarian, not libertarian, and says they disregard property rights. He has several suggestions both in that paper and on his website that he thinks would aim the movement in the proper direction. Tokyo says about CATO, "Cato and other vocal 'libertarian' organizations are in fact corporate fronts and won't bite the hand that feeds them, and thus avoid delving too deeply when they defend a 'free market' that is predominated by organizations that are not controlled by shareholders or communities and that are dedicated to extracting gains irregardless of costs that others may be forced to bear." So, do you agree with those libertarians, or do you agree with CATO's approach, and if so, please tell us how to satisfy libertarian principles. If there are ideas that have not been mentioned that you think should be, please detail those. Rothbard says, on page 153, "Air pollution, consisting of noxious odors, smoke, or other visible matter, definitely constitutes an invasive interference. These particles can be seen, smelled, or touched, and should therefore constitute invasion per se, except in the case of homesteaded air pollution easements. (Damages beyond the simple invasion would, of course, call for further liability.) Air pollution, however, of gases or articles that are invisible or undetectable by the senses should not constitute aggression per se, because being insensible they do not interfere with the owner's possession or use. They take on the status of invisible radio waves or radiation, unless they are proven to be harmful, and until this proof and the causal connection from aggressor to victim can be established beyond a reasonable doubt." The 2nd link downplays the effects of climate change and makes utilitarian arguments. These are covered in the post and are at the crux of Adler's arguments. Perhaps you can be more specific as to how those arguments made by Rothbard and Capella satisfy the most important libertarian principles. -
Rob Honeycutt at 13:17 PM on 26 March 2011The Libertarian Climate Conundrum
I've run into a number of Libertarians who live in this same alternate universe where they believe if the administration had just done nothing everything would have been just fine. Problem is, everyone who knows anything at all about macroeconomics knows that utter foolishness. (Don't forget, Bernanke is a conservative... read his comments on Friedman.) -
Rob Honeycutt at 13:14 PM on 26 March 2011The Libertarian Climate Conundrum
Poptech @ 82... There's not an economist in the world that would agree with you on any of the points you're making. Do you somehow think that Obama came into office and just started willy-nilly stimulating the economy for no apparent reason? Do you not remember the economy was in an all out free fall about the time of the election? What is it about Libertarianism that makes your memory so limited? Oh yeah... I almost forgot. We're in the Poptech alternate universe.
Prev 1835 1836 1837 1838 1839 1840 1841 1842 1843 1844 1845 1846 1847 1848 1849 1850 Next


