


 Arguments


Recent Comments
Prev 1836 1837 1838 1839 1840 1841 1842 1843 1844 1845 1846 1847 1848 1849 1850 1851 Next
Comments 92151 to 92200:
-
Rob Honeycutt at 12:57 PM on 26 March 2011The Libertarian Climate Conundrum
Poptech @ 79... That's right. It looks to me like Milton Friedman's ideas have not panned out so well over the past 30 years. @80... And the job losses are not a function of Obama's policies they were a direct result of the policies of the previous administration. -
johnd at 12:47 PM on 26 March 2011It hasn't warmed since 1998
muoncounter at 12:40 PM, only for those unable to distinguish the difference between quality and quantity. You were saying......?
-
muoncounter at 12:40 PM on 26 March 2011It hasn't warmed since 1998
johnd #87: No, those links point to global temperature anomalies. Following the data trail, one finds oceans included in those global temperatures. More data are better, yes? -
johnd at 12:28 PM on 26 March 2011It hasn't warmed since 1998
DB, on the comments page your responses are labeled as below. Moderator Response: [DB] You've made an extraordinary claim, were called on it and have since hastily waved hands while backtracking. The burden of proof is on you to prove your claim with some actual analysis, not for others to disprove it. ......................... ( -Moderation complaints snipped- ). ( -Moderation complaints snipped- ). I have not backtracked at all. The assertion I made was very, very simple and straight forward. It is you in fact that is backtracking, having first producing irrelevant information in order to challenge my assertion, now having thrown your hands in the air and deciding it's impossible and trying to turn it around. I have nothing that disproves what is evident on the graph I supplied, sorry. End of story I think.Moderator Response:[DB] Again, you made an (unfounded) assertion simply unsupported by the science and data at hand, you were called on it and have done little since but wave your hands, backtrack and complain about it.
It is up to the asserted to support claims with published peer-reviewed literature and/or analysis of their own which supports their contentions (this is called science). Which you have not done and complain about having to do. That is your choice and right.
The readers of, and the participants in, this forum remain skeptical of your claims until then.
-
johnd at 12:11 PM on 26 March 2011It hasn't warmed since 1998
muoncounter at 11:33 AM, your "here and here" links do not lead to SST data. -
Marcus at 12:06 PM on 26 March 2011A Plan for 100% Renewable Energy by 2050
Still, great to see Gilles tirelessly pushing on with his mythology regarding fossil fuel consumption & wealth. If it were that simple, then why does Saudi Arabia, with per Capita CO2 emissions of around 16t (as of 2007), have per Capita GDP of less than US$17,000? Why does the US, with its massive per capita output of CO2 (19t as of 2007) still have so many problems with poverty, homelessness, crime & mortality as compared to its European Counterparts-most of whom have significantly lower CO2 emissions per capita? Why is it that, even though 18th-19th centuries, England consumed massive amounts of coal, yet the average citizen of England was still living the same "hand-to-mouth" existence that they were back in the 16th & 17th centuries? You see, time & time & time again we can find loads of examples of where Gilles over-simplistic "Fossil fuels consumption=wealth" metric just doesn't equate well to the *real world*! -
Rob Honeycutt at 11:59 AM on 26 March 2011The Libertarian Climate Conundrum
Poptech... The market doesn't seem to share your interpretation of "interventionist Keynesian policies."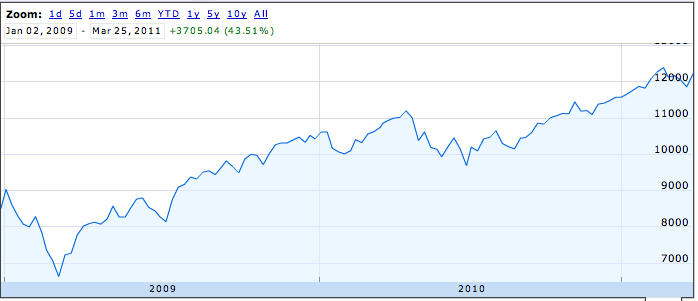
The Dow Jones average since Obama took office And isn't interesting how applying the same laissez faire policies in the US have translated into falling real incomes for Americans over the past couple of decades while enriching an ever thinning class of ultra wealthy.Moderator Response: [DB] Annotated graphic. -
johnd at 11:58 AM on 26 March 2011Weather vs Climate
JMurphy at 10:51 AM, I don't think so, you can only wish. Most certainly, his forecasts would not be available on-line, it is a subscriber paid for service, tailored according to individual requirements and distributed directly to each subscriber, updated as necessary. He claims about 80% success rate, keep in mind his forecasts are very specific, in both outlook periods and specified coverage,not your usual BOM general forecasts of 50% chance of above and 50% chance of below outlooks produced for whole states. Even BOM and CSIRO claim they are several years away from producing useful and reliable forecasts with the government being asked to put up a large sum for purchasing new "super computers", I think that was the they term used. If you are not going to subscribe to his service, then you may have to be satisfied with reading testimonials from satisfied subscribers. He originally worked for BOM, but his thinking on what data was needed to make forecasts more accurate differed to theirs, so he left to start his own commercial forecasting service. His advantage was that he had found that incorporating IO data increased substantially the accuracy of his forecast models putting him about 10 years ahead of BOM in that regard, something I think we have discussed previously. He has continually added data from all ocean areas around Australia that wasn't previously being used for modeling. -
Marcus at 11:54 AM on 26 March 2011A Plan for 100% Renewable Energy by 2050
Oops, seems I was *wrong*. according to this and this, the gap between production & consumption is even more dire than I thought. -
Marcus at 11:44 AM on 26 March 2011A Plan for 100% Renewable Energy by 2050
muoncounter, the other point to be made about Gilles 'facts' are this-#1, the graph conveniently ends at 2006 & #2, he fails to mention how Giga-barrels per year (or even total Giga-barrels) is leveling off at a dangerous rate-especially when you consider his previous graph, showing increased demand for oil. If total global oil reserves continue to level off whilst demand increases, then all I can say is that we're *stuffed*-unless we're smart & start to reduce our global oil consumption *now* by moving more towards better efficiency & increased use of bio-fuels. -
muoncounter at 11:33 AM on 26 March 2011It hasn't warmed since 1998
johnd #85: "if you believe that there is no downtrend evident over the last 8 years then produce the relevant data that can be analysed." Produced here and here. Just look up this very thread or at a number of other 'global warming stopped in ... ' threads. If you're going to be a serious skeptic, you must try harder. -
JohnHarrington at 11:28 AM on 26 March 2011Weather vs Climate
I like the terminal cancer patient analogy. No doctor can tell how the patient will feel a week from now, but with certain cancers, they can tell with a high degree of probability, similar to the confidence levels in the IPCC reports, that he will die within a certain time frame. I like this analogy because I think the reasons for the short term uncertainty and the relative long term certainty are similar. -
Philippe Chantreau at 11:20 AM on 26 March 20112nd law of thermodynamics contradicts greenhouse theory
Damorbel, you've got nothing to say. Cut the BS and answer the substantive questions: Energy of a photon E=h.v Where is the temperature of the source? You have not the slightest clue of what you are babbling about and neither does LJR. "Trolling" is the only accurate way to describe what both of you did on this thread. -
johnd at 11:18 AM on 26 March 2011It hasn't warmed since 1998
DB, the reason it still appears false to you, is that you haven't changed anything. It is still the complete period Feb 2003-2011 that you are using as a benchmark instead of examining what is plainly evident within that period. I think that you took your eye of the pea whilst trying to switch thimbles. There was no comparator period necessary, the trend of the period covered by the last 8 years is the subject in question. The challenge still stands, if you believe that there is no downtrend evident over the last 8 years then produce the relevant data that can be analysed. If you are now going to start claiming 8 years is insignificant, then why did you start using a 8 year period to try and make a point. Further to the point of being consistent, if data beyond 60S-60N is that important to you then why did you start posting maps that indicate no data beyond that point. Also it would help tremedously if your replies were made in the same manner as all other participants so that your posts appear at the top of the comments page as they are made. That also allows the order of each response being posted to be followed if replies to different posts, and different posters, are being made.Moderator Response:[DB] You've made an extraordinary claim, were called on it and have since hastily waved hands while backtracking. The burden of proof is on you to prove your claim with some actual analysis, not for others to disprove it.
-
muoncounter at 11:04 AM on 26 March 2011A Plan for 100% Renewable Energy by 2050
Gilles #73: "what's the difference with : because they create more wealth ?" Create more wealth, for whom? "I didn't say that - i did say that it could be necessary to pay for it" Yeah, you did, in #68: "it may cost a little, but much less than giving up your job." As for your 'facts' (a bad choice using BP), oil sand reserves didn't just materialize in '98-'99. They were booked when the market price made it economic to book them. Those numbers are very fluid: Booking reserves was always an experience in answering the question 'what would you like it to be?' But a look at the very next graphic in the article you plucked your 'fact' graph from (and please cite your sources, else folks will justifiably think you're making stuff up) shows a very disappointing result: So your 'fact' inadvertently tells the truth about oil sands: They are a tiny segment of overall production. Unfortunately, the steam assisted recovery technology now in use produces more GHGs than traditional recovery methods.
So your use of facts remains inconsistent. At least your style is consistent: An outrageous declaration provokes a response; your reply is invariably 'you misunderstand' or 'I didn't say that.' As the Cajuns say, C'est tout la même chose, n'est pas?
So your 'fact' inadvertently tells the truth about oil sands: They are a tiny segment of overall production. Unfortunately, the steam assisted recovery technology now in use produces more GHGs than traditional recovery methods.
So your use of facts remains inconsistent. At least your style is consistent: An outrageous declaration provokes a response; your reply is invariably 'you misunderstand' or 'I didn't say that.' As the Cajuns say, C'est tout la même chose, n'est pas?
-
JMurphy at 10:51 AM on 26 March 2011Weather vs Climate
johnd, once a forecast has been made by Mr Holton, it must be available online somewhere, so that comparisons can be made between forecast and reality ? Do you know where this can be found, or do you know what his success rate is ? -
Albatross at 10:46 AM on 26 March 2011It hasn't warmed since 1998
Ignoring for a moment the futility and folly of using short-term trends (less than 15 to 20 years), consider the linear trend in global SSTs from Hadley for different periods of time.Note what happened between 1979 and 1987. Now can we please stop playing this juvenile and unscientific game of cherry picking "skeptics"?
-
Alex C at 10:34 AM on 26 March 2011Weather vs Climate
Darn it Albatross, stole my word. A thought, perhaps you could include a hyperlink to where someone might find some info about Burroughs' book? Maybe an abstract or review, not Amazon but something informative. -
Alex C at 10:31 AM on 26 March 2011Weather vs Climate
The attempt to find an analogy for this downplays the fact that the driving forces behind changing weather and changing climate are so fundamentally different that it ought to *be* the go-to analogy. That this argument even exists is a travesty for legitimate debate regarding global warming. However, good article: succinct, as it should be. -
johnd at 10:24 AM on 26 March 2011Weather vs Climate
JMurphy at 10:11 AM, Ian Holton is considered one of the best. However I'm not sure how you will be able to compare his forecasts to others without subscribing to his service, or if you are even in the region he provides services to. Are you going to subscribe? -
Albatross at 10:22 AM on 26 March 2011Weather vs Climate
JMurphy @10, Surely he means groups like IRI or ECMWF when referring to "progressive ones"? ;) Very nice post dansat-- succinct and informative. Yet another ridiculous "skeptic" myth busted. -
JMurphy at 10:11 AM on 26 March 2011Weather vs Climate
johnd, I've asked you this before but maybe you missed it, so I hope you see this : can you give the names of those "progressive" forecasters, so it is possible to compare their results against the "mainstream" ones ? -
Gilles at 10:10 AM on 26 March 2011A Plan for 100% Renewable Energy by 2050
" And you have some data to substantiate this fancy scenario of yours? " yes of course, I have : do you know an oil company who closed a well before it wasn't profitable anymore ? " Or is it just the fancy colored graphical result of your profundity in #63, "the amount of available FF is increasing with time"?"" Again, just facts of course the amount of still available resources will decrease at some point , but not the URR (including past production).
-
johnd at 10:09 AM on 26 March 2011It hasn't warmed since 1998
Response: [DB] "Demonstrably false:" Demonstrably wrong! The image you posted is the anomaly for the entire period Feb 2003-2011 against the average 1951-2002, so it is irrelevant to the very simple observation I had made. This image, even at the scale it is, allows the downtrend to be observed. Perhaps you could instead produce actual data for the last 8 years that can be examined in finer detail if you believe that this image does not support my assertion. Moderator Response:
[DB] Wreeennncccch (sounds of metal protesting as goalpost are moved)!
As it stands, your initial phrase was false, so I pointed it out. And it still is, as you specified no comparator period. Where your logic falls apart is in your cherry-pick of a short period of time that is statistically insignificant. So let's recompute, using the period shown in your graphic (why 60S-60N when more data is available?):

Yup, still false.
-
muoncounter at 10:08 AM on 26 March 2011Weather vs Climate
We can't predict where and when an individual earthquake will occur, but we sure can say where the areas of highest seismic risk are. And there are numerous well-documented cases of anthropogenic influence, notably Healey et al 1968, The Denver Earthquakes, caused by waste water injection wells at the Rocky Mountain Arsenal. To go one step further on the absurdity index, small earthquakes are generally harmless; in large quantities (magnitude), not so good. -
Gilles at 10:05 AM on 26 March 2011A Plan for 100% Renewable Energy by 2050
Mucounter :"the two reasons we look for more resources are 'greed and envy.'" what's the difference with : because they create more wealth ? "Tell my colleagues, who must calculate whether they can afford to work at the current price of gasoline, that their car is 'an income.'" I didn't say that - i did say that it could be necessary to pay for it to get an income. If you can go to your job without car, that's fine. If you must have one, you accept it. That's just like oil : if it flows spontaneously from the ground, that's fine. If you must fetch it at 5000 thousands feet under the oceans ... well you accept it. But nobody would buy it if it weren't a precious resource. les : again, I have no reason to believe you understand things better than me - including the knowledge of who I am. So I'm waiting for your real arguments before answering. -
Don9000 at 09:55 AM on 26 March 2011The Washington Times Talks Greenhouse Law
The Washington Times has also published an editorial, on 23 March, which is filled with delightfully inflammatory statements. Here is a sample paragraph: "In 2007, the Supreme Court ruled that carbon dioxide - the harmless gas essential to all life on this planet - is somehow a “pollutant” and the EPA is within its authority to regulate it under the Clean Air Act. The decision swept away any vestige of restraint on the agency and resulted in a cascade of global-warming fear-mongering that has ginned up anti- industrial regulations that are crippling America’s ability to power civilization." Boy! as an American I'm proud that the CEI is worried about my nation's ability to "power civilization"! In an earlier paragraph, the editorial implies that the EPA's proposed course of action is based on very poor economic science: "When EPA clean-air regulations become fully operative, they will send shock waves through the American economy. The agency’s claim of long-term benefits totaling $1.3 trillion is inflated, according to a report released March 17 by the Competitive Enterprise Institute. The purported financial gain is overstated due to “accounting tricks and gimmicks” and doesn’t consider capital expenditures factories will pay to comply with the rules." While Vaugh's analysis of the economic benefits or costs of the EPA's plans may be accurate (I have a doctorate in English, so I cannot comment authoritatively on the analysis), it is quite clear from reading through several of the CEI's reports and articles, and the site's "about CEI" page, that CEI is fundamentally opposed to government regulation of economic activities in just about any way, shape, or form, and many of the claims I saw in these other publications are clearly inaccurate. Thus I want to pose a question: Has anyone taken a more detailed look at the CEI website? It seems to me it might be worth the effort to debunk one or more of the articles on the environment put out by this organization, especially since they are probably read by many GOP lawmakers or their aides. CEI has this to say about its publications: "CEI publishes high-quality original research on a variety of issues and in several formats. Web Memo: CEI’s policy brief series designed for easy understanding of policy issues. OnPoint: CEI’s series of short policy white papers, which distill current issues in an easy-to-read format. Issue Analysis: CEI’s series of full-length policy monographs, which look at issues from a broad perspective." -
2nd law of thermodynamics contradicts greenhouse theory
An object, at 20C, has an 80% absorptivity for 6 micron photons. Absorptivity is unchanged by temperature - the temperature is for later reference. (q) The object is struck by a 6 micron photon from a hotter object (40C) which includes 6 microns in it's emission spectra. What is the probability of absorbing the photon? (a) 80%. (q) The object is struck by a 6 micron photon from a cooler object (0C) which includes 6 microns in it's emission spectra. What is the probability of absorbing the photon? (a) 80%. Photons do not carry ID cards (the earlier quote was originally from me, I believe) indicating the temperature of the emitting object. The temperature of the emitting object is not encoded in the energy of an individual photon. Absorption depends only upon the individual photon energy and the (separate) object absorptivity spectra. You cannot refuse that 6 micron photon because you somehow "know" that it came from something colder. A spectra of photons can be statistically analyzed to determine the temperature required to emit that spectra (given some idea of the emission spectra of the object), but individual photons have energies, not temperatures. And each individual photon adds to the energy of the absorbing object. --- All of these 2nd law objections are based upon one or more such fundamental misunderstandings of physics, and are hence incorrect. The radiative greenhouse theory is entirely supported by thermodynamics. -
les at 09:31 AM on 26 March 2011A Plan for 100% Renewable Energy by 2050
Gilles: "les : sorry, but what I'm saying is just a summary of the history of the industrial civilization : increased efficiency has led to continuous increase of both energy consumption and GDP" no it's not. I'll explain tomorrow. "what don't you understand ?" You. thanks for asking. You clearly want to seem intelligent but don't give your self a chance. I don't understand that. Still, your choice. -
scaddenp at 09:28 AM on 26 March 2011It hasn't warmed since 1998
Convection? More marked in upper ocean. As SSTs are not trending down. The upper 700 do show ESNO variation. I don't see the problem here. -
funglestrumpet at 09:10 AM on 26 March 2011Weather vs Climate
I came across a useful way of describing this the other day, but I forget where: The climate trains the boxer, but the weather delivers the punches. -
Ed Davies at 08:49 AM on 26 March 2011Weather vs Climate
How about "yeah, right, we can't predict individual waves so tide tables are useless, too"? -
johnd at 08:44 AM on 26 March 2011Weather vs Climate
David Horton at 08:25 AM, I agree with you regarding short term weather forecasts, however when it comes to seasonal forecasts, or looking a year or two ahead, it becomes a different matter. The ability to make such forecasts accurately is improving, but in terms of progress the mainstream forecasters are perhaps years behind some of the more progressive ones. Generally you get what you pay for, and some of the free services are simply too costly to follow. -
johnd at 08:33 AM on 26 March 2011Zero Carbon Australia: We can do it
adelady at 07:52 AM, actually that is quite a useful analogy. In a climate sense the centralised data processing area is that area where various systems converge periodically, such as, I'll mention yet again, the coinciding of a La-Nina and the -ve IOD bringing it's own version of RSI, and need for compensation. -
David Horton at 08:25 AM on 26 March 2011Weather vs Climate
The "can't predict the weather tomorrow, therefore ..." comment, so often used in what the deniers think is a crushing final killer argument, is very odd indeed, the more you think about it. The weather forecasts in most parts of the world are now extremely accurate. Our local one here will tell you what time it will begin raining, how much rain is likely, when and where a thunderstorm will hit, when clouds will clear, what wind directions and strengths to expect, and so on. On the odd occasions when it is wrong it is only wrong in detail, for example the rain being delayed in its arrival by an hour or two. Someone who says that weather forecasts are inaccurate then can only be remembering back to a much earlier time, a time when isobars were based on a few weather stations and drawn by hand in small generalised maps in newspapers; where the forecast of rain could only be refined by what time it rained in the neighbouring town; where a front might peter out and slip away to the south before anyone could be aware of that fact; when conversely a cyclone might arrive out of nowhere; and where the dynamics of interacting weather systems were barely understood. I remember these kinds of forecasts from the 1950s, and I am sure that the deniers are harking back to that time (or even earlier) as well. The fact that weather forecasts now are extraordinarily accurate is the result of the huge growth in monitoring stations and weather satellites and computer analysis and well developed theories about rainfall and wind behaviour. All of the same factors that make our understanding of climate change so advanced. Time the deniers got to know which way the wind blows and why and when. Oh and if the weather forecast says take an umbrella, take an umbrella, a hard rain is going to fall. -
johnd at 08:17 AM on 26 March 2011It hasn't warmed since 1998
scaddenp at 06:57 AM, if total OHC measured 0-2000m is increasing, whilst OHC 0-700 is not, then what mechanisms are allowing this to happen. If it is due to the atmosphere/ocean interaction, then SST's will show that, but they don't, actually trending down the last 8 years or so. For the deeper ocean 700-2000m to be accumulating heat whilst 0-700m is not, it can only mean, assuming measurements are adequate and accurate, that whatever solar radiation being absorbed in the upper layers is either being offset somehow or being speedily transferred to the lower levels. But that amounts to a lot of heat that has to transfer through the surface, and then 700m of water, without leaving a trace, to deposit enough heat in 1300m of water, enough to cause the average OHC of 2000m of water to increase.Moderator Response:[DB] "If it is due to the atmosphere/ocean interaction, then SST's will show that, but they don't, actually trending down the last 8 years or so."
Demonstrably false:
 Geo77 at 08:04 AM on 26 March 2011Weather vs Climate
You could spend a lot of time thinking up analogies to this absurd argument. How's this one - going in a different direction: Saying you can't predict climate change if you can't exactly predict tomorrow's weather is like saying you can't determine who will likely win when the Miami Heat plays the Minnesota Timberwolves (substitute your favorite sports mismatch)unless you know the exact spot on the court where every player will be when there are exactly 8 minutes left in the 4th quarter.damorbel at 07:54 AM on 26 March 20112nd law of thermodynamics contradicts greenhouse theory
Re #847 Response: [Dikran Marsupial] The "they" in.... you can't tell from a single photon the temperature of the emitting body," Indeed you can't. But what you do know is the amount of energy the emitting particle has (or more accurately 'had') and that is (was) its temperature. Further: "you need to look at the distribution of energies of a large number of photons and do some curve-fitting (and make an assumption or two" Only true if you have a large number of particles. If you have a large number of particles ('real' particles - not photons) they are continually colliding and thus exchanging energy. Because of this they all have different energies and thus different temperatures but the critical point is they have an averge energy that corresponds to the measured (average) temperature.adelady at 07:52 AM on 26 March 2011Zero Carbon Australia: We can do it
Ken L RSI .... now with jobs less secure. Not exactly. It's almost the same issue as centralised power generation using fossil materials. The reason for the decline was firstly, H&S rules outlawing ridiculous demands (like a minimum 13000 keystrokes a day) in centralised data processing areas. Secondly, getting rid of centralised data processing areas by distributed use of computers throughout organisations. Works a whole heap better when just about everyone does part of it than when a few do all of it. A bit like wind all over the place, solar all over the place, tidal where there are tides, run of river where rivers run rather than centralised units requiring lots of work to constantly supply raw materials =and= concentrated effort to produce something better and more easily done where resources are available for no effort in the first place. It's not a wonderful analogy but it is an analogy.Rob Honeycutt at 07:48 AM on 26 March 2011The Libertarian Climate Conundrum
Poptech @ 69... Hong Kong, since the turnover to China, has been called an SAR. Special Administrative Region. The areas inside China close to HK, coastal Guangdong province, is called the SEZ, a Special Economic (development) Zone. Those are the accepted terms.Rob Honeycutt at 07:44 AM on 26 March 2011The Libertarian Climate Conundrum
Poptech @ 71... Again, Milton Freedman is ascribing to economics what is more likely a function of location. Go take a look at the economic performance of Singapore. Vastly different economic system and yet almost identical economic performance. You may not realize it yet but lots of people are rethinking much of what Friedman put forth and looking back again at Keynes.muoncounter at 07:42 AM on 26 March 2011A Plan for 100% Renewable Energy by 2050
Gilles #67: "the amount of FF we will extract will depend only on our technological capabilities ... and not at all on fancy colored graphics and fancy scenarios" And you have some data to substantiate this fancy scenario of yours? Or is it just the fancy colored graphical result of your profundity in #63, "the amount of available FF is increasing with time"?muoncounter at 07:37 AM on 26 March 2011A Plan for 100% Renewable Energy by 2050
Gilles #68: "... the only reason why we are looking for more and more resources." You clearly did not work in the same oil industry as I did. In the words of a former president of the AAPG, the two reasons we look for more resources are 'greed and envy.' "Thinking energy sources as a "cost" is a profound mistake : it's an income ... it may cost a little, but much less than giving up your job." You must live in the best of all possible worlds. I get paid the same regardless of the manner in which I travel to work. My car costs money to operate; that is effectively a reduction in my take-home pay that I would not have if I bicycled, walked, car-pooled. Tell my colleagues, who must calculate whether they can afford to work at the current price of gasoline, that their car is 'an income.'WSteven at 07:11 AM on 26 March 2011Weather vs Climate
No, no. The stovetop represents climate change due to anthropogenic CO2. The campfire represents climate change due to natural events (ie: solar irradiance, rotational precession, etc...). Sorry, feeling the need to be a bit silly.scaddenp at 07:09 AM on 26 March 2011There's no empirical evidence
cloa513 - if we knew everything, then there would be no need to invest in the science. This site is about the science of climate, and in particular pushing against disinformation. I dont like the disinformation industry - telling lies for financial gain is wrong. I think governments should be making the decisions based on best available information, and we will run into trouble with climate before we run out of oil and long before we run out of coal. You are suggesting a PR campaign to sell an idea to an electorate - might work but that would be telling lies too.johnd at 07:02 AM on 26 March 2011Weather vs Climate
flambeaub at 06:37 AM, your analogy amounts to what might be determined in a laboratory exercise. Putting that pot of water onto a campfire might leave you concluding that it is never going to boil, as I'm sure many experienced outdoors might testify to.scaddenp at 07:02 AM on 26 March 2011Why we have a scientific consensus on climate change
"why don't you simply read AR4 instead of loosing your time here ?" I couldnt agree more! However, the reason this site exists because is people dont and worse a huge amount of disinformation is thrown out. And so the science gets discussed. Debate is worthwhile so long as debaters back their claims and so debate is on the basis of the facts available dont you think?scaddenp at 06:57 AM on 26 March 2011It hasn't warmed since 1998
Its a coupled ocean/atmosphere phenomena. Tricky to assign a "cause" to the atmosphere. Why do the trades fail? However, the point really is that upwelling is heat exchange. Look at total OHC. If the current warming was just an ocean cycle, then why is total OHC increasing? So far decadal prediction eludes us. That's why climate is defined in terms of 30 year averages. What the overprint of global warming tells you is that the temperature of the peaks in ENSO events of the same magnitude is increasing.flambeaub at 06:37 AM on 26 March 2011Weather vs Climate
A very simple analogy is that if I put a pot of water on my stove and turn the heat to "high", I can say with a great deal of confidence that it will boil. What I can't tell you is the exact minute and second it will boil, nor where in the pot the first bubble will appear nor where and when any of the subsequent bubbles will appear.damorbel at 06:22 AM on 26 March 20112nd law of thermodynamics contradicts greenhouse theory
Re #846 Response: [Dikran Marsupial] I think you need to read the article that you introduced to the discussion here a little more carefully. Note the author talks about the 'temperature' of a photon, the quotes imply that the meaning of temperature was not the usual meaning of the word. I think the last sentence of Paul Walorski's article sums up the matter quite well:- "So it's not so much that the photons are all at a temperature of 2.7K but rather that they appear as if they were emitted by a single blackbody which was itself at a temperature of 2.7K." That would only be true if the Planck spectrum and the Maxwell-Boltzmann distribution were equivalent. My use of the word 'equivalent' is deliberate. Re #844 Philippe Chantreau. I'm sorry you have this reaction but the 2nd Law is what is in question. The 2nd Law of Thermodynamics it is very well established, it is not easy to grasp all its implications and failure to take them into account has brought many a beautiful hypothesis crashing down. I'm afraid the concept of temperature is just about as close to the heart of the 2nd Law as you can get.Moderator Response: [Dikran Marsupial] The "they" in the sentence is the key there, you can't tell from a single photon the temperature of the emitting body, you need to look at the distribution of energies of a large number of photons and do some curve-fitting (and make an assumption or two).Prev 1836 1837 1838 1839 1840 1841 1842 1843 1844 1845 1846 1847 1848 1849 1850 1851 Next


