Climate Science Glossary

Term Lookup

Enter a term in the search box to find its definition.

Settings

Use the controls in the far right panel to increase or decrease the number of terms automatically displayed (or to completely turn that feature off).

Term Lookup

Settings


All IPCC definitions taken from Climate Change 2007: The Physical Science Basis. Working Group I Contribution to the Fourth Assessment Report of the Intergovernmental Panel on Climate Change, Annex I, Glossary, pp. 941-954. Cambridge University Press.

Home Arguments Software Resources Comments The Consensus Project Translations About Support

Twitter Facebook YouTube Mastodon MeWe

RSS Posts RSS Comments Email Subscribe


Climate's changed before
It's the sun
It's not bad
There is no consensus
It's cooling
Models are unreliable
Temp record is unreliable
Animals and plants can adapt
It hasn't warmed since 1998
Antarctica is gaining ice
View All Arguments...


Username
Password
New? Register here
Forgot your password?

Latest Posts

Archives

What would a CO2-free atmosphere look like?

Posted on 11 March 2011 by Chris Colose

The ability for CO2 to warm the surface of a planet through the absorption of infrared radiation is well known.  What is much less appreciated, however, is just how effective of a gas it is in maintaining the greenhouse framework that helps to characterize the modern climate.

The question of how the climate would change in a completely CO2-free atmosphere was brought up recently in a testimony to the subcommittee of the House Science and Technology Committee.  An answer was provided by MIT scientist Dr. Richard Lindzen, who suggested that such a hypothetical removal of all the CO2 in the air would translate into a global cooling of about 2.5 degrees, presumably in Celsius (see here, about 47 minutes into the video).  Dr. Cicerone, who was also on the panel, expressed disagreement although didn't really provide a better answer of his own.

It may be that Lindzen was just giving an estimate off the top of his head in a hearing, but the question is nonetheless interesting to explore further because it provides perspective on how to decompose the greenhouse effect into its individual components and the underlying implications of having a mixture of both condensing (i.e., those that reach saturation values and precipitate from the air) and non-condensing greenhouse gases.  On Earth, water (which is radiatively active as a gas or a cloud) is the only condensable substance in the atmosphere, while the "long-lived" greenhouse gases (mostly CO2, CH4, O3, or N2O) do not precipitate from the air under modern temperature or pressure regimes. 

One might naively suggest that removing all the CO2 in the atmosphere would produce a similar temperature change as doubling CO2, just in the other direction.  Even without considering the complex nature of feedbacks, this conclusion would be wrong however.  The radiative forcing generated by CO2 change goes as the logarithm of the concentration, and thus removing the whole CO2 inventory would generate a much larger impact than had you doubled it.  In fact, when you get to very small amounts of CO2 (on the order of a few parts per million), the radiative forcing is much faster than logarithmic since you’re opening up new opacity in the central 15 micron band where Earth is strongly emitting (it is for this reason methane changes are commonly cited as being “more powerful than CO2,” which is only true molecule-for-molecule in the modern atmosphere, as methane is starting off at much lower background concentrations.  Methane has no intrinsic properties that make this the case, and when comparing with CO2 side-by-side is even worse of a greenhouse gas).

Even this qualitative reasoning might have led Lindzen to a better ballpark answer than just 2-3 C, which would be even too small if feedbacks were completely neutral.  It’s still qualitative however, and getting a better handle on the question requires radiative transfer modeling and simulations that can adequately handle a greenhouse-free atmosphere without blowing up.  From here, the first question one can ask is how much of the total greenhouse effect is provided by CO2?  This is dependent on the background atmosphere itself, since overlapping absorption with other molecules will give a different number than if that molecule were all by itself, even at the same concentration. When you do these calculations with overlapping absorption, it was found by Schmidt et al (2010) that CO2 contributes to about 20% of the modern greenhouse effect.  The greenhouse effect can be defined energetically as:

where Ts and Te are the surface (288 K) and emission temperature (255 K), respectively. σ is the Stefan-Boltzmann constant.  It follows that CO2 alone provides nearly 30 W/m2 of radiative forcing, much larger than the ~4 W/m2 when you double it in the modern climate.  Assuming the same climate sensitivity, Lindzen’s estimate of a 2.5°C drop for a -30 W/m2 forcing would imply that currently doubling CO2 would warm the planet by only a third of a degree at equilibrium, which is well outside the bounds of IPCC estimates and even very low by most skeptical standards.

At this point, we need to incorporate feedbacks into the problem in order to get a better feel for how nature really operates.  It is often mentioned as a somewhat routine talking point that “water vapor is the most important greenhouse gas.”  This is true in the sense that it makes up the bulk of the infrared opacity in our atmosphere (~50%, and clouds another 25%), but because it condenses at Earth-like temperatures is very short-lived in the air as it goes through the evaporation, condensation, and precipitation cycle.  Because of the temperature-dependency on the pressure at which water saturates, this makes water vapor a feedback.  Another interpretation would then be that the non-condensing greenhouse gases (chiefly CO2, only about 5% of the greenhouse effect is provided by ozone, methane, N2O, etc) are the “most important,” since they provide enough warming so as to produce the skeleton by which the water vapor greenhouse effect can be strong enough.

There have been a number of studies which examine the evolution of the climate system with no CO2 in the atmosphere.  Such experiments are described for example in Pierrehumbert et al (2007) , or by Voigt and Marotzke (2009)From these papers, one can trigger a full snowball Earth with a sufficient reduction in atmospheric CO2.  A substantial reduction in water vapor (shown below, from Lacis et al (2010) as well as increase in the surface albedo are important feedbacks here, showing that removing the non-condensing greenhouse gases (mostly CO2) in the atmosphere can collapse nearly the entire terrestrial greenhouse effect.  What’s more, since the albedo increases substantially, the total greenhouse effect can be thought of as providing even more than 33 K of warming relative to Earth’s blackbody emission temperature. In the Lacis et al experiments, removing the CO2 from the atmosphere generates a cooling of around 30 C, an order of magnitude difference from Lindzen's answer.


Figure 1: Time evolution of global surface temperature, TOA net flux, column water vapor, planetary albedo, sea ice cover, and cloud cover, after zeroing out all of the noncondensing GHG’s.  From Lacis et al (2010)


Why might we care about such a hypothetical situation anyway? Aside from Lindzen, there are a number of interesting applications to low solar or low CO2 cases.  A concern with “large” climate changes (i.e., on the scale of snowball Earths or runaway greenhouses) is that there’s bifurcation (loosely, tipping points) in the system.  This is to say that one can conceivably draw down CO2 from the atmosphere and trigger a snowball, although it would take extremely high values of CO2 (much higher than the original amount) to get back out of this glaciated state.  In case skeptics bring it up, this is at least one way to have an ice-covered planet with very high CO2 levels.  Indeed, precisely how to escape a full-blown snowball is one of the grand unresolved questions in climate science.

Once you're out of a snowball however, you're left with a very hot climate until weathering can draw down CO2 to moderate values. Shown below (from Pierrehumbert et al., 2011, accepted) is a bifurcation sketch of the temperature as a function of the CO2 content in the atmosphere, with a lower solar insolation than today (specifically, Neoproterozoic insolation).  One can do a similar type of diagram against the incoming shortwave radiation, but in any case the presence of an albedo feedback makes multiple temperature solutions possible, even for the same incoming stellar radiation and greenhouse effect.  For example, if the Earth were magically ice-covered today, this would be a completely stable situation and there would be no tendency to escape that state unless the greenhouse effect was substantially enhanced or the sun got brighter.  This is a big problem in planetary habitability studies, especially if a planet succumbs to a snowball fate early in its history when the sun is faint. Once you begin to melt ice however, the temperature jumps rapidly to a very hot solution.

This is germane to a recent paper by Rosing et al (2010) which purported to show that the "faint sun" paradox can be resolved through a lower albedo rather than through a substantially enhanced greenhouse effect.  This paper is interesting, and an example of good scientific skepticism, in the sense that the authors are proposing a new idea for a subject still open for research.  The idea is problematic however, since even for Neoproterozoic insolation, you kick over into a snowball at about 3x present CO2, and the situation is even worse for early Earth insolation, which is some 20-25% lower than today.  There is no mechanism to adjust the albedo in such a way as to offset temperature changes, whereas the long-term silicate weathering thermostat acts as a negative feedback between CO2 concentations and temperature over geologic time.


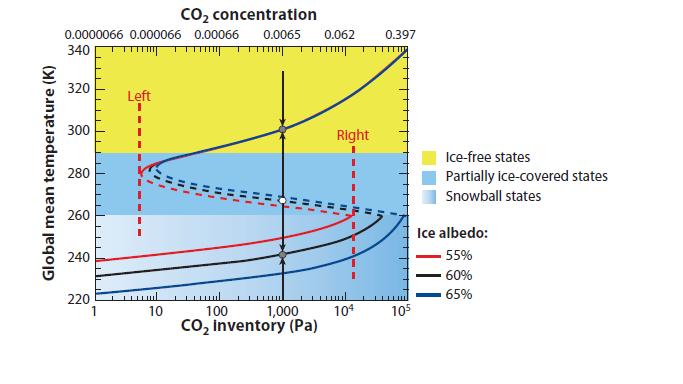
Figure 2: Bifurcation diagram for a zero-dimensional energy balance model. Calculations performed with L = 1,285Wm−2. For CO2 inventories up to approximately 1,000 Pa, the inventory can be converted to a mixing ratio in parts per million by volume (ppmv) by multiplying by 6.6. The CO2 concentrations on the upper horizontal axis are stated as fractions (e.g., 0.0065 corresponds to6,500 ppmv). The vertical dashed lines marked “Left” and “Right” indicate the left and right boundaries of the hysteresis loop for the case with ice albedo equal to 55%.  Adopted From Pierrehumbert et al., 2011, accepted


Lindzen has argued for a relatively insensitive climate system in the past, in which case it would be difficult  to explain the magnitude of large climate changes in the past, ranging from snowballs, the PETM, glacial-interglacial cycles, etc.  However, arguing that the climate would cool only be 2.5 degrees when you remove all the CO2 in the atmosphere is really just a made up number and ignored several articles on the subject that show otherwise.  Just the opposite, evidence shows that CO2 provides the building block for the terrestrial greenhouse effect, both because it absorbs strongly near the peak emission for Earth, and because it allows Earth to be warm enough to sustain a powerful water vapor greenhouse effect. 

0 0

Printable Version  |  Link to this page

Comments

1  2  3  Next

Comments 1 to 50 out of 102:

  1. I have already a problem with the first equation GHE = sigma( Ts^4 -Te^4). Because the average flux emitted by a surface with a temperature gradient is by no means the flux emitted by the same surface at the average temperature ( average of (T^4) is not (average of T) ^4).
    0 0
  2. Gilles, There is an upward surface LW of approximately ~390 W/m2, with the outward flux at the top of the atmosphere (TOA) about equal to the absorbed shortwave coming in, i.e. S(1-a)/4 (or ~240 W/m2). Therefore there is ~150 W/m2 of LW absorbed by the atmosphere, a number that goes to zero in the limit of no greenhouse effect and becomes large in very opaque atmospheres (Venus)
    0 0
  3. "... if the Earth were magically ice-covered today, this would be a completely stable situation and there would be no tendency to escape that state unless the greenhouse effect was substantially enhanced or the sun got brighter." By definition, it would be a desert planet, just as much of Antarctica is, by definition, a desert. Now add what I like to call the Best effect - after the Elizabethan scientist George Best who first published a description of it: insolation at tropical levels at the poles in their respective summers. Following tropical-level melting at the equator and North polar seas, warm water would put some minimal GHG into the atmosphere. Over a long enough time, the 'compound interest' of GHG - at first from the oceans, later from land - would lead to a planet with much less ice everywhere except Antarctica. George Best
    0 0
  4. logicman - I believe the increased albedo would lower retained energy enough to keep the Earth in a stable ice-covered state, although I haven't run the numbers - it might be worth looking at a simple climate model or two to see. That would hold until either Milankovitch effects or volcanic activity (unbalanced by weathering, as most available rocks would be covered) increased CO2 enough to lead to a feedback cycle that would take the would warm things up, releasing CO2 from the oceans. Still - this is a Gedankenexperiment thread. It's sufficient to show that if a variable is changed the current world would not have the same state as it does now.
    0 0
  5. Interesting post Chris. This graph is fascinating, if you raise CO2 in the partially ice covered state and follow the dashed lines a rising CO2 results in a global cooling which is none mechanistic. Therefore presuming a rising temperature with a rising CO2, could the increase go vertically so to speak? Could a rising temperature due to radiative forcing (like the changig alebdo effect)in the partially ice covered earth cause jumps in temperature? Can temerpatures of the top line be reached before the ice melts followed by the melt? Antarctica is going to take a long time to melt even if the world rose several degrees c. What does this sort of graph mean for climate sensitivity? Interesting graph, when is the Pierrehumbert et al., 2011, accepted paper being published?
    0 0
    Moderator Response: [mc] Use width=500 or smaller within img tags.
  6. Chris, I enjoyed the article, and hope it is to be the first of many on this site. Can you confirm that the sections of the bifurcation graph with dashed lines are transition states? That is, once the CO2 level reaches high enough a level to start melting ice in a snowball earth scenario, the temperature will continue warming until it reaches that of the equivalent for the equivalent CO2 level in the ice free state; and if CO2 levels drop below the minimum to maintain the upper solution, the earth would cool to a snowball state at the appropriate temperature for that CO2 level? Are they also unstable state? Ie, if the glaciation and CO2 levels where those at the white dot on the graph, could an equilibrium be maintained, or would it inevitably transition to one of the grey dots due to changes in albedo? Finally, I notice that in the non-snowball Earth case, at 666 ppm the model clearly indicates the Earth to be ice free. As the model was using less than current insolation, doesn't this mean the model is predicting an eventually ice free Earth for doubling of CO2 from current levels?
    0 0
  7. Ranyl, I think the dashed lines are not "real" states. What really happens, if if you're on one of the lower solid lines and you increase CO2 so much that you run out of solid line, then the temperature rapidly increases until you reach the upper solid line at the same CO2 level. If CO2 now drops (because all that melted ice has exposed rock that can weather) you slide down the upper solid line. If it drops enough, you "fall" from the upper solid line to the lower solid line (for the right ice albedo).
    0 0
  8. Chris Colose, I'd agree with you the Lindzen picked a number off the top of his head but the wider issue of CO2 as a GHG is not disputed by Lindzen (video 26-27mins).
    0 0
  9. Chris, I was hoping you could help with understand something. I've started to think that climate sensitivity (CS) is not a constant figure through the history of the earth. The impact of forcings in the form of feedbacks can be markedly different given the prevailling situation especially in the more extreme situations you describe in the final paragraph (snowballs, the PETM, glacial-interglacial cycles). For example the cryospheres in these periods will be very different with very different ice albedo feedback, another issue might be land cover and the biosphere, maybe you can think of more situations. I'm concerned that when scientist attempt to make CS estimates are they making estimates for the version of earth that was prevailing at the time and that this is different to the version we are living through now. Can you help with were I'm going right or wrong and describe how scientists deal with that problem (if it exists)?
    0 0
  10. HumanityRules #9 Good question. I often wondered if the persistent uncertainty range of CS, particularly the long tail at that longer geological study, could be due to such differences you mentioned.
    0 0
  11. Great article Chris, I quite enjoyed reading it. Regarding this bit: "This is a big problem in planetary habitability studies, especially if a planet succumbs to a snowball fate early in its history when the sun is faint. Once you begin to melt ice however, the temperature jumps rapidly to a very hot solution." Do these studies include the effects of asteroid impacts? As I understand it, the impact rate was substantially higher early in the Earth's history. Small impacts would result it localised heating, but larger ones can provide quite substantial 'kicks', both in terms of heating from the kinetic energy, and in terms of very rapid increases in CO2 levels. There's also the debris that would be spread globally, which would significantly affect albedo, and these combined effects could lead to substantial warming after the initial aerosol cooling subsided.
    0 0
  12. On the interpretation of the bifurcation graph, a thing to note is that for very low or very high CO2 levels, the equilibrium states correspond to snowball or ice-free states, respectively. In between however, there are three solutions (indicated by the circles on the diagram). The intermediate solution (white circle) is an unstable one which separates the attractor basin of the upper warm solution with the colder ice-covered solution. It is here that nudging the climate into a warmer or colder direction will make it head to that new state rather than tending to bounce back to where it was. For further clarification, I'm putting a supplementary hysteresis loop (also in the Pierrehumbert paper) below: Here's an example situation to help read this. Suppose we start off in the warm climate state on the upper branch labeled W1. Now suppose you gradually lower the CO2 a bit. In this case you will get just a bit colder, say evolving toward W2, or decreasing the CO2 a bit more, to W3. This is a steady cooling you expect from lowering CO2, but it isn't an irreversible jump, and if CO2 returns to initial conditions you can return back to W1. However, suppose we decrease CO2 a lot, such that we reach W4 along the upper branch. This is a rather unstable case (like a ball on the top of a sharply peaked hill just getting ready to be nudged), and further tendency to cool will cause an abrupt jump to the S1 state. Physically, this is where an ice line starts to advance and the albedo feedback becomes very powerful. Also note that the water vapor feedback becomes negligible once you get tropical temperatures near freezing. Now if you return CO2 levels back to W2 likes conditions, you don't actually get to the W2 temperature. Now, you only warm a tiny bit to S2. In other words, because of the ice-albedo effect, you have multiple temperature solutions for a fixed solar irradiance and CO2 levels, and what state you're in also depends on the history to get there. Just how "left" and "right" the boundaries are of the hysteresis loop in the diagram in my post is ultimately critical in understanding how to get in and out of the snowball state. The Pierrehumbert diagram doesn't come from a full-blown GCM, and uses some simple parametrization (for example, what threshold global temperature is appropriate for ice-free conditions? He uses 290 K, but that's an assumption too. Also, how "dirty" is the ice, etc) so I wouldn't try to look an individual numbers too close with a magnifying glass, the point is the concept.
    0 0
  13. Chris Colose - Thank you! This is an excellent and thought-provoking thread. As a further investigation into this, for all concerned - looking at the historic (ice core) temperature record, it appears that temperatures rise (in the Earth system) much faster than they fall. Is this due to differences between the sequestration rates and release rates (clathrates, vegetation rot, vs. weathering, ocean release/uptake) upon phase change initiation?
    0 0
  14. "I was hoping you could help with understand something. I've started to think that climate sensitivity (CS) is not a constant figure through the history of the earth." A good question and one I would like to know answer to as well. It certainly seems to me that a planet of mostly ice would have a much higher sensitivity than one that is warm and ice-free. (change in albedo feedback - and change in water vapour feedback). PETM features are difficult to explain with sensitivity of around 3 (Zeebe, Zachos and Dicken 2009) - either its higher then or atmosphere has more methane.
    0 0
  15. Bern, It's a good question. Impacts as well as internal heating source can certainly leave you very hot early in history, and in some cases can even push you over a threshold for the runaway greenhouse (tidal interaction with the Moon might have been a major heating source for Earth’s climate too in the first few millions of years). The bombardment period is relatively short though, and certainly the sun was a lot less luminous for a large deal of time when impacts were no longer critical. There's a lot to explore about this super-early stuff though in the context of habitability studies. The other thing is that not all stars evolve like our sun. M-type stars which constitute some 75% of all the stars out there are much more stable over geologic time (the lifetime on the main sequence for a star is inversely related to its mass, usually to a third or fourth power). M-stars are smaller and have a low effective temperature (only a few thousand degrees, in contrast to our own sun which is 6,000 K when it becomes optically thin enough for photons to escape) and so potential habitable planets need to be a lot closer to M-types. But with weak (and stable) luminosity, getting them out of a snowball state once they're in can be very tough. The volcanic outgassing of CO2 that helped Earth recover from snowballs in the past might be less meaningful, since a lot of these planets are so close to the sun that they are tide-locked (always having the same face to the sun) or at least close to it, so on the cold night side CO2 could condense out of the atmosphere faster than it is replenished by outgassing.
    0 0
  16. Really good article and discussion. It is a shame that someone did not answer Lindzens "guess" with some facts. Now the republicans and deniers go away thinking that CO2 is no big deal up or down.
    0 0
  17. Well done Chris, you have got Lindzen there. That is just one of several misleading and/or false statements he made that day.
    0 0
  18. HumanityRules, I largely agree with you, but non-linearity in sensitivity is rather small over the ranges of climate of interest to us right now (e.g. http://www.nonlin-processes-geophys.net/18/125/2011/npg-18-125-2011.pdf ). Certainly you don't want to compare snowball Earths to say, the PETM directly, but I haven't seen anything suggesting it's a big deal for evaluating modern global warming. The effect isn't absolutely zero. Colman and McAvaney (2009) did this type of experiment from 1/16th to 32x modern CO2 and found a weaker sensitivity in the warm climate than in the cold cases, but it's not a large effect over a few degrees about the modern climate, so you don't really lose much by using the past as a guide to the future. The albedo feedback does get weaker in the warm simulations, but the water vapor grows in strength in warmer climates as well. The Colman and McAvaney paper have the lapse rate feedback increasing in strength too, essentially offsetting the water vapor feedback over most of the range (So the WV+LR feedback is positive the whole time, but not acceleratingly so), but I'm pretty skeptical of that. Eventually the water vapor feedback makes the sensitivity much higher, eventually getting you to a point where a runaway greenhouse is possible if your solar insolation is high enough. There's some other papers on this (e.g., Crucifix 2006, looking at the LGM vs. present) but the non-linearity is pretty small.
    0 0
  19. In the Lacis et al (2010) paper "Atmospheric CO2: Principal Control Knob Governing Earth’s Temperature" it is shown (figure 1 in this post) that cloud cover remains roughly the same while the Earth cools (it even grows a bit at first before stabilizing at a constant value). How could this be possible, while the water vapor content of the atmosphere drops by 90%? Since clouds are formed by condensed water vapor, should not cloud cover decrease proportionally to the moisture decrease in the air, because there is less water vapor to make clouds? This is a very important point, because if the cloud cover drops while the sea ice cover grow, it is not clear if the total albedo of the planet would grow (due to more ice) or drop (due to less clouds). A cloud-induced drop in albedo would be a negative feedback that may prevent the Earth into entering a snowball state, if it is strong enough to compensate the loss of the greenhouse effect.
    0 0
  20. Peru, Keep in mind that clouds make up an extremely small amount of water in the actual atmosphere. From Trenberth and Smith (2005), there's generally about 250 times more water vapor (in mass per unit area) than liquid or ice in the air. I don't know how realistic the cloud feedbacks are in the Lacis paper (that would be a good question to ask the people in the study), but there's a lot of wiggle room to change the water vapor without changing clouds much. It's not the total water in the atmosphere that matters, but how you reach saturation, and lowering the temperature makes condensation easier. As for the albedo effect, the reason clouds are such a problem in the modern atmosphere is because they have two big terms (a longwave and a shortwave term) and constraining climate sensitivity amounts to figuring out the the very small difference between the two competing effects. In the snowball case though, the albedo effect of clouds isn't very important over bright surfaces, so they have an unambiguous warming effect on the snowball climate (as noted in Pierrehumbert 2002, as well as the coming review article). So your argument wouldn't really hold in this case.
    0 0
  21. From Peru @19, clouds form when water vapour condense from the atmosphere as the surrounding gas cools. With a drier atmosphere, you will also get a greater change in temperature with altitude, and hence a greater relative rate of condensation. So there is at least one solid reason to think cloud cover will not just track water vapour levels unambiguously.
    0 0
  22. I disagree with the aspects of trying to include feebacks to determine the answer to what would the temperature be if the Earth was the same and stable EXCEPT for CO2. Same insolation, same cloud, albedo, the works. What would the greenhouse effect be in that situation? A net energy transfer to the atmosphere is one method that could be used. If one analyzes total energy transfers to the atmosphere by the different components the following table is arrived at: Latent Heat: 80 W/m2 LW Absorption: 23 W/m2 Convection: 17 W/m2 If I use Gavin's paper and the CO2 contribution of 20% to the LW absorption which contributes to 19% of the total energy transfer to the atmosphere from the surface, then CO2 contributes 1.3C of the total GHE. Total energy transfer causes the total GHE. Trying to assume that only the energy transferred by LW absorption causes the GHE is a poor simplification. One could also consider the SW absorption to the total, but much of that takes place in the ozone layer which is independent of the troposphere. So I leave that out of this comment, but I have more here.
    0 0
  23. What is the radiative budget, both shortwave(cooling) and longwave(warming) for clouds, measured in W/m^2 ? In particular for: -Low altitude clouds -High altitude clouds -Total cloud cover Does anyone has the data?
    0 0
  24. CO2 emits IR as much as it absorbs it. (If this were not the case, CO2 molecules would be trapping energy indefinitely.) So in having more CO2 in the atmosphere, while more IR is absorbed, you also have a greater channel for outward cooling. This tendency balances itself out for any latitude throughout the year, but what of the polar regions where the sun doesnt shine for over three months of the year? With more CO2, shouldnt these regions now be cooler in the winter? Yet if polar winter temperatures are observed to be generally warmer now, it could only be due to other sources of latent heat,... which of course, could not be from extra mid-latitude warming, since this would cause cooling in these areas, and they are supposedly warmer now.
    0 0
  25. Lindzen, once again draws attention mainly to the complex issue of feedback, knowledge of which (even the major) is still small (especially negative). Very interesting - the easy way (understandable for all of them) - it is a "phenomenon" described here: Temperature and CO2 feedback 'weaker than thought', BBC 2010 It is noteworthy example of this great area of uncertainty: Effect of soil moisture and CO2 feedbacks on terrestrial NPP estimates, shows that both reduce to zero (CO2-free) - and the doubling of our CO2 emissions - can be far less important - than previously thought (though I must admit that, and fourth IPCC report gives a very wide limits for response to a doubling of CO2). “Often, despite dramatic leaf level impacts due to climate changes, the natural ecosystem tends to buffer and does not show a dramatic response. Our analysis suggests that the interactions between the biotic and abiotic changes tend to have a compensatory /antagonistic response. This reduces the effect of the variable change on the overall system response. Our results indicate that the effect of soil moisture availability (and drought) is an important modulator of the terrestrial carbon cycle, and its impact for both present day as well as climatological feedback (under doubling of CO2 or ENSO like events) needs to be investigated.” And climate change has never simply failed to associate with the Sun. Climate change and solar variability: What's new under the sun?, Bard and Frank, 2006.: “Overall, the role of solar activity in climate changes — such as the Quaternary glaciations or the present global warming — remains unproven and most probably represents a second-order effect.
    0 0
  26. RSVP, It has been explained to you many times that CO2 can lose energy in many ways besides emitting it as IR. Molecular collisions rapidly exchange energy in the atmosphere. The CO2 does not carry its energy around forever. I teach this to my High School students, it is basic science. Since you do not understand the basic science you should not make statements like "shouldnt these regions now be cooler in the winter". As you have been told numerous times, AGW predicts that winters will warm more than summers and nights will warm more than days. We all see your suggestion that your "waste heat" explaination needs to be considered again. Give it up. Hundreds of posts have tried to explain the basics to you, read what they say.
    0 0
  27. I'm surprised that no-one has mentioned our sister planetoid: the Moon. The simple fact is that the Moon has no CO2 - and as a consequence, has an average surface temperature about 33° C lower than the Earth, despite having exactly the same insolation. Even a congressman could understand that argument.
    0 0
  28. “Overall, the role of solar activity in climate changes — such as the Quaternary glaciations or the present global warming — remains unproven and most probably represents a second-order effect.” If that were true, then how does one explain the image here: http://en.wikipedia.org/wiki/File:Vostok_420ky_4curves_insolation.jpg I could be mistaken, but this image seems to suggest that changes in insolation-as caused by Milankovitch Cycles-precede the large-scale changes in temperature.
    0 0
  29. More and more, moreover, the work - paper (not just Lindzen) draws attention to the possible advantages of negative feedback - over positive (a doubling of CO2). 'Greener' Climate Prediction Shows Plants Slow Warming, Lynch - NASA, 2010.: “A new NASA computer modeling effort has found that additional growth of plants and trees in a world with doubled atmospheric carbon dioxide levels would create a new negative feedback – a cooling effect – in the Earth's climate system that could work to reduce future global warming. The cooling effect would be -0.3 degrees Celsius (C) (-0.5 Fahrenheit (F)) globally and -0.6 degrees C (-1.1 F) over land, compared to simulations where the feedback was not included, said Lahouari Bounoua, of Goddard Space Flight Center, Greenbelt, Md. Bounoua is lead author on a paper detailing the results that will be published Dec. 7 in the journal Geophysical Research Letters . Without the negative feedback included, the model found a warming of 1.94 degrees C globally when carbon dioxide was doubled. “ 1.34 degrees C over the land ... instead of 3-4.5 degrees C ... Effects of Rapid Global Warming at the Paleocene-Eocene Boundary on Neotropical Vegetation, Jaramillo et al. (28 coauthors !), 2010.: “We observed a rapid and distinct increase in plant diversity and origination rates, with a set of new taxa, mostly angiosperms, added to the existing stock of low-diversity Paleocene flora.“ “The tropical rainforest was able to persist under elevated temperatures and high levels of atmospheric carbon dioxide, in contrast to speculations that tropical ecosystems were severely compromised by heat stress.” If someone wants invoke on the paper: Fossil soils constrain ancient climate sensitivity, Royer, 2010., and Atmospheric CO2 concentrations during ancient greenhouse climates were similar to those predicted for A.D. 2100, Breecker, Sharp & Mc Fadden 2010., the paper suggesting that the data from the Phanerozoic prove a significant advantage of positive feedback - over negative (up to 6 degrees C in response to a doubling of CO2 in the atmosphere), I noted here that the former terrestrial plants was significantly different than now ..., and propose to work: Does burial diagenesis reset pristine isotopic compositions in paleosol carbonates? Bera et al., 2010.: “... it is inappropriate, as proposed recently, to reject the paleoclimatic potential of all paleosol carbonates affected by burial diagenesis. Based on pristine δ13C value of − 8.8 ± 0.2‰ in soil carbonates an atmospheric CO2 concentration between ~ 764 and ~ 306 ppmv is estimated for the early Oligocene (~ 31 Ma) Dagshai time. These data show excellent agreement between two independent proxy records (viz. soil carbonate and marine alkenone) and support early Oligocene survival of the Antarctic ice sheet.” Paleosol carbonates, however, probably tell us more (and more precisely) about the old CO2 - than even the stomata - their density on a leaf, or their size (moss).
    0 0
  30. @Marcus I recommend Wikipedia especially this subparagraph: Theory incomplete “The Milankovitch theory of climate change is not perfectly worked out; in particular, the greatest observed response is at the 100,000-year timescale, but the forcing is apparently small at this scale, in regard to the ice ages ... “
    0 0
  31. #27 Chem, That has been discussed here and here. #29 Ark, One frustrating aspect of the debate to me is that I would prefer that CO2 cause warming because the alternative is cooling. Despite arguments that the Holocene is comparable to the Hoxnian Interglacial, the insolation curves are very different. I am not convinced (no need to link to the papers, I have read them) that CO2 will cause warming, but I am convinced that the orbital cycle will cause cooling. So preparing for warming when cooling is more probable is a very bad response.
    0 0
  32. TIS @ 31... But you can quite easily look at the radiative forcing associated with insolation and see how that relates to the radiative forcing of GHG's. If you compare those figures I believe you're going to see that an enhanced greenhouse effect is going to overwhelm any orbitally forced cooling.
    0 0
  33. michael sweet 26 The job of a teacher is to teach people how to think, not "having things explained".
    0 0
    Moderator Response: [DB] There are those that regrettably force us to do the latter because they refuse to do the former.
  34. RSVP: The job of a teacher is to teach people how to think, not "having things explained". No, it involves both.
    0 0
  35. During the exit from a snowball event, one essentially goes from a completelely ice covered planet to an iceless planet as the CO2 content of the atmosphere reach 10%. The temperature in the snowball aftermath reaches between 40ºC and 50ºC. Oxygen isotopes of cherts 3.5–3.2 Gyr (Archean Eon) indicate temperatures of 70 +/- 15 ºC, indicating that temperatures then may have been even higher in earlier times. My question is: in the Ancient Earth, during periods when temperatures where between 40ºC and 70ºC, what would the atmosphere be like? In particular, given the enormous atmospheric water vapor content due to the high temperature, would the planet be completely covered by clouds, like today is the planet Venus? (I mean clouds made of water droplets of course, unlike the Venusian clouds that are made of H2SO4 droplets) And what net radiative effect can have a 100% cloud cover, that is, what dominates, the reflection of shortwave radiation (the cooling effect of clouds) or the cloud greenhouse effect on longwave radiation (the warming effect of clouds)?
    0 0
  36. " If you compare those figures I believe you're going to see that an enhanced greenhouse effect is going to overwhelm any orbitally forced cooling." This has been pointed out to TIS before but so far as I can see he doesnt believe arithmetic.
    0 0
  37. To those that continue to argue solar forcing.... Between January and July of each year the average temperature of the Earth increases ~4C. Between July and January the average temperature of the Earth drops ~4C. The maximum energy from the sun is opposite of that cycle. The Earth receives maximum energy in January and minimum in July. The factor that causes that behavior is the differing geography of the two hemispheres. If they had equal geography then Jan-Feb would be warmest and Jul-Aug the coolest. The geography of the Earth causes more of a temperature change each year than even the IPCC's most dire predictions. Where the energy of the sun strikes causes more "feedback" than any of the GHG's. The location of the long term insolation changes matter most, not the magnitude. That is why the "arithmetic" is not believed. It does not explain the annual temperature cycle.
    0 0
  38. TIS... What you seem to be missing is this is not about absolute temperatures. In a given day the temperature rises and falls vastly more than the most dire global warming predictions. This issue is that we are nudging the distribution curve out one direction producing warmer average temperatures and greater extremes.
    0 0
  39. The second graf in the article and the one posted by Mr. Colose remind me of the PV curves with the van der Waals correction and the Maxwell construction.
    0 0
  40. TIS... I have to say, I'm having a hard time finding this signal of 4C global average temperature swings in the data.
    0 0
  41. # 37 ICS, Could you please post a source for that 4C range? I would like to see the arithmetic.
    0 0
  42. I actually found the data TIS is referring to here at NOAA. But TIS is still missing the very basic point of what global warming actually is.
    0 0
  43. Rob @40, He is probably referring to the range in mean global UAH lower tropospheric temperature as shown on Christy's site, which by my reckoning has an amplitude of 3 K, not 4 K. I would like to see what RSS shows though. BUT, again, given the attempts of TIS to obfuscate, I can only conclude that he agrees with Lindzen's erroneous number, because he certainly has not said nothing to have us believe otherwise-- in fact he seems to suggest a lower number (unless lindzen was referring to Fahrenheit and not Kelvin). So instead, he ties to detract from Lindzen being out by an order of magnitude. The physics and science simply do not support Lindzen's number. Anyone, who argues differently must be arguing from a belief system or ideology, and not science, or worse yet, distorting/mangling the science the fit their belief system. And I look forward to TIS submitting a paper to science to refute Lacis et al......... These are desperate days for "skeptics" and contrarians and is showing in the quality of their posts, and their desperate attempts to detract from the failings of their "heros". In recent months Lindzen, Spencer, Michaels, Carter and Christy have been (for the umpteenth time) exposed for what they are-- disinformers and obfuscators intent on confusing the public, who are seemingly driven by ideology and not science. The really scary thing is that, given their training, they must know better-- it is hard to believe that they are innumerate (to borrow a term used by Gareth Renowden in a similar situation) given their training. As you can tell my patience with these disingenuous abusers of science and people who talk though their hats has long run out. I hope readers following SkepticalScience not the vacuity of physics and science in arguments used by "skeptics". I suggest TIS submits a paper to science trying to refute Lacis et al. (2010).
    0 0
  44. "Where the energy of the sun strikes causes more "feedback" than any of the GHG's. The location of the long term insolation changes matter most, not the magnitude." I find this mystifying. The comment starts with seasonal variation, then morphs to 'long term insolation change.' This is not the first time a 'skeptic' has attempted to interpret seasonal temperature change as an argument against AGW. But it makes no sense: All of that system has been in place for a long, long time. Pardon me for asking, how does that have anything to do with recent warming - or anything else in recent history other than the seasons themselves?
    0 0
  45. Rob and Alb and Muon, I do understand what global warming is about..... Really. Thanks for linking the NOAA site. I hope people will accept that as not made up. I believe that Jones himself did the study that provided the NOAA the data. Also, the average temperature of the Earth does not change during the day. Half is cooling, half is warming. It stays constant over the course of a day. It does change over the course of the year, by 4C. Here is my question. A serious and legitimate question. Define a forcing mechanism that causes July (lowest solar forcing) to be warmer than January (maximum solar forcing). Forcing doesn't fit. Describe to me a mechanism that causes the minimum energy point to be the warmest time of the year. By CO2 models January should be warmer than July. Please check. In January the Earth gets ~7% more energy than it does in July, but July is also ~4C warmer. Explain the warmer July to me without using geography. It cannot be done, not matter how hard you try. If you don't think that matters, that is fine. But if accurate, it does prove that geography plays a very strong role in global temperature. Convince yourselves that I am either right or wrong on that point. Then we can talk more.
    0 0
  46. Inconvenient Sceptic @22, 37, and 45: First, you plainly do not understand how the greenhouse effect works, as is shown by your comment @22. The GHE is a consequence of the difference between the energy of the IR radiation to space from gases in the atmosphere, and the energy that would have radiated to space from the surface at those same frequencies has those gases not been present. Because it is the energy balance between radiation to space and radiation from the sun, the energy balance for energy transfers between atmosphere and surface is of only minor interest. Certainly increasing those transfers will not increase the greenhouse effect by itself, and nor will changing the form of the energy transfer. The simple fact that should convince you of your error is the fact that energy radiation from a gas is a function of the gases temperature. Therefore, cooling the atmosphere will reduce the energy radiated by green house gases in the atmosphere, and hence increase the difference between that radiation and that from the surface in the same frequencies. In other words, simply warming the atmosphere weakens the greenhouse effect, not increases it as claimed by you at your blog. Finally, the difference between July and January global temperatures is due to the high proportion of land in the NH, whose low heat capacity results in much faster temperature rises for a given forcing, and much faster falls if that forcing is removed. So much is obvious. What is also obvious is that this is irrelevant to your original and false claims.
    0 0
  47. Thanks for that Tom. I cannot see how geography is of any interest in climate calculation length periods. It doesn't change - or at least until Australia's 5cm a year northward movement gets us nearer the equator it won't. One degree of latitude is over 100 kilometres. At 200 years per metre, 200,000 years per kilometre, this is not of any relevance, let alone interest, except to seismologists and a very small subset of geologists. And I really cannot understand how seasonal temperature effects are of any more concern than tidal or diurnal effects. They're all just cycles. Climate is about whether future cycles will be the same, temporarily different (ENSO for example) or permanently different as in ice ages or warming. Permanent is a human generations word here not a geological period word.
    0 0
    Moderator Response: [muoncounter] TIS has veered off-topic. This is a thread about a CO2-free atmosphere. Discussion of seasonal solar radiation belongs on It's the sun. Comments there can link back here by including an HREF="" with the URL of the originating comment between quotes.
  48. TIS... I'm posting a response to #45 on the proper thread per the moderator response above.
    0 0
  49. In my prevoius comments I wanted to talk about the opposite of a CO2-free Earth: a Super Greenhouse Earth, i.e. with CO2 concentrations similar to the concentration of O2(oxygen) in the present day atmosphere, (that is, CO2 over 10%). This happened in the snowball events aftermath and possibly before 3000 million years ago (O2 isotopes suggest a temperature of about 70ºC then). The huge warming (earth temperatures would be above 40ºC) will cause a huge evaporation leading to an extremely high water vapor content in the atmosphere. What the cloud cover would be like in that world? Could the Earth have been 100% cloud covered like today is the planet Venus? And what kind of clouds will be the more common, high altitude cirrus clouds(with a net warming effect), low altitude stratocumulus clouds (with a net cooling effect) or huge troposphere-wide cumulonimbus clouds (with nearly neutral temperature effect)?
    0 0
  50. From Peru I thought some stuff from Joel Norris was quite interesting on the subject. The first presentation on this list I thought was easy to follow as a layman. It makes the point that clouds are a dynamic rather than thermodynamic problem although I'm not too clear on what that means :)
    0 0

1  2  3  Next

You need to be logged in to post a comment. Login via the left margin or if you're new, register here.


The Consensus Project Website

THE ESCALATOR

(free to republish)


© Copyright 2024 John Cook
Home | Translations | About Us | Privacy | Contact Us