


 Arguments


Recent Comments
Prev 1841 1842 1843 1844 1845 1846 1847 1848 1849 1850 1851 1852 1853 1854 1855 1856 Next
Comments 92401 to 92450:
-
Daniel Bailey at 23:53 PM on 24 March 2011Teaching Climate Science
@ rhjames (19) "Can anyone show me a model that predicts the lack of warming over the past 10 years or so? I know that people want to say it's a short term blip - we need to be talking 30 years minimum." When one filters out the cyclical noise and the effects of volcanoes on the system, it is possible to see a significant temperature vector in the data in temperature datasets, even in periods shorter than 30 years: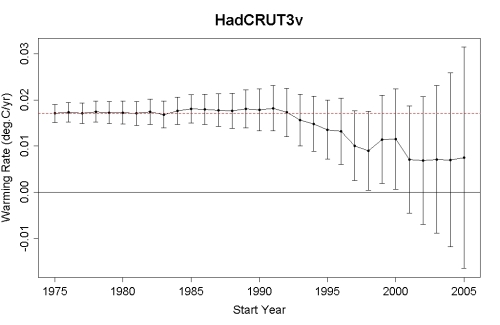 But it takes someone skilled in time series analysis to do the job right when dealing with extremely short time series, such as the significant warming of the globe since 2000, as shown above.
That's why most climatologists, being very conservative with what they say, prefer to use as much data as they can get (generally 30 years or more) to make their evaluations.
Otherwise what you're asking is impossible: to prove or disprove the non-existence of something.
Hope this helps,
The Yooper
But it takes someone skilled in time series analysis to do the job right when dealing with extremely short time series, such as the significant warming of the globe since 2000, as shown above.
That's why most climatologists, being very conservative with what they say, prefer to use as much data as they can get (generally 30 years or more) to make their evaluations.
Otherwise what you're asking is impossible: to prove or disprove the non-existence of something.
Hope this helps,
The Yooper
-
Arkadiusz Semczyszak at 23:52 PM on 24 March 2011Why we have a scientific consensus on climate change
“Black Death, & that it peaked *before* the start of the Little Ice Age (14th century vs the 16th century).” There is some truth. There was exactly in 1347 - along with the beginning of the LIA. Ended (as a pandemic) in the years 1660-1670 - the beginning of the LIA maximum cold finished "life of "black death. This is another - excellent - example the lack of linearity in a world of natural phenomena ... Warming or cooling - both of which can be both the cause of the disaster and development. -
Gilles at 23:52 PM on 24 March 2011Why we have a scientific consensus on climate change
"The purpose of SkS is to provide a forum for discussion of climate science relating to global warming. If it is not your goal to discuss climate science, perhaps you should find another forum more suited to your goals" Again, I don't think that scientific issues can be settled by discussions on a web forum. i'm here just as a citizen who, because of his scientific formation (actually profession), can understand scientific arguments, but I wouldn't try to give definite answers. I understood that this forum was devoted to a presentation of scientific facts towards a large audience - for me it's enough to see the "best arguments" as selected by the most convinced people to see how they sound. And if these "best arguments" don't sound terribly convincing, I'm afraid the others will be still more uncertain. So when I see things like statistics on models, or intuitive fudge factors, or simplistic logics obviously overlooking complex realities, well, that's enough for me to doubt. I have a question, by curiosity, concerning the position you believe I'm holding : is there any precise statement, that you think I would support, and that would be obviously wrong for you ? (such as "the world was created 5000 years ago", or " planets do influence the psychology of individuals") ? a good criterion to quantify the "obviously wrong" would be, as I said, that you would accept any bet even at very unfavorable odds for you. Is there such statement, in your opinion ?Moderator Response: [Dikran Marsupial] Now you are just being silly - of course the scientific issues are not settled in discussions on a web forum and nobody has suggested they are. They are settled (as much as any science is every settled) in the peer reviewed litterature. The purpose of SkS is discussion of that science, and if you are not interested in that discussion, then please go elsewhere where the things you want to discuss are on-topic, rather than disrupt the discussion of the science here. I have not implied that you hold any position, I am not interested in guessing your position on the science [if you had a substantive point you would just make it rather than play guessing games] and have no desire to indulge your trolling any further. -
Arkadiusz Semczyszak at 23:32 PM on 24 March 2011Why we have a scientific consensus on climate change
of course: You quote my work - paper, that further warming of 1.34 degree C (land) will have a global catastrophe ... -
Arkadiusz Semczyszak at 23:29 PM on 24 March 2011Why we have a scientific consensus on climate change
I. “Y. pestis was the cause of the Black Death” - sorry is “of topic”, but it shows the way thinking about the consensus. Nobody - including Scott and Duncan - do not claim that there was Y. pestis in the LIA - as the cause of death - even strong but rare epidemic (in relation to the virus). Skeletons found in Y. pestis DNA (usually port cities ONLY !) confirms this - but just that. Work cited by ScienceDaily is a little like the views of creationists ... There is one small piece of truth. Shows how big is the resistance to new scientific research. Scott Duncan and prove that it - in great part Europe - was not species of rats - especially in the UK or Iceland - it could not be there so the plague ... II. I quote my work - paper, that further warming of 1.34 degree C (land) will have a global catastrophe ... -
grypo at 23:28 PM on 24 March 2011The Libertarian Climate Conundrum
Thanks for dropping by TTom. I'm just going to post you main thoughts here because there is no link there to get back to your comment. From here: "my chief comment would be that you and the 'libertarians' you discuss have all missed that the status quo favors massive corporations whose very status is suspect from a libertarian standpoint: they are creatures of government that could not exist without govt in their present form, and that embody moral hazard via the govt grant of limited liability to shareholders. Cato and other vocal 'libertarian' organizations are in fact corporate fronts and won't bite the hand that feeds them, and thus avoid delving too deeply when they defend a 'free market' that is predominated by organizations that are not controlled by shareholders or communities and that are dedicated to extracting gains irregardless of costs that others may be forced to bear." You explained that bit much better than I. -
Harry Seaward at 23:06 PM on 24 March 2011Why we have a scientific consensus on climate change
My post @ 51 should have referenced Lawrence Solomon, Financial Post, Jan 3, 2011. My apologies. -
CBDunkerson at 22:53 PM on 24 March 2011Arctic sea ice has recovered
Philippe #24: Interesting point on the global area. Looking at the graph it seems like since 2005 the annual minimum area (blue line) has repeatedly been significantly below the long term average (grey line). There have also been several sharp dips in the growth cycle (about 6 months after the minimums) not often seen in previous years. Obviously, most of this is being driven by the collapse in the Arctic and it is too short a period to confirm that a new trend (steeper than the long term decline) has begun. That said, the latest PIOMAS update (included in the article above) shows basically no recovery of ice volume anomaly over the Winter. Not a good sign. -
les at 22:52 PM on 24 March 20112nd law of thermodynamics contradicts greenhouse theory
damorbel #821: "The Sun is at about 5780K ... The Sun occupies only a small part of the sky so we do not get a the full 5780K here, only 279K." someone; mods, NATO, the UN ... anyone please make it stop! The abuse of physics here is right up there with any human rights violations! (just so as this isn't pure rant: you do see the full temperature give or take attenuation - just not integrated over the whole of our 'aperture' (the sky), nor do we see it's full irradiance; but that does not affect the light spectrum and, therefor the temperature we see, as such)Moderator Response:[DB] You have my sympathies, FWIW. I would reiterate an earlier suggestion I made: DNFTT. And we all know by now the players in this drama. If you see recycling of earlier arguments, please point them out for deletion and possible stronger action. Thanks!
-
Marcus at 22:34 PM on 24 March 2011Why we have a scientific consensus on climate change
"First: 2 + 0.6 it still is far from up to 3 degrees C ..." What the....? I was saying that roughly 2 degrees, *plus* the 0.6 we've already had, would constitute a catastrophe. When are you going to start talking sense? "... when we consider "negative feedback": “The cooling effect would be -0.3 degrees Celsius (C) (-0.5 Fahrenheit (F)) globally and -0.6 degrees C (-1.1 F) over land, compared to simulations where the feedback was not included, said Lahouari Bounoua ...”" and what negative feed-backs are these? To date I've yet to see too much evidence that we can count on that level of negative feedbacks-if any at all. What about all the possible positive feedbacks that probably have yet to be considered? As to your third point, it reads like unintelligible nonsense. The consensus remains that Y. pestis was the cause of the Black Death, & that it peaked *before* the start of the Little Ice Age (14th century vs the 16th century). Scott and Duncan are, from what I can see, the Lindzen, Spencer & Choi of Climate Science-claiming the consensus is *wrong* without feeling the need to provide solid evidence. -
damorbel at 22:32 PM on 24 March 20112nd law of thermodynamics contradicts greenhouse theory
Re #824 "damorbel #820: You attribute a quotation from message #804 to me. It was actually written by KR." Very sorry! -
muoncounter at 22:26 PM on 24 March 2011Why we have a scientific consensus on climate change
#70: "I'm not here for that ... if you don't convince me, I loose nothing" Thanks for telling us, at long last, that you are not here to discuss factual matters of science. That is exactly what this discussion does not need. How can you be convinced of anything when you equate scientific study to theology? Not that the question is relevant here, but how do you personally claim to 'know' anything? Are you really the long-lost scion of Rene Descartes? What you have lost is any and all credibility in this audience. By denying the value of a fact-based discussion, you give yourself the status of talking hand-puppet; your comments are now little more than spam. -
cloa513 at 22:18 PM on 24 March 2011Wrong Answers dot com
By the way if Skeptical Science said instead of Gobal Mean Temperature. Mean (nonscientific) of measuring points (MMP) then that would be OK- but that would only be aneodotal value nothing to compare to other MMPs such NASA and GIST and certainly you can't do real analysis on it and at most you can say its seems to be increasing. Search for Does a Global Temperature Exist? Chistopher Essex. The theoretical failings of this approach go back the 1970s but are valid as they are now. Skeptic Science provides no response.Moderator Response: For a brief explanation of what's wrong with the Essex claims, see the RealClimate post "Does a Global Temperature Exist?" For more detail see the series of seven posts at Rabbett Run; go to the seventh post and click on the series of links in parentheses at the end of the title. -
CBDunkerson at 22:18 PM on 24 March 20112nd law of thermodynamics contradicts greenhouse theory
damorbel #821: "Remote controls emit high brightness narrow band IR that is focussed; the detector at the receiver can distinguish the RC bright spot against yhe background radiation coming fron your cup of tea and othe objects near you." The question isn't how the receiver distinguishes the signal from the remote from ambient energy (which you get completely wrong BTW). It is how it receives the signal at all if, as you claim, energy cannot flow from the cold remote to the warmer receiver. "The microwave energy is repeatedly reflected by the walls until, sooner or later, it encounters the food to be cooked, where it is (mostly) absorbed." But how? Are you amending the 2nd law of thermo-ridiculousness to; Energy cannot flow from cold to hot unless it is repeatedly reflected first? Still doesn't explain the remote control. "Same as 1/, except the transmitter is not focussed (much)." The IR remote isn't focused much either... which is why you can bounce the signal off a wall behind you and still have it work on the television (or whatever) in front of you. However, that still doesn't explain how either travels from cold to hot. "But sunlight still behaves with some of the properties of a 5780K source, it ionises O2 in the stratosphere to make ozone and it tans your skin, burning it if you are not careful." So now you are claiming that only the temperature of the 'origin point' of the EMR matters... it can go through cooler and warmer areas so long as none is warmer than the origin point. Yet the remote, microwave, and radio examples all show EMR traveling to areas warmer than their origin points. -
rhjames at 22:18 PM on 24 March 2011Teaching Climate Science
One basic way to test a model is to take the first half of the data (over time) to generate the model, then see if it predicts the second half of the data. Can anyone show me a model that predicts the lack of warming over the past 10 years or so? I know that people want to say it's a short term blip - we need to be talking 30 years minimum. What about a model that would have predicted the steady temperature 1940 - 1980, or the increase from 1910 - 1940. I also know about the theories of volcanoes etc to explain these, but there's too much "the model would have worked except for....." I find the speculation that we're coming into a cooling period just as convincing. I know this is getting off the track for this thread, and I apologise.Moderator Response: [Dikran Marsupial] The "lack of warming" over the last ten years is likely to be due to internal variability - it isn't climate. The models do predict that there will be occasional periods of apparent cooling even during long term warming trend, but the can't predict when they will happen as they are chaotic. See the excellent paper by Easterling and Wehner. It is unreasonable to complain that the models are not able to predict something the modellers would not claim they could model. As for the 1940-1980 levelling and the 1910-1940 warming, the models actually do predict them - see the IPCC reports. If you want to discuss this further, please do so on a more appropriate thread. -
CBDunkerson at 21:59 PM on 24 March 20112nd law of thermodynamics contradicts greenhouse theory
damorbel #819: We already covered this nonsense... you claim EM radiation behaves differently when reflected than it does when absorbed and re-emitted. Again, irrelevant even if it weren't completely false. Real world examples of each; Photographer taking a picture of a 'penguins on ice' exhibit in a zoo. The ice is colder than the mirror in the camera and the film yet the image is carried by the EM radiation from cold to hot. The ice does not 'disappear' from the picture. EMR flowing from a cooler object to a warmer one while being reflected along the way. Two identical pots of water on an electric stove. Heat them both to the maximum temperature of the stove for an extended period and then turn one off while putting the other at half heat. If energy were unable to travel from cold to hot then the pot which was warmed up to the maximum heat could not absorb and re-emit heat from the now half as hot burner and would therefor cool down at exactly the same rate as the pot whose burner was turned off (until it reached half heat and stopped cooling). Yet this does not happen. The pot with half heat cools down slower / remains boiling much longer than the pot with no heat... because even though it is (initially) hotter than the burner it is still receiving additional heat... heat flowing from a cooler object to a warmer one by absorption and re-emission. One example involves reflection, the other absorption and re-emission. Yet both show energy flowing to a cooler area from a warmer one. Ergo, the reflection vs absorption and re-emission distinction you keep making is meaningless. It is observed reality that energy can and does flow from cold to hot in either case. Your arguments continue to be complete nonsense... and you continue to avoid any attempt to address the countless real world examples proving that. damorbel #820: You attribute a quotation from message #804 to me. It was actually written by KR. -
Philippe Chantreau at 21:59 PM on 24 March 20112nd law of thermodynamics contradicts greenhouse theory
LJR, by definition, if the ability to radiate is decreased, the emissivity does change and the blackbody becomes grey. How else can it possibly manifest? It has been pointed to you earlier that this is exactly what the atmosphere does. And what was this thing again with the cooker cooler below ambient but in fact staying at the same temperature as the air? This is a waste of time. -
damorbel at 21:49 PM on 24 March 20112nd law of thermodynamics contradicts greenhouse theory
Re #818 Tom Curtis you wrote:- "Following damorbel's logic @815" - no comment. -
damorbel at 21:46 PM on 24 March 20112nd law of thermodynamics contradicts greenhouse theory
Re #816 CBDunkerson you wrote:- 1/"How does the EMR emitted by a remote control travel from the couch to the warmer receiver in the heat generating electronic equipment it controls?" - Remote controls emit high brightness narrow band IR that is focussed; the detector at the receiver can distinguish the RC bright spot against yhe background radiation coming fron your cup of tea and othe objects near you. Also the detectot has a filter to pass only the narrow band radiation emitted by the RC so that the effect of broadband (thermal) IR from your tea cup, the room etc., is reduced. 2/"How does the EMR emitted by a microwave oven travel from the cold walls of the oven to the warmer food being cooked?" - The microwave energy is repeatedly reflected by the walls until, sooner or later, it encounters the food to be cooked, where it is (mostly) absorbed. If there is no food in the oven the microwave energy builds up (there are warnings not to run the thing at full power when it's empty) and you will damage the device, possibly bustin the magnetron. 3/ "How does the EMR carrying radio and television broadcasts travel from the transmitter to warmer locations around it - rather than radio and television being routinely interrupted by minor local temperature variations?" - Same as 1/, except the transmitter is not focussed (much). 4/ "Heck, how does the EMR of 'sunlight' travel from the cold of space to the warmer upper atmosphere to the warmer still lower atmosphere? By your claims we should all live in perpetual darkness because sunlight cannot approach the warmer surface of the Earth." - The Sun is at about 5780K and that has the spectrum we see (well, our eyes do not see the infrared (IR) and ultraviolet (UV) but it is stil there). The Sun occupies only a small part of the sky so we do not get a the full 5780K here, only 279K. But sunlight still behaves with some of the properties of a 5780K source, it ionises O2 in the stratosphere to make ozone and it tans your skin, burning it if you are not careful. For the rest - no comment. -
TokyoTom at 21:43 PM on 24 March 2011The Libertarian Climate Conundrum
Thanks for your reference and link, grypo, and thanks for bringing attention to your post at my blog! 1. Here is what I posted in response to you: By popular demand, more meta-thoughts on climate confusion - TT's Lost in Tokyo http://bit.ly/f1HeHf 2. I also posted the following excerpts of related discussions on Dr. Judith Curry's "Libertarianism and the environment" thread: In response to 'heretic' Dr. Curry, more on my annoying, ( -snip- ) open-mindness on climate issues - TT's Lost in Tokyo http://bit.ly/f8gM4iModerator Response: [DB] Inflammatory bit snipped. Hot-linked URL. -
Marcus at 21:41 PM on 24 March 2011Zero Carbon Australia: We can do it
....also, Ken, why only focus on Wind? A zero carbon future won't rely on a single source of electricity-it will rely on the integration of several sources of electricity-depending on regional factors. Bio-gas, Wind, Tidal & Solar-not to mention conventional hydro-electric power could easily replace coal for our power needs-especially when you include a decent source of energy storage for Wind, Tidal & Solar. It will also rely on a more distributed system of electricity generation-a move away from the overly centralized approach we have now. Consider it the "networked computing" approach to electricity generation. -
CBDunkerson at 21:39 PM on 24 March 2011Preventing Misinformation
RSVP, it is much more complicated than that. Cloud formation requires alot more than just water vapor in the air. Temperature, pressure, and particulates for the water vapor to condense around all play a major part. Further, clouds are extremely effective at retaining heat in the same fashion that greenhouse gases do (which is why cloudy nights are warmer than clear nights)... and the albedo vs greenhouse warming balance of clouds varies with their altitude. Studies of all these phenomena are ongoing and still have conflicting/disputed results. There seems to be a slight preponderance of evidence that clouds are having/will continue to have a small net warming effect, but that is by no means conclusive. What can be said fairly clearly is that there is absolutely no evidence that the impact of clouds will be significant enough to offset any of the major warming forcings and feedbacks... even if we assume the best case possible cooling impact from the range of uncertainty of the data their net impact is tiny in comparison to warming effects. Lindzen, Spencer, and others have suggested fanciful ways in which clouds could have massive hitherto unknown cooling effects (e.g. the 'cloud iris' hypothesis), but as each of these has been examined the data has shown otherwise. -
Marcus at 21:34 PM on 24 March 2011Zero Carbon Australia: We can do it
"Wind farms take vastly more space for the same output than a coal plant and mine. You tell me how much space you will need for 750 x 3MW wind turbines which would equate to 1 x Kogan Creek" Again I ask you-give me the details? How much area does the Kogan Creek Mine site actually take up, & how much will it eventually take up before its life is over? As I said above, the land devoted to a coal mine & its associated power station is *lost* to any other use as long as the power station is in operation-something which can't be said of Wind Turbines. As Bern & I have already pointed out to you, existing technologies already allow for much smaller footprints for Wind Farms than what you claim. If you built a Wind Farm with modern 7MW turbines-with VRB storage-you'd be able to get the output of Kogan Creek with fewer than 200 turbines. You'd also be able to get the output with much, much less energy waste during off-peak periods. -
Arkadiusz Semczyszak at 21:25 PM on 24 March 2011Why we have a scientific consensus on climate change
@Marcus First: 2 + 0.6 it still is far from up to 3 degrees C ... secondly, ... when we consider "negative feedback": “The cooling effect would be -0.3 degrees Celsius (C) (-0.5 Fahrenheit (F)) globally and -0.6 degrees C (-1.1 F) over land, compared to simulations where the feedback was not included, said Lahouari Bounoua ...” Thirdly: The question relates to a method for determining who is a skeptic - and who is not - no effect "... when carbon dioxide was doubled ... " P.S. For of caution - supporters of scientific consensus, I will quote “an enlightening” story on the LIA - "black death. " (I think that in this way complements - perfect for me - "logical proof" Gilles). By 2004, existed (counting a number of years), the consensus in science regarding the direct cause of "black death" - bacteria spread by rats. Confirmed this theory hundreds of peer-reviewed scientific papers, authorities hundreds of “professors titles”. ... and suddenly appeared a work from Scott and Duncan: “Return of the Black Death: the World’s Greatest Serial Killer” - proving "beyond doubt" that a virus - not bacteria - killed millions of people - not only in the LIA, but in many other cool historical periods. At the heart of their chilling scenario is their contention that the plague was spread by direct human contact (not from rat fleas) and was, in fact, a virus perhaps similar to AIDS and Ebola. I think - faster than we suppose, the theory of AGW also find their: Scott and Duncan ... In April 2003, Dr. S. Derbyshire wrote that: we live "... among people of exciting information about the upcoming annihilation, in a world of fear of requesting, and awaiting cautions. Warnings mingle with our - timidity - the expectations of the disaster and fear for the planet. " And this psychological basis - perhaps is the only one undisputed scientific basis - scientific and political consensus on AGW theory - for example, the IPCC ... -
Marcus at 21:16 PM on 24 March 2011Zero Carbon Australia: We can do it
Ken Lambert, when you start talking about things like fake "medical" conditions associated with Wind Farms, then exactly what am I supposed to assume? Especially when you don't seem nearly as concerned with the very *real* medical conditions associated with the release of mercury, cadmium, radon & particulate emissions by conventional coal-fired power stations. @Scaddenp. You were right & I was wrong. I could have sworn I read 60% & 80% efficiencies *somewhere*-but it appears I was mistaken. As it stands, though, regular gas turbines get approximately 45% thermal efficiency, whilst combined cycle turbines get 60% thermal efficiency. However, from what I've read over the last 24 hours, this isn't the final word on gas-turbine efficiency (which is more than can be said for coal, which peaked at 35%). Either way, given that the gas can be obtained from effectively renewable sources-namely decomposing organic material-& has almost *zero* harmful emissions (aside from CO2), then this makes it much better for future energy generation than coal power stations. Also, as I understand it, a gas turbine can be built very small, whereas I have always been under the impression that there is a lower limit on how small a coal turbine can be built without *massive* trade-offs in thermal efficiency. So, here again, wouldn't it be better to have dozens of relatively small (50MW-200MW) gas-fired power stations-made up of several 10MW-50MW turbines-spread across an entire State, rather than just a few, very large coal-fired power stations-each of which has to spread its electricity out over *hundreds* of Kilometers? -
damorbel at 21:00 PM on 24 March 20112nd law of thermodynamics contradicts greenhouse theory
Re #804 CBD you wrote:- "The theoretic black body work (including Kirchoff) is based upon a "white light" excitation, equal across all frequencies, absorption and emission by the black body based upon the absorption/emission spectra." Arguing Kirchhoff's contribution was confined to 'black bodies' is not correct. Kirchhoff was the first to consider 'arbitrary' bodies, ones that reflect, refract, are (partially) transparent etc., e.g. mirrors, coloured bodies, gases etc., thus all radiation, including that with a narrow spectral range. Subsequent developments in atomic and quantum theory have not invalidated his work, which would have been rather unlikely because his work was the inspiration for it! -
cloa513 at 20:44 PM on 24 March 2011Wrong Answers dot com
adelady- that's demographers- they never claim to be scientists and providing numbers for politician etc to make decisions. Anyway there is whole bunch maths thats impossible in physics. e.g. 1K-2K=-1K Correct in maths meaningless in physics no such number as a negative kelvin whether its possible to get to below 0K is reasonable scientific question but below 0K the kelvin scale has no meaning it represents atomic vibrations. Energy in appropriate units can be added like mass but temperature its an inherent average of quantum states or group of atoms but how many and what about pressure. A mass of solid metal has whole lot more energy at one temperature than the same mass of gas. Skeptical science provides no science to back up its use of the global mean temperature. Statistical description of a set of numbers can be done an infinite number of ways. -
damorbel at 20:29 PM on 24 March 20112nd law of thermodynamics contradicts greenhouse theory
Re #785 CBD you wrote:- "LJ Ryan, I note that you continue to make nonsense claims about greenhouse gases being unable to redirect energy from a colder area to a warmer one while refusing to answer how a parabolic mirror does so." The absorption of radiation and re-emitting is not what is meant by 'redirect(ion)'. Redirection is what a mirror does, it does not change the wavelength (colour) of the (redirected) radiation; the energy is not absorbed by a mirror (or any other reflective process e.g. scattering, as with fog.) thus the temperature of the mirror is not changed. The converse is also true, the redirection of light by a mirror is, at first order, independent of the temperature of the mirror - a hot mirror works much the same as a cold one. -
Tom Curtis at 20:24 PM on 24 March 20112nd law of thermodynamics contradicts greenhouse theory
Following damorbel's logic @815, I can never pay of my debt to the bank. After all, it takes time to complete a transaction, and during the time, the Bank will make many transactions in which they credit other accounts. Therefore, if I make a payment on the debt, they will never have received it, for in the time it takes for them to receive it, a larger amount will have been paid out by them. Therefore, they should be under no obligation to credit my account with the amount paid. If that sounds like casuistry, it is only because the argument mirrors damorbel's. Transparently for those not inclined to casuistry, if in damorbel's book keeping, the energy of the incoming photon is immediately credited to the outgoing radiation, then the amount of energy lost by the absorbing body is reduced by the amount of energy gained from incoming photons. Because less energy is lost, the body will therefore have more energy (and hence be warmer) than an equivalent body that started at the same temperature and emissivity but did not have the incoming radiation. In fact, damorbel is really trying to run two sets of books here, and hoping that we do not notice. In one set of books he credits the incoming energy to the simultaneous outgoing radiation so that he does not have to account for the absorbed energy in discussing the temperature change of the absorbing body. In the second set of books he debits all outgoing energy from the emitting body. Only by keeping both books separate can he pretend that a cool body interacting with a warm body can change the equilibrium temperature, ie, the temperature at which incoming energy matches outgoing energy, for that warm body. -
damorbel at 20:15 PM on 24 March 20112nd law of thermodynamics contradicts greenhouse theory
Re #784 Re:- "Response: [muoncounter] We've heard the one about textbooks before. No need recycling your old ideas when they didn't work first time around" I have never raised the matter of text books, it would not occur to me to do so. It has been raised multiple times by other contributors and they received no warning about it I have responded about the reliability of text books. Are there matters to which I may not respond? I do appreciate the work done by mods.Moderator Response: [muoncounter] Perhaps you should have checked the link in my response to #784. Unless you are a different damorbel, you gave us the parable of your disdain for textbooks some months ago. Do try to keep track of your own words; they are there for all to see. -
CBDunkerson at 20:01 PM on 24 March 20112nd law of thermodynamics contradicts greenhouse theory
LJR #814: So, your latest nonsensical dodge is that EM radiation behaves differently if it has been absorbed and re-emitted than if it 'travels directly' and/or is reflected? Ignoring the ridiculousness of that claim for the moment; How does the EMR emitted by a remote control travel from the couch to the warmer receiver in the heat generating electronic equipment it controls? How does the EMR emitted by a microwave oven travel from the cold walls of the oven to the warmer food being cooked? How does the EMR carrying radio and television broadcasts travel from the transmitter to warmer locations around it - rather than radio and television being routinely interrupted by minor local temperature variations? Heck, how does the EMR of 'sunlight' travel from the cold of space to the warmer upper atmosphere to the warmer still lower atmosphere? By your claims we should all live in perpetual darkness because sunlight cannot approach the warmer surface of the Earth. The 2nd law of thermodynamics does not say that energy can not flow from cold to hot (regardless of whether it has been absorbed and re-emitted somewhere along the way). That is a ridiculous lie which violates thousands of observations from everyday life. What the 2nd law of thermodynamics actually says (in this context) is that the net flow of energy between objects in a closed system will always be from cold to hot... that is, energy flows from the cold objects to the hot ones and vice versa, but since the hot objects are giving off more energy than they receive the net flow is from hot to cold. BTW, your version of events violates the 1st law of thermodynamics... energy can neither be created nor destroyed. You argue that 'colder EM radiation' (setting aside that radiation has no temperature) cannot raise the temperature of a warmer surface... so what happens to it? You've got energy hitting a surface and not making if warmer. It simply ceases to exist. Violating the first law of thermodynamics. -
damorbel at 19:59 PM on 24 March 20112nd law of thermodynamics contradicts greenhouse theory
Re 805 e you write:- "The question does not ask whether the energy absorption is balanced out by emissions, just whether an absorbed photon leads to an energy gain." It takes time, I agree not very much, to absorb a photon, in this time only a body at 0K will not emit a photon. Perhaps it seems trivial to consider individual photons, infinitesimal time periods etc., these are normally handled at macro level by statistics but the bottom line is what happens at the individual photon, particle etc. You wrote further:- "As for how the energy is emitted, keep in mind the Stefan-Boltzman Law. The amount of energy radiated is dependent on the temperature of the material, not whether it has absorbed an extra photon recently" The S-B law is about power (W/m^2) not energy; the energy absorbed can only be found by integrating the power WRT time, during which a body above 0K is also emitting (power) according to S-B law. The equilibrium temperature is where the emitted power equals the absorbed power. It is worth noting that the equilibrium temperature requires only a power balance. A black body is the most efficient emitter but if the body is not black e.g. coloured, a gas or with a refractive index >1 etc., then its emissivity is less than 1. and will not emit so much power at a given temperature; conversley if the emissivity <1 a body will be hotter than a black body, this is why it is a great mistake to assume the Earth 'radiates like a black body'. -
Marcus at 19:54 PM on 24 March 2011Why we have a scientific consensus on climate change
Arkadiusz Semczyszak, you're kidding aren't you? Lets say Lahouari is correct, & a doubling of CO2 will "only" produce a roughly 2 degrees of warming-on top of the 0.6 degrees of warming we've already had, that's certainly enough to qualify as *catastrophic* in my books. Of course, I've never known you & reality to be close friends. -
Arkadiusz Semczyszak at 19:33 PM on 24 March 2011Why we have a scientific consensus on climate change
@CBDunkerson “The most likely value has remained about 3C for a doubling of CO2 in all of the IPCC reports.” Lynch - NASA, 2010.: “... Lahouari Bounoua, of Goddard Space Flight Center, Greenbelt, Md. Bounoua is lead author on a paper detailing the results that will be published Dec. 7 in the journal Geophysical Research Letters . Without the negative feedback included, the model found a warming of 1.94 degrees C globally when carbon dioxide was doubled. “ By me Lahouari Bounoua is definitely a skeptic - without values "3C for a Doubling of CO2" theory of catastrophe caused by AGW - it just does not exist ... How many of these "skeptics" are not included in statistical studies discussed here? 10 - 30 - 50%?Moderator Response:[DB] Arkadiusz, Bounoua et al 2010 doesn't mean what you think it means. It employs an investigative model to examine the effects of an already doubled (with climate at equilibria) CO2 upon evapotranspiration and vegetation density changes. What they found, based on these assumptions, with all other forcings and feedbacks assumed to be net zero, that plants could exert a slight negative feedback upon temperatures through a combination of growth and albedo changes. With all those caveats, Bounoua et al 2010 does not mean what some think it means.
-
Gilles at 18:55 PM on 24 March 2011The Climate Show Episode 9: Nuclear power and hot spots
scaddenp : no, you can have cooling of the stratosphere without warming of the troposphere , even with conservation of energy - for instance with an increase of albedo because of clouds - and more generally you can make the average temperature vary by modifying the latitude repartition without changing the energy budget. I'm not saying it's really happening, I'm just saying that cooling of the stratosphere can be explained only by the cooling effect of CO2 and doesn't say much about the ground temperature. -
scaddenp at 18:31 PM on 24 March 2011Teaching Climate Science
So when I am making an aircraft, and my models show undesirable behaviour, then I have make the plane to validate it? Of course not, thats why we have models. What you have to do is validate the model makes a reasonable job of predicting the behaviour of the planes we do make. That is the validation that goes into climate modelling. With confidence from that, then it is perfectly reasonable to evaluate other inputs. Suppose the modelling had showed that natural forcings gave a climate that was in the error bounds of natural+forcing? Then it would have been possible to say that while there might some grounds for concern from nature of GH theory, there was no conclusive evidence that we had anything to worry about. However, that is not what the models show and it is perfectly valid to show that. -
Bern at 18:27 PM on 24 March 2011Zero Carbon Australia: We can do it
Vague, If you have all the numbers, yes, I'd like to see a nice summary of it. It's an important consideration for ramping up of renewables - the availability of the generation equipment. It'd be interesting to see, for instance, how much rare earths are required for a 6-10MW wind turbine, compared to the generator for a 500MW or 750MW thermal power station. Ken Lambert - there are wind turbines available up to ~10MW, so that reduces the number required substantially. As others have pointed out, the footprint of each turbine is small, though you're right, 250 turbines would spread out over a fairly large area. They don't have to be in a single row, though - in fact, I recall reading something suggesting that 'cascades' of turbines can actually achieve higher efficiency in wind energy conversion. If you assume each turbine sits in the centre of a 250m radius circle (probably closer than you'd want to space them in reality), then you get 16 per square kilometre, so ~16km2 for 750MW worth. But, again, very low footprint within that 16km2. -
tjfolkerts at 17:10 PM on 24 March 2011Understanding Solar Evolution Pt. 1
Thanks for the links. I was apparently remembering some simplified evolutionary diagrams and/or diagrams for heavier stars. So I suppose my comment now works in reverse! Since the sun is WARMING, then proportionately MORE of the energy is currently in the UV. So UV is definitely stronger than before, while IR is staying closer to constant. In any case, the change in spectrum would be worth considering in addition to the simple change in overall luminosity. But I suspect that will some up in the next post. :-) -
actually thoughtful at 17:06 PM on 24 March 2011Why we have a scientific consensus on climate change
Gilles - it is certainly fair to ask some of the questions you are asking. But the entire problem with the "it's not that bad" crowd is the lack of evidence for that case. Indeed, with sea levels and arctic sea ice, we are finding that it is worse than previously thought. If you wish so sway readers here - you must supply some evidence, preferably peer reviewed. This crowd has notably higher standards for a claim than you may find on other sites. So what exactly do you think is a debatable point? And what is your evidence that the current consensus view is lacking in that department? What is the competing theory (hopefully as broad and robust as the current climate theory aka AGW)? Pick your best counter argument and please provide some real data to back it up. -
Gilles at 16:58 PM on 24 March 2011Pre-1940 Warming Causes and Logic
Dana "Sorry Gilles, you can't deny physics. The CO2 warming during the period in question is in the 0.1 to 0.15°C range. The ocean lag is only so large - to claim that only 33% of the equilibrium warming is realized over the period in question is not physically plausible." Still don't understand. 50 % is physically plausible and 33 % is not ? there is only a 30 % difference between the two - do you know the climate relaxation time with a 30 % accuracy ? nice. What's the value then ? -
Gilles at 16:54 PM on 24 March 2011Teaching Climate Science
scaddenp : I'm not saying that's unusual science. But even in normal science, computer simulations are never taken as evidence that things are real, until they have been carefully validated. I see here no real validation that things would have happened like that without anthropogenic forcing. May be it's impossible - sorry for that. -
Chris Colose at 16:42 PM on 24 March 2011Understanding Solar Evolution Pt. 1
Here is a good image for showing the evolution of stars at different masses, the movement for A to C being where our own sun is on the main sequence. Higher mass stars actually cool a bit as the luminosity grows on the main sequence, whereas the surface of our sun has gotten a bit hotter, but always bear in mind the luminosity depends on both the size AND temperature. A general rule of thumb is that if the core contracts (as I described in the post), the outer envelope often expands, and just like on Earth when you get rising air and enough expansion, it will cool. -
RSVP at 16:31 PM on 24 March 2011Preventing Misinformation
dana1981 #60 Should cloud coverage go up or down with global warming? If sea temperature overall increases, that would imply more water vapor, I assume, and I also assume more water vapor means more clouds. And more clouds means albedo goes up. Or are you going to say it is the other way around? -
protestant at 16:27 PM on 24 March 2011Pre-1940 Warming Causes and Logic
@DB for my response at #3: Those two posts of Tamino are not proving anything about AMO. He is just declaring it cannot be any cause and that's it. And he is no expert in this issue and should not be kept as such. In his AMO post he actually does several gross mistakes, which he should be aware of considering his backgrounds. I've tried to reason with him in those two posts but he just keeps deleting my comments, like he is doing to many other commenters as well. For example, removing GISS from Kaplan is nothing but [self-snip]. GISS does not use Kaplan, but Reynolds SST which has a larger trend in North Atlantic. Picking 1975 as a starting year is cherry picking since it gives the strongest trend but then again he has no explanation for what has happened before that. Secondly, like in the graph you pasted here, you are only comparing vs giss and not Hadcrut, where the latter is propably a more reliable result. Since it has not been calculated and adjusted by the modelers and which is clearly shown in how multidecadal dynamics show up. You actually cannot compare giss vs anything. Moderator Response:
[DB] "You actually cannot compare giss vs anything."
Well actually you kinda can (post here):

-
RSVP at 16:22 PM on 24 March 2011The Libertarian Climate Conundrum
alan_marshall #51 Thanks for the links. In the reading, there is this implied assumption that the rich consume more fuel and the poor less, when I am sure there are many cases where it is just the other way around in part because it is precisely those with more means who can invest in improving energy efficiency. And as far as the other idea, you do explain the target, but have not addressed the consequence in terms of the comparative global energy requirements. -
Gilles at 16:16 PM on 24 March 2011Why we have a scientific consensus on climate change
WheelsOC : everybody thinks warming is real - and everybody thinks that we have probably contributed to it. The issue is not here - it is whether it's enough to conclude that we should extract much less FF than we could, or not. There are a lot of things to ascertain before reaching such a conclusion , much of them do not belong to climate science (including : how much FF can we really extract ? which wealth do they produce? what would be the real impact of warming ? how far can we replace FF?) All these issues are very far to be certain - and have nothing to do with this poll. -
Gilles at 16:11 PM on 24 March 2011Why we have a scientific consensus on climate change
MuC"But then, you've not been long on facts, citations, references, source material, etc, since you arrived here." That's true, I'm not here for that. First i'm not a climate scientist, so my goal is not to discuss climate science - I doubt very much that anybody here is competent enough to settle so complicated issues. Second , citing that X or Y wrote that he made some model or some measurement does not prove per se that it's true - it just proves that he said it. Theologies are very fond of citations, references,and so on. I'm here just to see if people who claim that they've understood everything are able to answer rather simple objections. I'm not really convinced up to now - as I said, it's your burden to convince people that you're right. I am not defending any precise claim about climate - I'm just thinking that there is still much room for debate. So if you don't convince me, I loose nothing - you just miss your goal.Moderator Response: [Dikran Marsupial] The purpose of SkS is to provide a forum for discussion of climate science relating to global warming. If it is not your goal to discuss climate science, perhaps you should find another forum more suited to your goals. However, if you are not interested in discussion of climate science it is hard to see how you will ever be convinced of AGW, given that the evidence is climate science! Your attitude seems rather peculiar. -
L.J. Ryan at 16:07 PM on 24 March 20112nd law of thermodynamics contradicts greenhouse theory
CBDunkerson 802 "LJ Ryan, I note that you continue to make nonsense claims about greenhouse gases being unable to redirect energy from a colder area to a warmer one while refusing to answer how a parabolic mirror does so." NONE of the listed post in 802 do I say "unable to redirect energy from a colder area to a warmer". What I do say: lower temp IR can not increase the temp of a warmer surface. You said: "How does the observed reality that EM radiation travels from the surface of a parabolic mirror to the hotter object at the mirror's focal point not disprove your various statements quoted above?" EM Radiation is reflected, not absorbed and re-radiated, therefore the dish temp is irrelevant. -
Vague at 15:57 PM on 24 March 2011Zero Carbon Australia: We can do it
Ken #89 My research was done a week or two ago and I'm afraid I don't have any links saved. When I get home I'll try and pull up some of the sites for you. All turbines and electric motors require permanent magnets. Rare earth magnets are really the only ones that can do the job as magnets made by other means are not at all permanent, less efficient and need to be replaced periodically at great cost. The recall the figure of 28,000 tons a year for Neodymium production was based on 2008 figures, but in a graph the production had pretty much smoothed out. China suspending the export of its rare earths is easy to find with a search. Would it be worth me writing all of this up as a blog (with references) and posting a link? -
L.J. Ryan at 15:40 PM on 24 March 20112nd law of thermodynamics contradicts greenhouse theory
DSL 800 "Do I have this right?" I'm not sure I understand your entire concept. "But, of course, all atmospheric layers do radiate, and some of this radiation is absorbed by warmer surfaces and warmer atmospheric layers."---To what end. The warmer layers/surface does not get warmer do to this absorption. "Here's the key, though: the current temperature of any atmospheric layer or material within the system is that specific temperature because the atmosphere is already adding its radiated energy. The system is dynamic. if we take away the atmosphere, the surface eventually (quickly) reaches a lower equilibrium temperature. "---Again, I'm not sure I understand...but the lower temperature atmosphere can not increase the temp. of warmer surface. I don't agree with core of your last paragraph. Lower temp IR can not increase the temp. of a warmer surface.
Prev 1841 1842 1843 1844 1845 1846 1847 1848 1849 1850 1851 1852 1853 1854 1855 1856 Next


