


 Arguments


Recent Comments
Prev 178 179 180 181 182 183 184 185 186 187 188 189 190 191 192 193 Next
Comments 9251 to 9300:
-
Was Greenland really green in the past?
Part II...
4) As for Norse relations with the Inuit, we have the Inuits' recollections (see Rink's Tales and Traditions of the Eskimo). The Inuit themselves paint a mixed picture of relations with the Norse, sometimes friendly, sometimes hostile. It probably varied from tribe to tribe and time to time. They certainly didn't think of the Norse as maladapted. Diamond also mischaracterizes a case of an Inuit, who was found mortally wounded after a raid on a Norse settlement, as the victim of some Mengele-like medical experiment (see Gad).
As for why the Norse settlement failed, the arrival of the Little Ice Age didn't help, nor did occasional fighting with the Inuit (and possibly the Basque), but there were other factors. The Norwegian government placed high taxes on trade with Greenland, and required visiting traders to buy Greenlandic goods, which hardly helped. The biggest factor was the competition for walrus ivory with elephant ivory during the 14th Century. Greenland simply went bust, like many a boom economy.
-
Was Greenland really green in the past?
Daniel Bailey:
"If you want further proof and readings about what the Viking settlements failed, read Jared Diamond's "Collapse"…"
...and Eclectic:
"In the Greenland section of Jared Diamond's book "Collapse", he describes the Norse settlements in Greenland as failing owing to cultural factors rather than climate.
The rise & spread of Muslim power (in Africa and the Middle East) blocked or impeded the European import of elephant ivory. Consequently the Norse Greenlanders initially became quite wealthy by harvesting and exporting walrus ivory to Western Europe. But that trade later altered as "geopolitics" changed.
Some aspects of Norse farming methodology were not well suited to Greenland conditions, and there was necessarily a swing to more reliance on wildlife hunting and especially the harvesting of seals.
The Norse despised the aboriginal Inuit as heathen & uncivilized. Intermarriage with Inuit and prudent diplomatic relations with Inuit did not happen. The reverse — there were increasing hostilities with the Inuit, skirmishes and even some pitched battles (casualty numbers small but of course higly significant for such a small population of Norse. *IIRC*, Diamond equated the Norse warriors lost in the worst battle, as representing the U.S. Army losing 3 million men in a single battle).
In short, the Norse failed to live with their Inuit neighbours and failed to make full use of the "technology" which had sustained the Inuit in Greenland over thousands of years. A lesson for us all..."
Using Daiamond's Collapse is problematic.
1) Diamond's argument (actually, McGovern's, see "The Fate of Greenland's Vikings", Archaeology) that the Norse should have adopted the toggle harpoon for ring seal hunting ignores that fact that even the Inuit (Eskimos) couldn't make them work for coastal fishing during this time, since the ice wasn't thick enough (see Gad, History of Greenland, Vol. I, p. 166).
2) Diamond's (and McGovern's) claim that Greenland Norse didn't fish is ridiculous. When asked by a journalist, the archaeologist Jette Arneborg literally laughed (see Brown, The Far Traveler, 153). If Diamond had properly studied the Farm Beneath the Sands study, he would have realized that the reason so few fish bones were found is that they are very fragile, so the archaeologists weren't even looking for them at first. Once they started, despite the inherent difficulty, they found them (Enghoff, 7, 19, 48, 88). They also ignore Greenland Norse fishing gear, and the Norse accounts of fishing.
3) Diamond claims that the Norse over-forested and -grazed Greenland. Georg Nyegaard studied a Norse farm, and found it had minimal effect (see his talk with Brown in The Far Traveller, 159-160). It certainly wasn't bad enough to drive the Norse to starvation. Even Diamond admits that there is evidence for only one Greenland Norseman who may possibly have starved to death (Collapse, 267), even as he describes the easily found evidence for entire families of the supposedly well adapted Inuit starving to death in their igloos (264, 273). Apparently, the guys who weren't starving to death in droves were supposed to take tips from the guys who were.
-
Mal Adapted at 02:33 AM on 26 September 2019Using fallacy cartoons in a quiz
Fun quiz. I got 14/15 correct 8^}. Do I have to be a Twitter user to find out the aggregated results?
-
Bob Loblaw at 01:45 AM on 26 September 2019CO2 effect is saturated
PringlesX @ 548:
You say you "found a [sic] interesting site from chicago university that simulates the band saturation."???
How did you find it? That is the exact link I gave you in comment #540. You are reading the comments people make in response to your posts, aren't you?
Now, given that you have provided a series of graphs from that model "that simulates the band saturation", can you please provide us with an explanation of:
- exactly what in those diagrams "shows" what you claim is "saturation"? and
- exactly what the significance of that "saturation" is, with respect to CO2 and the greenhouse effect?
Right now, it looks like you are just throwing stuff at the wall hoping something sticks.
-
Bob Loblaw at 01:35 AM on 26 September 2019CO2 effect is saturated
GwbS@542:
Please do not make strawman arguments. I explicitly said that the diagram in comment 529 applies to the absorption ONLY of radiation, and that I have not considered emission. In comment 534 I give a list of other factors that must be considered. #3 is the mission of radiation. You do yourself no favours by arguing against a position that I have explicitly addressed as incomplete. When ONLY considering absorption, the decay is indeed exponential, and when considering the probabilty of a surface-emitted photon reaching space in one step, absorption is the only relevant factor. Photons emitted in the atmopshere above the surface are - by definition - not emitted from the surface..
You also refer to "reflected" IR radiation. IR radiation is not reflected. Reflection results in photons travelling in a different direction, but remaining at the same wavelength/frequency as they were before reflection. IR radiation is first absorbed, then re-emitted. The emission, as others have stated, is not dependent on the wavelength of the radiation that was absorbed - it depends on the temperature and characteristics of the molecule that is doing the emitting.This may be another CO2 molecule, but it may also be another greenhouse gas. It almost certainly won't be the exact same molecule that did the absorbing. This distinction between "reflection" and "absorption/re-emission" is critical in understanding atmospheric radiation transfer, and you do yourself no favours by conflating the two.
In 547, you state "They may be absorbed, but are emitted again within a fraction of a second". This is basically true, but the amount of time it takes a CO2 molecule to lose the energy by collision is a lot shorter than a "fraction of a second". Eli Rabett has done the math for us:
http://rabett.blogspot.com/2013/04/this-is-where-eli-came-in.html
The time estimate between collisions is 10 us. A CO2 molecule that absorbs IR radiation almost always loses it to other molecules via collision. CO2 molecules that emit IR radiation are almost alwys getting that energy from other collisions.
You also state "the fraction exiting at the top is inversely proportional to the length of the column (or the density)." Physical measurements in units of distance are irrelevant. What matters is the number of particles/molecules/etc. along a path. This varies with altitude depending on the local absolute concentration (not ppm, but molecules/unit volume).
Proper radiation calculations take this into effect.
I repeat what I said in post 534: "The only "saturation" that occurs is for useless and innacurate descriptions of the process." That specific wavelengths show zero direct tranmission of radiation from the surface to space is not an argument against the effects of increasing atmospheric CO2.
-
Ebel at 00:14 AM on 26 September 2019The Consensus Handbook: download and translations
Im Fazit des Handbuchs steht "mit Zahlenbelegen". Das erscheint mir zu wenig. Es sollte ein kurzer Abriß der Zusammenhänge gebracht werden. Stichworte: Änderung der Tropopausenhöhe, Schwarzschild.
In the conclusion (p. 21) of the manual it says "clear numeric terms". That seems too little to me. A short outline of the connections should be brought. Keywords: Change of the tropopause height, Schwarzschild 1906.
-
richieb1234 at 20:34 PM on 25 September 20192019 SkS Weekly Climate Change & Global Warming Digest #38
Moderator
Thanks. I will try that.
-
michael sweet at 11:50 AM on 25 September 20192019 SkS Weekly Climate Change & Global Warming Digest #38
Ritchieb,
Unfortunately, I am a dinosaur at extracting images.
I am doing well. I have moved off grid onto a sailboat and will be out of the country until December. I will infrequently post untill I am back.
-
AlexDeBastiat at 11:36 AM on 25 September 2019We're heading into an ice age
Thanks for your posts. I'm starting to see your points on this.
In the past, the orbital cycle must've had enough effect to start a feedback loop to begin the glaciation cycle. As the ice sheets grew, it reflected more and more solar energy. At the same time, carbon based life increasingly died off due to the temperature change, trapping CO2 on earth. When the orbital cycle reversed, all of this CO2 was released back into the atmosphere again through its own feedback loop (life begetting more and more CO2). This warming feedback loop is also proof that CO2 plays a very large role in warming as there is no other reason to explain how the temperature could spike so much during the interglaciations.
Now in the last 150 yrs or so...Humans have created a new mechanism which allows for a substantial amount of pre holocene CO2 (which was trapped deep under the ground) to be emitted back into the atmosphere....and this likely has altered the normal feedback loops we have seen in the data for the holocene.
Since there is so much CO2 in the atmosphere now, these cycles may now likely be broken and meaningless as our CO2 concentration are out of the norm for the holocene. This makes sense to me given that we are using CO2 from periods(jurassic, etc.) where temperatures were much hotter then the holocene.
-
richieb1234 at 11:13 AM on 25 September 20192019 SkS Weekly Climate Change & Global Warming Digest #38
Michael Sweet
How are you? Nice to hear from you again. I have the PDF, but I cannot extract the images. I was hoping someone knew where to find them at another location.
Moderator Response:[PS] Try here for suggestions on extracting images. Many images in that report are sourced from elsewhere so you could larger version by going to source.
-
michael sweet at 10:59 AM on 25 September 2019CO2 effect is saturated
GwsB,
At 547 you said:
"It is based on the idea that photons don't just disappear. They may be absorbed, but are emitted again within a fraction of a second. So I have problems with the first paragraph of post 546 by Michael Sweet which seem to suggest that there is no conservation of photons." my emphasis
This is incorrect. The CO2 molecule has many collisions (millions or higher) with other molecules before it can emit a new photon. The collisions convert the photon's energy into heat in the surrounding molecules.
As soon as a photon is absorbed by a CO2 molecule, the energy of the photon is converted into vibrational energy in the molecule and the photon no longer exists. The collision rate is many orders of magnitude faster than the emission rate so the energy is distributed by collisions to other molecules in the air. Other CO2 molecules, that are boosted into the excited state by molecular collisions, emit photons that effectively replace the original photon.
This is the primary mode of heat transfer in the atmosphere so it cannot be considered negligible.
It is my understanding that little heat is "reflected" back. Energy is absorbed by a layer of the atmosphere. Then new photons are emitted, both up and down, according to the temperature of the layer as described by the Boltzmann equation.
It seems to me that you are trying to model a system you do not understand well. I recommend you read what specialists in the field say to learn faster how the greenhouse effect works.
The emission altitude (about 10,000 meters) is the key point for the greenhouse effect. Here the atmospheric pressure is only about 25 kPa, 1/4 sea level pressure, and the temperature is -50C. The cold freezes out water (vapor pressure of .0039 kPa versus 1.2 kPa at 10C) and the effective CO2 concentration is 1/4 sea level concentration. Saturation is not an issue at 10,000 meters, nor is overlap of water bands. Discussing saturation at the Earth's surface is incorrect.
-
michael sweet at 10:09 AM on 25 September 20192019 SkS Weekly Climate Change & Global Warming Digest #38
Richieb,
GOOGLE suggests a PDF of the report is here
-
michael sweet at 09:50 AM on 25 September 2019CO2 effect is saturated
Pringlesx:
You raise an interesting question. Fortunately, the answer can be easily calculated.
According to this web site, insulation r values add. I am a cheap SOB so I buy cheap R=1 m2 T/W sleeping bags (metric units). Since I have 99 cheap sleeping bags the total R value is 99 m2 T/W.
To calculate the internal temperature we use the equation:
Watts = m2 x deltaT devided by R
My sleeping bags are 2 meters long and 2 meters around so they have a surface area of 4 meters square. A human body generates about 100 watts of energy while sleeping.
Plugging the data into the equation I find the temperature difference after you stay in the bags to equilibrium is 100W x 99R devided by 4 = about 2475 degrees C. If it is -50C outside than the center of the bag is 2425C. That is hot enough to melt steel!! If you add a cotton layer it would have little effect on the temperature (R<<1), but you would be dead after a night in your 100 sleeping bags. If I buy better quality R=2 sleeping bags it will be 5,000C at equilibrium.
We will all be dead if we follow your advice to do nothing about Global Warming.
-
scaddenp at 08:05 AM on 25 September 2019CO2 effect is saturated
Well if you want to push the sleeping bag analogy, increasing the insulation strength will always increase the temperature (Fourier Law). However, you cannot push the analogy too far. The key to understanding the saturation argument is undertstanding the importance of the temperature profile to absorption. The Modtran outputs you posted looked fine so I only assume you are not understanding how they work. Try this discussion.
Ultimately though, it is great to try and understand the impact of the equations, but it is unreasonable to deny the lab and field tested solutions. When you can directly measure the increase in radiation from added CO2, then obviously the effect is not saturated.
-
scaddenp at 06:56 AM on 25 September 2019We're heading into an ice age
"Secondly, there is no hard data offered in this argument to show why the tilt and orbit are weak for this time period."
I am not I following this. The astronomical cycles are very strongly established by observation (look up Milankovitch cycles or see the animations here). The effects on irradiation of the surface were calculated by hand by Milankovich (while in jail from memory) and have been repeated and checked numerous times.
An analysis of the current glacial cycle is in Berger 2002 but rather moot given our CO2 levels. Remember that Milankovich cycles have been around for a long time, but can only induce glaciation when CO2 levels drop to level where summer snows dont melt at around 65N during low irradiation. The last time we had 400ppm was pliocene and there was no glacial cycle.
-
Eclectic at 05:26 AM on 25 September 2019CO2 effect is saturated
PringlesX ,
sorry, but your "sleeping bag" analogy simply doesn't fit the situation.
And there seems to be no connection between Greenhouse and the "hockey stick".
Since the Hockey Stick has been well validated by a number of subsequent scientific studies (even without tree-ring data) . . . then it sounds like "Manhattancontrarian" is probably just one of those many clickbait blogsites. You know ~ one of those clickbait sites with stuff like "Scientists prove Earth is flat" . . . "Infrared photos show English Queen is a Lizardperson" . . . "Russian lasers show Moon is green cheese" . . . and so on.
Really, PringlesX, if Mr Manhattancontrarian has some astounding new earth-shattering information on The Hockey Stick (info is which strangely unreported by the world's media) ~ then please, please give us readers a succinct summary of it. On the appropriate SkS thread, of course. Let's not go down the brainless clickbait path !
Moderator Response:[PS] Please refraim from discussing "hockey stick" on this topic. Discussions of that belong here.
-
richieb1234 at 05:16 AM on 25 September 20192019 SkS Weekly Climate Change & Global Warming Digest #38
The report "Global Climate 2015-2019" has a number of very useful graphs and other images. Does anyone know how I can get electronic copies of them?
-
PringlesX at 03:45 AM on 25 September 2019CO2 effect is saturated
We seem to agree on that the effect lays in the TOA and the transmission curve at high altitudes.
So, just for fun, is it possible to explain the argumented athmospheric big effect with some analogy? :-)
If i am outside in antartica in 100 layers of sleeping bags. But the most outer sleeping bag is only a cotton layer so it radiates a lot from this layer at all its internal altitudes with the wind blowing though it etc.
Double the amount of CO2 to 800ppm corresponds to exchanging that 100th cotton layer into a regular sleeping bag. So now the transmission curve has changed drastically of the top layer.
But i was already in 99 nice sleeping bags. Could you alter the effect in this scenario that corresponds to what you believe is actually happening? -
PringlesX at 03:13 AM on 25 September 2019CO2 effect is saturated
Many of those spectrum in previous comments, is not showing the whole infrared transmission spectrum below 400 1/cm. Why? It seems be manipulative if there isnt good reason for it.
Anyway, I found a interesting site from chicago university that simulates the band saturation.

http://climatemodels.uchicago.edu/modtran/
(The site used in the following video:)
https://www.youtube.com/watch?v=ZMgNYDtueKQModerator Response:[DB] Please limit image widths to 450. Subsequent violations will be removed.
Inflammatory snipped.
-
Daniel Bailey at 00:57 AM on 25 September 2019Climate's changed before
In the spirit of transparency and full context, the basins of the Great Lakes are the product of repeated and successive glaciations, and not just the most recent. From Larson and Schaetzl, 2001:
"The basins that contain the Great Lakes are the product of repeated scour and erosion of relatively weak bedrock by continental glaciers that advanced into the Great Lakes watershed beginning perhaps as early as 2.4 Ma. Most of the scouring, however, probably occurred after about 0.78 Ma when episodic glaciation of North America was much more extensive, with ice cover sometimes extending as far south as Kentucky."
A full perusal of this fine document reveals that the southern lobes of the Great Lakes were ice-free at the near peak of the Last Glacial Maximum at 25,000 years BP and that the most southern advance of the ice during the last glacial phase occurred well after the LGM and during the deglaciation phase of the Laurentide Ice Sheet, when cold (dry) ice processes had shifted over to wet processes (promoting ice flow). From Figure 8:

Full copy available here.
The point is, it's pretty easy to show the interested onlooker just how uneducated your particular pretend-skeptic actually is by doing some digging. The plus side to all that digging is in the self-learning you accomplish.
-
Daniel Bailey at 00:36 AM on 25 September 2019Climate's changed before
"Alaskan Glaciers started receding big time around 1750 to 1900"
As opposed to those promoting misinformation, looking at the full context of the Holocene, Alaska glaciers have only been recently declining, reversing a 8,000 year period of growth and expansion:
Per McKay et al 2018 - The Onset and Rate of Holocene Neoglacial Cooling in the Arctic
"Arctic summer temperatures have decreased for the past 8,000 years, before rapidly warming over the past century. As temperatures cooled, glaciers that had melted began to regrow throughout the Arctic, a phenomenon and a time interval known as Neoglaciation.
This study seeks to understand the nature of this cooling and whether or not this indicates a tipping point in the climate system. Specifically, we use a large database of records from ice cores, lakes, ocean sediment, and more paleoclimate archives to detect patterns of cooling. We investigate these patterns, and climate model simulations, to determine what parts of the Arctic experienced Neoglaciation at the same time, how rapidly it cooled, and what climate models indicate about the causes of cooling.
We find that the Arctic did not cool simultaneously, but different regions cooled at different times and that the climate models perform well when simulating both the timing and amount of Arctic cooling."
Full copy available here.
Further, recent climate warming in the central Yukon region has surpassed the warmest temperatures experienced in the previous 13,600 years (and therefore likely the past 100,000 years).
Porter et al 2019 - Recent summer warming in northwestern Canada exceeds the Holocene thermal maximum

News release here.
-
Eclectic at 00:18 AM on 25 September 2019We're heading into an ice age
AlexDeBastiat @395 ,
Of the glaciation/deglaciation cycles of the last million years, each cycle has been unique in structure, because the precise relations of orbital eccentricity and planetary tilt have been subtly different.
So every cycle has been an "N of 1" . Yet the paleo evidence shows that these climate variations have nevertheless operated within narrow limits of conformation. And from those past cases we know that the present Interglacial would "naturally" last something upwards of 25,000 years without the human intervention which has now occurred. ( It is perhaps rather too early to say whether the current high levels of CO2 will cause a complete "skip" of the next scheduled glaciation. )
Alex , if you have some definite contrary evidence (i.e. a scientific paper in a respected journal) then please cite it.
Alex , your third paragraph is rather jumbled in its ideas. Could you please clarify what you mean?
On your fourth paragraph: I would be interested to hear whether (and how ) you would compare the dangers to humanity from the present-century very rapid global warming . . . compared with the dangers to humanity from a very slow ( 10,000 to 20,000+ years' duration ) of global cooling. [Though this cooling scenario has now become abstract & hypothetical.]
Basically, I am thinking that 10,000+ years is plenty of time for the human race to find technological solutions in dealing with such cooling . . . or perhaps even to revert to low-tech methods such as the well-proven anti-cooling technique involving burning a small number of gigatons of coal !
On the other hand: for dealing with the immediate & very pressing problems of rapid global warming during the next 50+ years ~ our politicians seem paralysed like rabbits in a spotlight.
-
GwsB at 23:47 PM on 24 September 2019CO2 effect is saturated
Thank you MA Rodger for posting the figures in Zhong and Haigh (2013). Would it be possible to print 6(c) separately in a post so one can read the explanation inside the figure.
The black line in Fig 6(c) which is horizontal to the right of 10**2 shows the instantaneous relative forcing due to the central interval of the CO2 absorption 650-680/cm, which is 15 μm plusminus 2%. At the present level of 400 ppmv there is saturation. Fig 2 in Zhong and Haigh (2013) shows that 650-680 is the peak of the absorption coefficient for CO2 between 500 and 1500/cm. The absorption coefficient in the central interval lies between 100 and 1000. In the shoulders the absorption coefficient lies between 1 and 100 and in the wings it is less than one. This is a rough impression. Figure 2 is not very detailed. The statement: "At wavelength 15 mm there is saturation" is true. The statement: "The contribution of the shoulders compared to the central region around 15 μm is negligible" is also true if one looks carefully at Figure 2. It is only by looking better at Figure 6(c) that one sees that the shoulders 590-650/cm and 680-750/cm do make a significant contribution and that saturation at these wavelengths is still far off (it will occur at 40 000 ppmv).
Zhong and Haigh (2013) have used the latest version HITRAN2008 for the analysis which underlies their paper. It is possible that older versions give different results for which the absorption of the shoulders is weaker. The notion of saturation is based on the iconic figure in Wikipedia https://en.wikipedia.org/wiki/Greenhouse_effect which was removed from my post 525 since it was too large. Saturation is a serious objection and it takes a lot of work (see Zhong and Haigh (2013)) to counter it.
The post 542 tries to get at the basics of "absorption" or "reflection" for long wave radiation at around 15 mm. The model I describe is a basic description in terms of photons. Since I am a mathematician specialized in probability theory it seems quite natural to me to use a random walk. I was surprised to see how well it fits with Figure 6(c) in Haigh and Zhong (2013) where one looks at narrow bands of wavelengths. The logarithmic increase shown in Figure 6(b) between 50 and 5000 is a fluke. It is meaningless. It is the result of adding a constant function, two concave functions and three convex functions in Figure 6(c).
The basic description in terms of reflection in post 542 does not take secondary effects like temperature differences in the troposphere into account. It is based on the idea that photons don't just disappear. They may be absorbed, but are emitted again within a fraction of a second. So I have problems with the first paragraph of post 546 by Michael Sweet which seem to suggest that there is no conservation of photons.
My understanding is that the amount of heat (energy) due to the vibration caused by the absorption of photons at around 15 mm is negligible, and that it is the long wave radiation reflected back to earth as described in the random walk model which is the "greenhouse effect".
-
AlexDeBastiat at 21:40 PM on 24 September 2019We're heading into an ice age
This answer is not adequate, and this is the one aspect of climate change that I can't get past. You are not using enough hard scientific facts to support your position.
Firstly, you say there was a similar condition as ours over 400,000 years ago that had a warming period of 30,000 years, but it is an N of 1. How can we rely on just one instance of data? I feel like this singular piece of data cannot be used as support for this argument.
Secondly, there is no hard data offered in this argument to show why the tilt and orbit are weak for this time period. When you are talking about thousands of years, the timing may be off by a couple decades. Just because you don't see things happening don't mean that they will not happen. This is a common falacy people have. Possibly the scientific community is measuring the wrong things? We should be looking at leading indicators of ice age activity.
Thirdly, there is also no discussion about the benfits of C02 which if it is stalling an ice age has likely helped save billions of lives as a new ice age would be catastrophic. Possibly there is a necessity for some C02 emission to prevent an ice age from forming.
-
MA Rodger at 18:31 PM on 24 September 2019Climate's changed before
TVC15 @776,
The denialist asks about the features of two different times and asks what is different today.
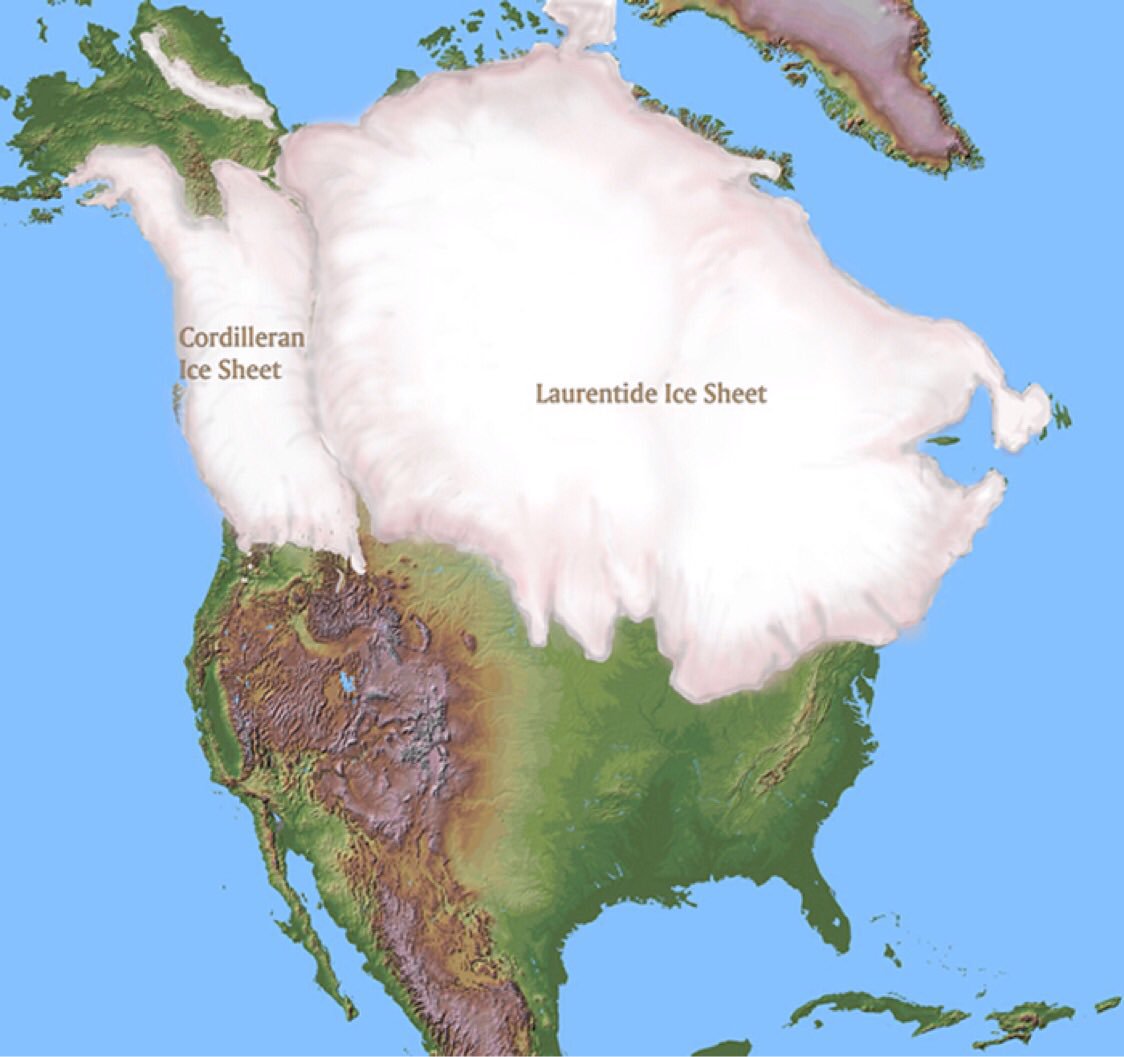
20,000 years ago was the maximum glaciation of the last ice age, this the result of reduced solar radiation for the high-latitude Northern summers which 100,000 years ago triggered an increase in the amount of ice-covered land/ocean in high Northern latitudes. The level of ice was amplified by the increased albedo of the ice reflecting away greater levels of solar radiation and by the reduced GHGs (CO2 & methane) caused by the cooling global climate having a net draw-down of such gases. Thus we find the Laurentide & Cordilleran ice sheets covering mainly Canada and beyond, extending to cover the sites of today's Great Lakes. (The map below ignores changing coast lines.) It thus requires the Laurentide Ice Sheet to melt considerably before the Great Lakes can exist, their formation reportedly beginning 14,000 years ago.
We now leap forward to a time when the Cordilleran ice sheet has long gone. Over recent times the dynamics of glaciers is not always determined by local temperature. A sea-terminating glacier will likely spend most of its days slowing advancing and then, becoming unstable, undergo a short period of rapid retreat. And reduced/increased snowfall can cause a glacier to shrink/expand.
So is there evidence that "Alaskan Glaciers started receding big time around 1750 to 1900"? Solomina et al (2016) who, in an analysis of global glaciers over the last two millenia, examine land-terminated glaciers in Alaska and see no sign of it. Their Fig 2 shows a GEI index indicating a fluctuation in local glacier size which peaked at about 1880AD. This would explain a "receding big time around ... 1900" but not the earlier 1750 date. Other research may give differing timings but it seems unlikely that there is any proper support for a 1750 to 1900 date. Can the denialist provide support for this bold assertion of his?
And "why is now any different"? The unprecidented global rise in temperatures will impact glaciers globally, including Alaska.
Moderator Response:[DB] Fixed image display issue
-
Eclectic at 16:46 PM on 24 September 2019Medieval Warm Period was warmer
JP1980 @265 ,
as Scaddenp (@266) indicates, there is much that is wrong with KalteSonne's blog article.
In the first paragraph, the blog asserts that the MWP was hotter (or "similar") in temperature to today. Which is false. Various types of proxy temperature measurements show that the Medieval Warm Period was cooler than today's global climate. In addition, the land ice-shelves and glaciers were larger than today's, and the mean sea level was lower than today's. All these three types of evidence demonstrate the warmth of today and the relative coolness of the MWP.
KalteSonne is indulging in wishful thinking — not scientific thinking. Having made such a blunder to start with, it is not surprising to find that there are subsequent errors.
In the second paragraph, he [presumably he] goes on to present a misleading picture by taking quotes out of context. He misrepresents the message of the IPCC. And he fails to understand that the MWP was such a slight deviation of average world temperature, that one would of course not expect it to show up in a "hindcast" of computational models based on 20th/21st Century climate. (Hence his attack on climatologists' models — an attack which seems to be his underlying purpose in discussing the MWP.)
A further failure of KalteSonne, is his failure to acknowledge (to himself and to his readers) that the current warming event is not only larger and definitely worldwide . . . and that it is greatly faster & has a continuing steep upward trajectory ~ all of which is distinctly different from the MWP.
Clearly, he fails to understand the mechanisms causing climate change.
In short: KalteSonne's ideas are nonsense.
-
scaddenp at 14:49 PM on 24 September 2019Medieval Warm Period was warmer
Where to start. Firstly as MA Rodger was pointing out, it is misrepresenting what the science says by selective quoting. Secondly, it is playing with a strawman fallacy in the title - CO2 is not the only driver of warming and model reconstructions can reproduce the pattern of warming.
An important contrast with today's warming is the lack of synchronicity globally. The CO2 science project hides that by going for very long time period and some very dubious baselining. There are numerous peer-reviewed papers which recontruct both NH and global temperatures which take a rigorous approach to handling the proxies (See the AR4 and AR5 for the list and plots) but of course these dont get the "right answer" for denialists.
-
JP1980 at 14:11 PM on 24 September 2019Medieval Warm Period was warmer
MA Rodger @264
Other than your comment about the truncation of the last paragraph of IPCC AR5 Section 5.3.5, do you have an actual complaint with the article's arguments?
-
TVC15 at 11:32 AM on 24 September 20192009-2010 winter saw record cold spells
Thank you both @19 scaddenp and @20 MA Rodger!
I found this graph as well that shows temps only rising in NY.
What I've learned in debating climate change deniers is that science deniers won't be convinced by evidence because their views are not based on a rational way of responding to evidence in the first place.
-
TVC15 at 10:10 AM on 24 September 2019Climate's changed before
A question from a denier.
The Northern Part of the US was covered in Ice 20,000 years ago and the Great lakes were only formed 10-14,000 years ago.
Alaskan Glaciers started receding big time around 1750 to 1900.
What caused all of that and why is now any different ?
All insights are welcome. :)
-
michael sweet at 02:12 AM on 24 September 2019CO2 effect is saturated
GwsB,
It may be the problem with your model is that the number of photons emitted from one layer is not related to the number of photons it receives from other layers. The number of photons emitted is determined solely by the temperature of the layer.
Esentially all of the photonic energy received is immediately turned into heat. Then photons are emitted according to the Boseman relationship (t to the fourth power). Higher layers emit less photons per m2 than lower layers because they are colder. Your model ignores the temperature differences. A single photon does not random walk to outer space. A modeled walk at light speed does not account for the time spent as heat.
When higher layers absorb more photons coming up (because the CO2 concentration is higher due to man made CO2) the escape altitude increases. The temperature is lower at the new escape altitude because the atmosphere cools as you go higher (at the lapse rate). This causes an energy imbalance because less energy is emitted at the cooler altitude according to the Bozeman relationship. The new altitude has to warm to return to energy balance. This warming is transmitted down according to the lapse rate and results in surface heating.
At the escape altitude the CO2 absorbtion bands are not saturated so increasing CO2 increases absorbtion. Water is essentially not present so overlap of bands with water does not count either. The escape altitude increasing is the key to understanding the greenhouse effect. The lapse rate is 6C per kilometer. The escape altitude is about 10,000 meters. If the escape altitude increases 100 meters the surface temperature increases 0.6C.
-
One Planet Only Forever at 00:32 AM on 24 September 2019Greta Thunberg is a painful reminder of decades of climate failures
nigelj,
I appreciate the feedback. It helps me increase my awareness and understanding of the fundamental problems that are challenging the achievement and improvement of the Sustainable Development Goals - what is reducing the rate of progress of humanity toward, or setting it back from, all of that understanding (not just the climate action goal).
I think the following may be a better way of talking about the innate human drivers identified by Haidt.
Organizations of humans take many forms. And those organizations are held together by what is driving them to be together. All of the 6 identified drivers can play a part.
Religious/nationalist groups, military groups, political groups and Business groups can be seen to be able to hold together through a combination of all of the characteristics. Without Caring being the governing characteristic, the groups can still hold together through a combination of the other 5 drivers being powerful enough. But they are then challenged by people who make Caring about Others the most important driver.
Caring challenges harmful United:
- religious and nationalist groups (desired superiority of Their group and intolerance of people who are different)
- military groups (willing to inflict harm on others, especially if they think they will be less harmed than those others they attack, worse if they think they will benefit from harming Others)
- political groups (using passion-triggering misleading marketing that focuses on the drivers Other than Caring)
- Business groups (the worst examples being blatantly criminal economic organizations)
I think most people would see the connections from that presentation.
And the way that the harmfully United can influence the telling of Stories through the mechanisms of the Propaganda Model should also be able to be seen.
And though Parfit's critique of Self Interest can be difficult to get through, it is very hard to argue against.
Self Interest, ungoverned by Caring for Others, can be a very bad thing.
The hardest thing for the Caring is the way they can end up divided into sub-groups of narrow focus, caring more about their special concern, claiming that Other Caring concerns are not as important. As the SDGs prove, all of the caring concerns are important and should be United in their collective achievement.
That is what concepts like the Green New Deal do, they try to Unite a diversity of Caring concerns in the hopes of collectively over-powering the undeniably powerful Unity of the diversity of groups opposed to being governed by Caring.
The likes of Gore and Greta (Soros, and Hansen and so many others) have become the faces of the challenge to the United Harmful, and the targets of their wrathful fight to be freer to be Harmful, freedom from the limitations of Caring about Others and the future of humanity.
-
michael sweet at 23:08 PM on 23 September 2019CO2 effect is saturated
GwsB,
In post 542 you describe 20 atmospheric layers. If the atmosphere had 20 layers with the same amount of CO2, they would not all be the same thickness. The top layer would be many times thicker because the atmosphere is thinner higher up. Molarity is much lower higher up. There is much less water because it is very cold. The CO2 path length is many times longer due to the lower CO2 concentration (400 ppm means lower Molarity at lower pressure. You appear to think the same Molarity of water and CO2 exist throughout the atmosphere. Ppm is not concentration, it is a fraction of concentration)
It appears to me that you have not considered the concentration differences at altitude so your model is incorrect. In general it is a waste of time to compare your own model to peer reviewed data.
The key to saturation is the lower CO2 and water concentration at height. Essentially no water exists at the escape altitude. Your model ignores these facts. At the escape altitude there is no saturation and adding more CO2 increases the absorption. That increases the escape altitude and causes surface warming.
-
MA Rodger at 21:31 PM on 23 September 2019CO2 effect is saturated
GwsB @543,
Figure 6 from Zhong & Haig (2013) is below with caption added beneath.
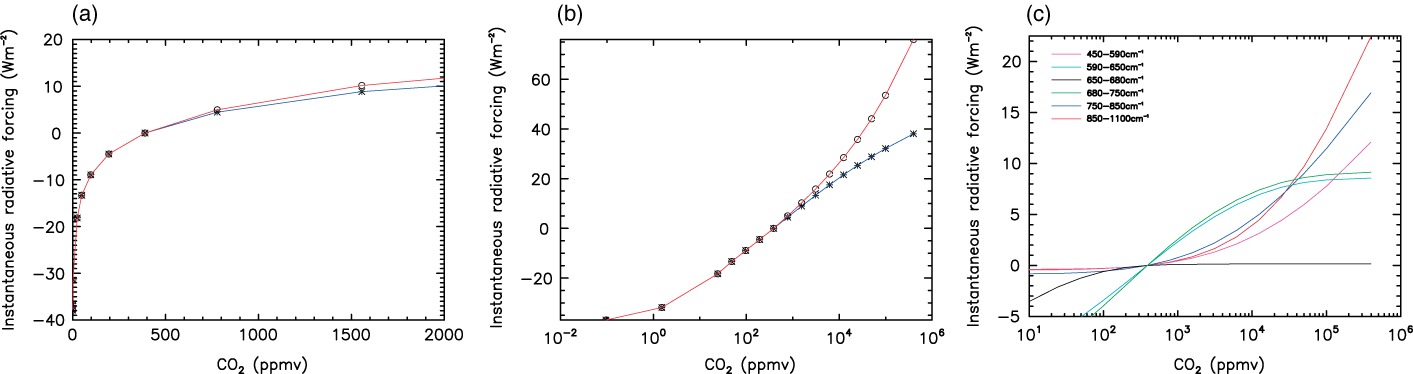
Caption (a) Instantaneous Radiative Forcing of CO2 (relative to the present‐day concentration) as a function of volume mixing ratio. The red curve is for the whole infrared region, 0–3000cm−1. The blue curve covers only the spectral region 550–800cm−1 (i.e. the 15μm band). (b) As (a) but extending to higher CO2 mixing ratios and presented against the logarithm of volume mixing ratio. (c) Radiative Forcing against CO2 mixing ratio for the six spectral intervals.
I'm not sure if fig6c is as easy to understand as Fig 5 of that same paper which I paste below, again with caption. (Plus it does provide both wavelength and wavenumber which is helpful, and being less wide, it can be displayed a bit biggerer than Fig6.)
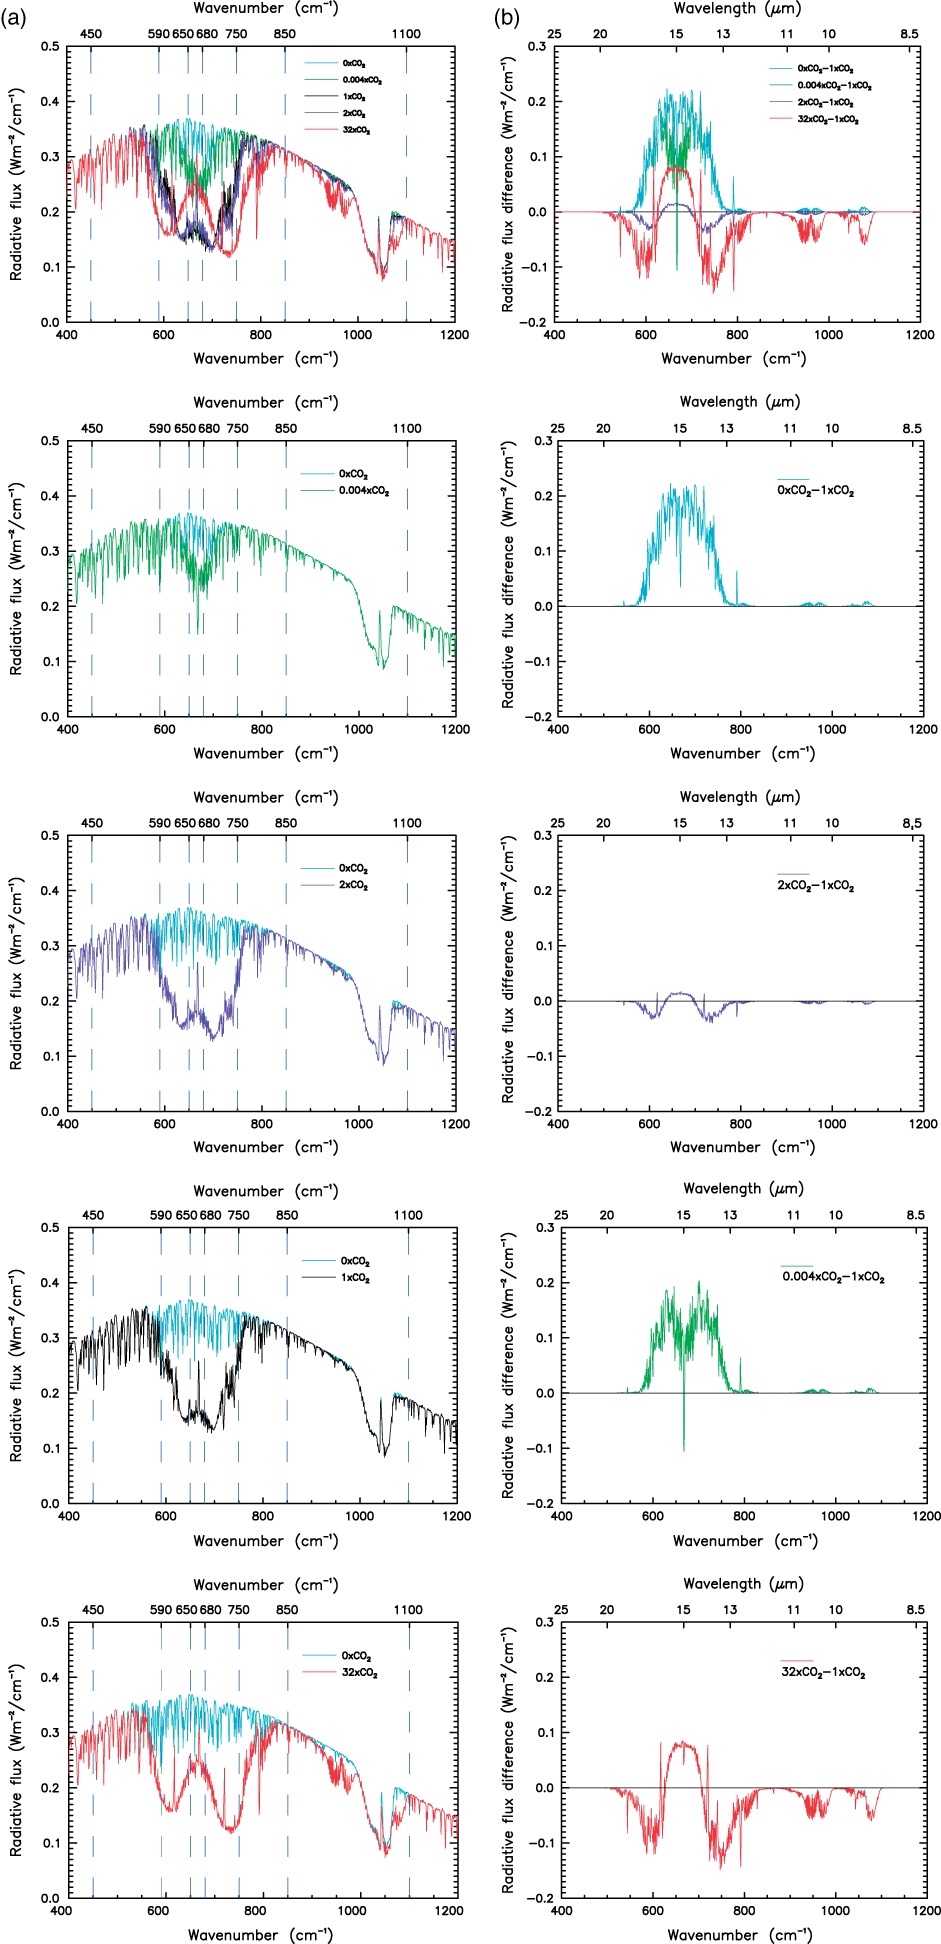
Caption (a) The top of atmosphere infrared spectrum calculated with CO2 mixing ratio (ppmv) of 0 (light blue curve), 1.5ppmv (green), 389ppmv (black), 2 × 389ppmv (purple) and 32 × 389ppmv (red). The vertical dashed lines mark the sub‐intervals discussed in the text: the CO2 15μm band core (650–680cm−1), the band central regions (590–650cm−1 and 680–750cm−1), the band wings (450–590cm−1and 750–850cm−1), and the CO2 10μm bands (850–1100cm−1) which overlap the O3 9.6μm band. (b) The differences between each CO2 spectrum in Figure 5(a) from that with the current CO2 concentration (389ppmv).
-
GwsB at 20:29 PM on 23 September 2019CO2 effect is saturated
The two figures in post 542 were not copied. They seem to be in the wrong format. I refer the reader to Figure 6(c) in Zhong & Haigh (2013) "The greenhouse effect and carbon dioxide" for the first figure, see https://rmets.onlinelibrary.wiley.com/doi/10.1002/wea.2072
The second figure is less important. It shows an approximation to the first figure in terms of exponential curves. The reader can make these approximations himself if she is interested. I am unfortunately not able to insert the pdf file into this window.
-
Postkey at 20:07 PM on 23 September 2019Greta Thunberg is a painful reminder of decades of climate failures
Plus ça change, plus c'est la même chose.
'Twenty five years before Greta, there was Severn, and we ignored her.
“Coming up here today, I have no hidden agenda. I am fighting for my future. Losing my future is not like losing an election, or a few points on the stock market. I am here to speak for all generations to come . . . We hear of animals and plants going extinct every day, vanishing forever . . . Did you have to worry of these things when you were my age? All this is happening before our eyes and yet we act as if we have all the time we want and all the solutions. I’m only a child and I don’t have all the solutions, but I want you to realise, neither do you. If you don’t know how to fix it, please stop breaking it.”
Reading this you could think it was from any one of the youth climate strikers. Greta Thunberg, or Saoi O’Connor from Cork. Instead, these words were spoken more than 27 years ago, by then 12-year-old Severn Cullis-Suzuki at the plenary session of the Rio Earth Summit in 1992.' -
GwsB at 19:49 PM on 23 September 2019CO2 effect is saturated
Bob Loblaw's curves in 529 exhibit exponential decrease. The decrease actually is a power law, more precisely the fraction exiting at the top is inversely proportional to the length of the column (or the density). If photons only travel upwards there would be exponential decrease. However photons are emitted by the CO2 molecules in all directions.
Here is the argument for (the discrete version of) 20 layers, which I number by 0 ... 19 from bottom to top. Bottom is the surface of the earth, top is outer space. Each layer contains the same amount of CO2. The argument is schematic. At the end of the post I come back to the topic of saturation.
Assume at level k there are 20-k photons for k=0, ..., 19. Half the photons jump downwards (to k-1) half upwards (to k+1). So level k loses all 20-k photons, but receives (21-k)/2 photons from its neighbour below and (19-k)/2 from its neighbour above. Thus it ends up with 20-k photons. This is the steady state. The bottom level, k=0, and the top level, k=19, need special consideration. These two levels form the boundary of the system.
1) At level k=0 half the photons go down into the earth and leave the atmosphere, and half go up to level 1. On the other hand level 0 receives 19/2 photons from level 1. In order to have a steady state we must assume an influx of 21/2 photons from the earth (due to heat radiation of the earth).
2) At level 19 there is one photon. Half this photon goes up into outer space, half down to level 18. Level 19 receives 2/2 photons from level 18 and none from outer space. So it ends up with one photon. Steady state.
The full picture is: At each step there is an influx of 21/2 photons from earth (due to the heat of the earth) to level zero and an outflow of 10=20/2 photons from level zero to the earth and an outflow of 1/2 photon from level 19 to outer space. That results in a steady state.
This description agrees with observations. Doubling the length of the cylinder (or the density of CO2) will reduce the amount of radiation into outer space by 50%.
The actual situation is more complicated. At each level there are millions of photons. Each photon flips a coin to decide whether it takes a step upwards (if the coin shows heads) or a step downwards (if the coin shows tails).
The actual situation is more complicated. The photon will travel a random distance in a random direction (uniformly distributed over the unit sphere) before being absorbed. The distance is in the order of ten meters, the time between being absorbed and re-emitted is of the order of 100 femtoseconds. Since the photon moves at the speed of light the whole random walk from leaving the heat bath of the surface of the earth until returning to the earth or flying off into outer space occurs in a twinkle of the eye. On my imac I can simulate a hundred thousand such random walks in a matter of minutes using a program of twenty lines of code in R.
Actually it might be better to speak of reflection. CO2 reflects some of the photons back to earth and others manage to pass to outer space. We speak of saturation if 99% or more of the photons are reflected back to earth, equivalently if 1% or less of the photons manage to escape to outer space.
The figure below gives a good picture of the effect of an increase of the amount of CO2 for different wave numbers. The proportion which manages to escape depends on the density of CO2 and on the wavelength of the photon. At wavelength 15 μm (650-680 cm-1) there is saturation. In the shoulders we are close to saturation. Doubling the density of CO2 will halve the number of photons which manage to escape. In the far wings the majority of the photons manage to escape and only a small proportion is reflected back to earth. Doubling the intensity will double the number of photons reflected back to earth. This also holds for the 10 μm wavelength (the red curve for wave number 850-1100).
If one makes plots for these different wavelengths with the amount of CO2 on the horizontal axis and the number of photons reflected back to earth on the vertical axis, and if one uses a logarithmic scale on the horizontal axis and a linear scale on the vertical axis, one obtains the plot below:
The curves are exponential curves because of the logarithmic scale on the horizontal axis. The black, sky blue and green curves have the form y=a-exp(-c(x-b)) where $x$ varies from 1 to 6. The constant a, b and c depends on the colour: a=0 (black), a=8.5 (sky blue) and a=9 (green). The red blue and pink curve have the form y=a+exp(c(x-b)). In the plot below the coefficients a, b and c have been chosen so as to get a reasonable fit.
The plot at the top is Figure 6(c) in Zhong & Haigh (2013) "The greenhouse effect and carbon dioxide". The plot at the bottom is a free hand fit by exponential curves. At present the contribution for the six wave number intervals is approximately the same. Saturation holds at the central interval, but not yet at the shoulders. The contribution of the wings will become predominant if the amount of CO2 passes the level 40 000 ppmv, when CO2 makes up more than 4% of the atmosphere. At that moment saturation holds at the shoulders. The instantaneous radiative forcing is approximately 9 for all five curves which adds up to 45 (see Figure 5(b) in Zhong & Haigh) which corresponds to an increase in temperature of 11K. That increase is without feed back effects.
-
MA Rodger at 17:58 PM on 23 September 20192009-2010 winter saw record cold spells
TVC15 @18,
Firsty note that the denialist is talking of "New York City" which is even more 'single point' than "a single state". And of course such a localised temperature record, be it state or city, provides no evidence on its own to prove or disprove the existence of temperature rises resulting from AGW. I would assume the use of 30-year rolling averages is a nod to the data being climate rather than weather although still local climate.
That said, has the 30-year rolling average temperature of NYC "barely budged since the 1960's"?
I am no expert of US temperature records, but a quick trawl of the GISTEMP site yields GHCN data for New York Centrl Pk Twr. I haven't checked the Long/Lat but will assume this is as it appears - a record from the heart of NYC. Bar four years, the record is complete back to 1880 and when presented as 30-year rolling averages it shows a rise since the early 1970s of +0.026ºC/year which is well above the global (land+ocean) average of +0.018ºC/year but perhaps about right for land temperatures and perhaps a bit on the high side of US land. (This NASA web-page says "Since the year 2000, land temperature changes are 50 percent greater in the United States than ocean temperature changes.") Relative to 1960, the latest 30-year average (data to 2018) stands +0.65ºC higher. So I struggle to see a temperature that has "barely budged since the 1960's"
And another source of temperature data for NYC is BEST which provides data (but only to 2013) showing the 30-year rolling average rising at +0.025ºC/year since the early 1970s and a rise of +0.51ºC (data to 2013) which is thus showing the same as the GHCN data.
So a question to your denialist is to ask where they gets their data from. Is it actually from NYC, NY, USA?
-
nigelj at 17:11 PM on 23 September 2019Greta Thunberg is a painful reminder of decades of climate failures
Mal Adapted @17 .
I agree except I wouldn't even call it cowardice. It's just being pragmatic about the issues, and not shooting ourselves in our own feet.
-
nigelj at 17:07 PM on 23 September 2019Greta Thunberg is a painful reminder of decades of climate failures
Al Gores movie An Inconvenient Truth was the main thing that really got me interested in climate change. It communicates brilliantly and is correct on the key issues. My point is Gore is a liberal politician expounding on the science, so its easy for denialists in America to rubbish his liberalism and so the science as well by association.
-
nigelj at 17:01 PM on 23 September 2019Greta Thunberg is a painful reminder of decades of climate failures
OPOF @18, regarding selfishness. I suspect Ayn Rands dreadful book "The Virtue of Selfishness" has underpinned neoliberal economic thinking since the 1980's. Imo it's one sided, superficial and unscientific, but you and others might be interested. I found a free copy here:
archive.org/stream/AynRandTheVirtueOfSelfishness/Ayn_Rand-The_Virtue_of_Selfishness_djvu.txt
-
One Planet Only Forever at 15:26 PM on 23 September 2019Greta Thunberg is a painful reminder of decades of climate failures
nigelj@11,
The list of Haidt's set of drivers in my comment @7 were the Heading Names. I introduced the list with the following "And Jonathan Haidt has identified a set of innate (fundamental) human characteristics. Those characteristics can amplify a person's tendency to allow personal or Tribal self interest to overpower their ability or interest in improving their awareness and understanding to pursue sustainable improvements. The innate human concern for Caring/Helping (not harming), can be compromised by innate concern for:"
What was included in (brackets after each name) was a simple presentation of each driver to show its potential for Harm. They each also can be seen to fit the Libertarian mono-driver (each person chooses their Tribe, but their choice can be understood to be Not Helpful - meaning it is an unethical choice). Choosing to care about a Tribe without caring about the Tribe's impact on others is not ethical. Universal Care has to govern, especially for leaders.
As I am learning from reading more, particularly Noam Chomsky, the more I appreciate that "Telling a story that supports the status quo is easy to do". More time, and a lot more words, is needed to provide a detailed context for any story that challenges the status quo. Without that added presentation of a robust context, the story can easily get misinterpreted through the status quo filters.
Defence of Self-interest (selfishness from the individual level through to any Tribal sub-set of humanity level) is a powerful part of the status quo because it can be a powerful driver of human behaviour - it takes constant effort, and a willingness to sacrifice potential personal benefit, to not be governed by it. This continues to be the case in spite of robust arguments proving the fatal flaws of being governed by self-interest presented by Derek Parfit in the 1980s (and less robust presentations of that understanding that were made far before Parfit's very detailed arguments).
-
Mal Adapted at 12:49 PM on 23 September 2019Greta Thunberg is a painful reminder of decades of climate failures
I personally don't have any beef with Gore whatsoever, and I dismiss appeals to purity. I agree with Daniel's assessment of him. OTOH, like nigelj I'm uneasy about his already having been made, through no fault of his own, into a green boogeyman by the aforementioned disinformation strategy of fossil-carbon capitalists. My hope is to elect a Democratic POTUS and senate majority, and I'm worried Gore is too big a target for skilled mercenary culture warriors. Am I a coward? Maybe, but in the present circumstances I'd rather be a live jackal than a dead lion.
Al Gore will say whatever he wants through this election cycle, regardless of what I think, and the NYT will give him a moderately left-leaning platform. I'm just nervous, on account of the stakes.
-
nigelj at 11:38 AM on 23 September 2019Greta Thunberg is a painful reminder of decades of climate failures
Daniel Bailey @15
“It seems like you're holding his (Gores) background against him, which is an Appeal to Purity. Deniers do this, surely. “
Sometimes background counts. It depends on the circumstances. This website talks about how scepetics use "fake experts" for example. However having certain qualifications neither makes someone's argument right or wrong.
But a political background is something else, because it makes Gore an especially easy target for the denialists as I stated. You have not told me why you think I'm wrong about that aspect of things. His advocacy has probably been very effective outside of America, but he has probably split opinion within America. Given this is he the right person for the Democrats to champion any more as a climate expert? Wouldn't it be better if he kept a low profile?
“The difference is that Gore has gotten more right about the science than any randomly-selected 100 deniers. Unusual, for a politician."
Agreed.
“Yes, Gore is not a scientist. So what? He never claimed to be one.”
Your argument is a strawman. I never claimed Gore was not a scientist and therefore lacked the right or credibility to speak out or was less believable. I simply said his politics is so huge it has made him an easy target. Why ask for trouble?
“Allowing deniers to dismiss Gore is ceding the field to them by allowing them to control the narrative surrounding the science. While not a Gore fan myself (I never voted for him, despite having the chance), I repect his temerity, backbone and his standing up for the science. Also unusual for a politican.”
Strawman. I never suggested we allow denialists to dismiss him. In fact I specifically said we should defend him, just that it would be advantageous if he kept a low profile.
I respect him as well, and he's mostly right about the science, maybe 95% right. But that was never the point of my comment.
-
scaddenp at 11:10 AM on 23 September 20192009-2010 winter saw record cold spells
TVC15 - cherry-picking. Always suspect cherry picking or strawman fallacy when talking to deniers. Have a look at global distribution of temperature change and see why they may have picked NY. eg here.
-
Daniel Bailey at 10:16 AM on 23 September 2019Greta Thunberg is a painful reminder of decades of climate failures
"the difference is Mann and Hansen keep their politics to themselves, while Al Gore has a huge political profile, and was in a position of political power"
It seems like you're holding his background against him, which is an Appeal to Purity. Deniers do this, surely.
The difference is that Gore has gotten more right about the science than any randomly-selected 100 deniers. Unusual, for a politician. Yes, Gore is not a scientist. So what? He never claimed to be one.
Allowing deniers to dismiss Gore is ceding the field to them by allowing them to control the narrative surrounding the science. While not a Gore fan myself (I never voted for him, despite having the chance), I repect his temerity, backbone and his standing up for the science. Also unusual for a politican.
-
nigelj at 09:53 AM on 23 September 2019Greta Thunberg is a painful reminder of decades of climate failures
michael sweet @13, surely the difference is Mann and Hansen keep their politics to themselves, while Al Gore has a huge political profile, and was in a position of political power. The denialists (falsely) accuse Gore of inventing climate science and given hes a liberal by conflating these things it almost certainly discredits cimate science with the Republican base. This has to be a key reason the climate issue is so polarised in America.
So I just think Gore needs to keep a low profile. That's not to say we shouldn't defend Gore if he does speak, out or if he is discussed. I certainly do.
-
michael sweet at 09:27 AM on 23 September 2019Greta Thunberg is a painful reminder of decades of climate failures
Nigelj,
Do you really think the deniers should choose scientists representatives? Al Gore has educated himself and sticks to the science. The deniers also demonize Hansen ad Mann. They are going after Greta Thernburg.
We should strongly back everyone who supports science.
-
nigelj at 07:05 AM on 23 September 2019Greta Thunberg is a painful reminder of decades of climate failures
Mal Adapted, I've read and ejoyed several of Al Gores books, but I agree about him. Republicans use him to try to discredit the science by linking it to liberals and it wont stop until he keeps quiet. He would do us all a favour if he withdrew from the climate debate completely. I hate this, but its the only way.
-
nigelj at 06:48 AM on 23 September 2019Greta Thunberg is a painful reminder of decades of climate failures
OPOF @9, Haidts list as typed in your comment at 7 was a bit odd for the reasons I stated, but Haidt's list in your comment at 9 makes much more sense. I read up on moral foundations theory some time ago, and found it quite compelling.
I suspect Libertarians brains are wired up a bit differently. They reject rules or constraints on principle, where most people have a more normal level of scepticism. I would say that if libertarians don't like a rules based society, they should go and live alone in the bush somewhere. We don't have to be dictated to by this crowd of ideological fanatics.
Prev 178 179 180 181 182 183 184 185 186 187 188 189 190 191 192 193 Next


