


 Arguments


Recent Comments
Prev 1852 1853 1854 1855 1856 1857 1858 1859 1860 1861 1862 1863 1864 1865 1866 1867 Next
Comments 92951 to 93000:
-
L.J. Ryan at 14:54 PM on 21 March 20112nd law of thermodynamics contradicts greenhouse theory
scaddenp647 KR671 KR "If, however, you carefully add up the Trenberth numbers without rounding you get an imbalance of about 0.9 W/m^2 less leaving than arriving. That's the forcing. " scaddenp "Umm, this is about whether the GHE is consistent with thermodynamics. If it is, the adding CO2 will create forcing as KR has pointed out. (and is measured at TOA)." Low temperature, (lower energy) atmosphere adding radiative heat to the warmer surface is a violation of the 2nd law. To proclaim star sourced energy can be increase itself by it's own reflection and/or re-radiation is a violation of the 1st law. "Like conduction, thermal energy is in harmony with the second law of thermodynamics such that, in the absence of work, thermal energy is radiated spontaneously from higher temperature to lower temperature matter." M. Quinn Brewster Thermal Radiative Transfer and Properties -
L.J. Ryan at 14:51 PM on 21 March 20112nd law of thermodynamics contradicts greenhouse theory
Tom Curtis 699 You said: "I get 3.4249 * 10^-19 Joules per photon myself, and hence four times that energy contained in the box." How does a photon of 3.4249 * 10^-19 Joules outside the box increase it's energy to 1.36996E-018 Joule inside the box? And now having a wavelength 145 nm inside the magic box, the photon (as a stipulation of the filter lid) can escape to the vacuum..where it instantaneously lengthens to 580 nm. This most improbable supposition is the basis of your models and GHG theory...shown here to clearly violate the 1st law. -
Bern at 14:29 PM on 21 March 2011Zero Carbon Australia: We can do it
@scaddenp: "I dont think we need major new technology to change that equation" That's exactly right! If you've read the ZCA report (as I have), you'll note that they state up-front that that was one of their 'design constraints' - that no major new technology is required. What this also means (and something that a lot of people overlook) is that the ZCA report specifically *excludes* any technology that will be viable in even 15-20 years. The objective of their plan is, after all, to be zero-carbon in just 10 years. -
robert way at 14:18 PM on 21 March 2011Pre-1940 Warming Causes and Logic
DB, You are courteous as always. Either way though, for me its not a big issue. I think that the 1940s are mostly irrelevant to the climate change we are dealing with now anyways. Explaining the 1940s warming using models just needs a little bit more fine tuning, i.e. ramp up one parameter versus another for example. I've often wondered how it is that modelers and some of my colleagues think that factors do not change how much they can contribute through time... i.e. maybe the reason the 1940s are not as well explained using models is because they rely on the response of the planet to be constant through time to a given factor (solar for example) when it very well may not be. Either way, I agree that your response to protestant was probably the best approach because it deals with more than just the one factor. Better than just one like the one I *cherry-picked* as my pet project haha... -
scaddenp at 14:03 PM on 21 March 2011Those who contribute the least greenhouse gases will be most impacted by climate change
Has Gilles ever cited a paper to support any of his claims on any thread?
Response:[DB] In his most recent 40 posts, Gilles references the IPCC once, but no original research papers. Before that here at SkS: not that I recollect. He may have in his tenure over at RC; I did not catch all of his comments there (but saw most).
-
scaddenp at 14:00 PM on 21 March 2011Zero Carbon Australia: We can do it
Agnostic - first I'm inclined to agree that SCT is coming tech not here. I would note though that PV is a lot more expensive than SCT so it's hardly the most expensive of renewables. The various marine options are even more expensive now. Will it change quickly? SCT costs are almost all in the construction. When every station is a custom build, then parts will be very expensive. On the other hand, I dont think we need major new technology to change that equation. -
michael sweet at 13:47 PM on 21 March 2011Those who contribute the least greenhouse gases will be most impacted by climate change
Gilles: You say "I don't know any of them" Fortunately there are people who are more technical and imaginative than you. this thread describes ways to electrify Australia, using only current technology. They writers of the Zero Carbon Australia promise additional reports to answer your questions. Scientific American has published two articles about alternate energy. One powering the entire USA (all power, not just electricity) using solar alone and one using mixed renewable energy. The second article seemed more practical to me. If you include the external costs, like health problems caused by coal burning, renewable is cheaper than FF. It is difficult for me to discuss solutions with someone who strongly insists we must continue FF use or civilization will collapse while ignoring that FF will shortly run out. I see little or no citation of written support for your positions, only your opinion. I think I will leave this argument to others who have more patience. -
Marcus at 13:40 PM on 21 March 2011Zero Carbon Australia: We can do it
From my reading on Wind Turbines, the life-time CO2 footprint is around 5g CO2/kw-h, & a Wind Turbine has an energy pay-back time of about 20 months, & will return more than 30 times the energy investment over its lifetime. Like I said above, though, this assumes current methods of steel & concrete manufacture are used-but there are relatively new methods that have a much lower carbon footprint. Also, that energy pay-back time & life-time CO2 footprint can be made even lower if energy storage-particularly Vanadium Redox Batteries, electrolysis or regular batteries-is also used, as this will double the capacity factor of a wind farm. -
robert way at 13:24 PM on 21 March 2011Pre-1940 Warming Causes and Logic
DB, To be fair in your response to Protestant you claimed that Tamino showed that the AMO does not affect the global land-sea temperatures but that's not an accurate statement. Tamino's analysis there isn't great and I had a long drawn out "discussion" with him in the comments section if you'll notice. We agreed to disagree. A better discussion of the AMO is probably here: http://rankexploits.com/musings/2011/the-atlantic-multidecadal-oscillation-and-modern-warming/ and subsequently in the comments. All in all the AMO probably did contribute more to the mid century warmth than people give it credit but that was in addition to the other factors mentioned by Dana. Together they created the 1940s warming.
Moderator Response:[DB] Robert, I accede to your judgement on this matter of the AMO. In that the referenced links above also considered other oceanic cycles (and other exogenous factors) that Tamino has studied, like the PDO, my comment was more dealing with overall picture. I have read & re-read your exchanges with Tamino & respect very much both of your opinions. I will also re-read the Rank Exploits post again.
Out of laziness I only referenced a few of the many Tamino posts on cycles. A search of the Open Mind site will reveal those; the rest can be found at the Archives (except for January and February 2010 posts).
-
Marcus at 13:24 PM on 21 March 2011Zero Carbon Australia: We can do it
Ken Lambert, to the best of my knowledge, coal fired power stations in Queensland haven't exactly fared too well in the floods either. 85% of Queensland's Coal Mines were left operating at *well* below normal capacity-with most of them being completely shut down. Rail links between coal mines & coal stations were washed out by the flooding, & at least 2 of the coal power stations apparently had operating difficulties due to flood waters. All of which led to a huge amount of load shedding during the flood crisis-not to mention the towns which were completely cut off from their electricity supply by the flood waters. So you see, Ken, your desire to focus on the impacts of extreme weather events on renewable energy ignores the fact that these extreme weather effects have a similarly negative impact on so-called conventional sources of electricity. Also, can you provide *proof*, Ken, that wind resources in Queensland dropped during the flood crisis? My understanding was that the low pressure system that brought in that rain was also associated with above average winds-but maybe I heard incorrectly. Lastly, its worth noting that during another extreme weather event-namely the Victorian Bushfires of 2009-large areas lost their coal-fired electricity because of ash & smoke shorting out the high voltage lines. However, many of these homes would have *still* had electricity if they'd all had grid interactive solar panels. -
Tom Curtis at 12:58 PM on 21 March 20112nd law of thermodynamics contradicts greenhouse theory
RW1 @702, do you mean that you have been muddying the waters by insisting on using non-standard definitions of back radiation, and treating all radiation to space as having originated either directly or indirectly from the surface as a matter of definition for no purpose? The topic of discussion in this thread is the Greenhouse effect and the 2nd law of thermodynamics. If you do not think there is a contradiction, and are not arguing against those who think their is, you have nothing to add to this thread because you are of topic. -
Tom Curtis at 12:49 PM on 21 March 20112nd law of thermodynamics contradicts greenhouse theory
damorbel @711, almost right. The temperature of a gas is its mean kinetic energy. That can be expressed in terms of the sum of its kinetic energies for each of its external degrees of freedom, but that does not include internal degrees of freedom, ie, rotational or vibrational energy. The heat capacity ratio of an ideal gas, on the other hand, does depend on the internal degrees of freedom as well, so that the heat capacity ratio is just (f+2)/f where f is the degrees of freedom. The heat capacity at constant pressure and the heat capacity at constant volumes are then just simple functions of the heat capacity ratio. The interesting thing about energy in the form of external kinetic energy an energy in the form of vibrations and rotations within the molecule is that they tend to equalize, so that the energy in each degree of freedom is, on average, the same. That means that when kinetic energy in the axis perpendicular to the surface is lost due to gravity, it is partially replaced by energy from the two axis parallel to the surface, plus from rotational and vibrational energy as a result of collisions. Likewise, a molecule gaining kinetic energy perpendicular to the surface will tend to redistribute it to the other degrees of freedom as the result of collisions. So, it is not gravity alone that determines the lapse rate, but gravity and the redistribution of energy form the various degrees of freedom of the gas molecules, ie, gravity and the heat capacity of the gas. Hence, the lapse rate equals the negative gravitational acceleration divided by the specific heat for constant pressure. All of which is very interesting, but as has been pointed out before, it does not determine surface temperature. It only determines the relationship between surface temperatures and the temperatures at given altitudes. In other words, these fact could all be true about the atmosphere and the Earth's global mean surface temperature be 255 degrees K. It is the greenhouse effect which explains why it is not.Moderator Response: [muoncounter] Lapse rate is another favorite drum to bang; see 30 November, 525 comments up thread. -
adelady at 12:08 PM on 21 March 2011Climate Emergency: Time to Slam on the Brakes
Long after we've slammed on the brakes, the jaws of life will be applied by quarrying and simple milling, or more sophisticated processing, of olivine and serpentine rock. Just one example from Scholar There are plenty of others. We've exaggerated and accelerated the geological processes which gradually release carbon from its locations in soil and rock strata. If we're serious about reducing CO2 in the atmosphere and oceans, we'll have to do something about speeding up the other side of the geological balancing act. Biochar, growing trees and no/low till agriculture merely redress a little of our disturbance of the daily, seasonal, biological carbon cycle of the planet's surface. To really get at the fossil material side of things, we'll have to dig up stuff to imitate the geological cycles we've interfered with by digging up (and incinerating) other stuff. Probably we'll still detour around the full-scale ice age we're due for, but we'll be back on track sooner rather than later. -
scaddenp at 11:55 AM on 21 March 2011Climate Emergency: Time to Slam on the Brakes
Icarus, your timeframes seem to be at odds with the studies by Matthews and Weaver 2010 and with Hare and Meinshausen 2006, both discussed last year at RealClimate -
Icarus at 11:45 AM on 21 March 2011Climate Emergency: Time to Slam on the Brakes
What we need to do, in order to have a chance of retaining something like the climate that modern human civilisation developed in, is to rapidly remove *all* the fossil carbon we've put into the climate system in the last 250 years. That means we need to capture some 340 billion tons of carbon and sequester it in a form in which it will be stable for thousands of years. Studies show that there has been no significant net change in carbon held in surface reservoirs (oceans, soil, atmosphere, biomass etc.) for about the last million years, and very little over the last 2 million years. This means that it will not be sufficient to just reduce or eliminate anthropogenic fossil fuel CO2 emissions, because the carbon we have released into the climate system will not be removed by geological processes on any timescale that we can imagine. Total carbon will remain at elevated levels for millions of years unless we actively remove what we are responsible for, or until slow geological processes change the balance such that there is a net reduction in carbon in surface reservoirs. Consequently, the effects of the additional carbon, including ocean acidification and an enhanced greenhouse effect, will also persist for millions of years, unless we actively reverse that by sequestering the carbon. This is why Hansen is right to say that there is now no chance of any impending ice age, as there would have been in 10,000 or 20,000 years' time in the absence of industrial civilisation. -
Riduna at 10:50 AM on 21 March 2011Zero Carbon Australia: We can do it
Let’s have a reality check here! In theory, solar concentration technology (SCT) could replace coal and other fossil fuels as the source of Australian electricity production but that has not happened, is not contemplated and is unlikely to occur. We should ask ourselves why. Electricity consumers are happy to buy their electricity needs from any source, with one important proviso - that it is the cheapest energy available. SCT simply does not produce this. In fact it is the most expensive of all renewable energy sources and can only be made competitive with coal (the cheapest energy source) if the price of coal doubles through imposition of a carbon tax. In short, SCT is not competitive with coal or any other renewable energy source and, in the absence of electricity storage capacity, wind is over-rated as a source of base load power. That is not to say that wind does not make a useful, if limited contribution to reducing dependence on coal. When solar technology becomes more efficient (it will) it will become the technology of choice to produce most of the world’s energy needs. But to think that countries now reliant on coal to generate electricity will turn to SCT is wishful thinking. Why would any country opt for a much more expensive SCT product? Try convincing the top 5 emitters (China, USA, India, Japan, Russia) responsible for >55% of global CO2 emissions, that they should replace coal with solar. Australia is uniquely placed in that it has the most extensive hottest granite at the shallowest depth found anywhere in the world. Contrary to the view expressed in the article, geothermal technology is now well developed and understood. The first commercial power house is expected to be up and running by 2015. Ref: Geodynamics Annual Report at: http://www.geodynamics.com.au/IRM/Company/ShowPage.aspx?CPID=2277&EID=11787609 Estimates vary as to the capacity of geothermal to meet all of Australia’s expanding need for base load power but what is clear is that production per MWh is the cheapest of any renewable source other than wind. It can produce reliable base load power, is emission-free and billions are being invested in it in a bid to ensure that, in the short-medium term, it reduces dependence on coal. Any contest between solar and geothermal for the supply of Australia’s electricity needs will be won by the latter on price – at present. However, there is ample scope for R&D into more efficient use of solar energy to generate electricity and this is where resources are needed. One would hope that this would result in the development of much more efficient PVC’s, and much improved methods of storing heat and electricity. Only with such developments over the next 10-20 years will solar become a real competitor with wind, wave and geothermal – and the preferred alternative by nations currently dependent on fossil fuels. -
Riduna at 10:35 AM on 21 March 2011Zero Carbon Australia: We can do it
Figure 1 in the article shows global per capita emissions budget assuming constant annual emissions. Does this budget also assume constant population and nil growth in size of national economies? -
Gilles at 10:33 AM on 21 March 2011Those who contribute the least greenhouse gases will be most impacted by climate change
"The average Chinese citizen is not nearly as rich as an average American was even two or three generations ago" you can check on gapminder that this is plainly untrue - average chinese citizens are just as rich and burn as much FF than average american around 1890. They're just a little bit late. After this date, american were richer, but they also burnt more oil and other FF. -
Gilles at 10:27 AM on 21 March 2011Those who contribute the least greenhouse gases will be most impacted by climate change
Marcus, you can find all relevant numbers on gapminder , as I already indicated you. You can conveniently select "GDP per capita" on y-axis and "CO2 emission per capita" on x-axis. And you can follow tracks throughout the century. So which country are you thinking of when you say that " You've also failed to show contrary evidence that it was the accumulated wealth of the 1st world which came *before* the rise in fossil fuel use-not because of it as you've constantly contended." ? you can also take any other index of wealth and correlate it with CO2 production. Now I don't understand what you're seeking with a "correlation between energy intensity and GDP" - this is of course quite different from a correlation between energy consumption and GDP. The fact that energy intensity correlates weakly with GDP proves exactly what I'm saying - that it has not varied a lot throughout the history, although of course it has changed. I would like to make you notice that all "correlations" between climate and anything else are also subjects to large fluctuations and are by no means "constant" in the sense you seem to demand for FF consumption. So I'm surprised that you're not so critical to evaluate the effects of CC. And if you recognize that "Anyway, at least you're correct about the amount of food waste we're currently seeing in the First World, " , do you recognize also that it doesn't prove that we could suppress entirely food without harm? - that's the same for FF. We can conserve and spare some of them - this doesn't mean we can suppress them. And furthermore, this would not lead to an overall decrease of the integrated amount (integrated over time I mean). Michael sweet#50 : I said that FF should be replaced by sources with the same applications and low cost to avoid a collapse of civilization, and that I don't know any of them- except for a limited amount of electric power, but it's not enough to do everything. Where is the contradiction with what ? -
les at 10:07 AM on 21 March 2011Sea level rise is exaggerated
110 - no I don't miss the point. You presented some new and significantly different numbers without details (the fitted functions, confidence etc.). You can't expect that to go unchallenged, surely. A challenge to which you are failing to rise. -
RickG at 09:57 AM on 21 March 20112nd law of thermodynamics contradicts greenhouse theory
710 les Thanks les, it is a challenge to respond to such foolishness and still keep one's cool enough to remain withing the comments policy. After writing a response I usually walk away for a while before submitting it. I almost always find myself toning my initial reply's down. It doesn't always work but for the most part it does. Contrary to contrarians beliefs, I do get posts deleted from time to time. With contrarians it is quite often difficult to figure out if they really don't understand the science or if they are just up to mischievous. I hope I'm wrong but I fear the latter is too often true. -
scaddenp at 09:38 AM on 21 March 2011Pre-1940 Warming Causes and Logic
"And STILL not accounting for the oceanic interdecadal variability, which is a good explanation for the 1940 blip and for part of the 2000's blip as well" What's your reference for this? Are you referring to Swanson and Tsonis 2009? -
scaddenp at 09:36 AM on 21 March 2011Pre-1940 Warming Causes and Logic
"It is methane emissions we need to stop not CO2." Both are important but neither the concentration of CH4 in the atmosphere nor the isotopic concentration of that CH4 give any evidence that methane is much of an issue at the moment. See the RC article on methane risk. Frankly, the problem at moment is CO2. -
protestant at 09:24 AM on 21 March 2011It cooled mid-century
And try comparing vs something else than GISS which is showing less cooling in mid 1900's and also less warming pre 1940. Like Hadcrut which has not been so heavily adjusted by the modelers. For example, look at the Model E outputs. Aerosols clearly do not explain the mid century cooling. GISS vs ModelE vs Hadcrut: http://i.picasion.com/pic38/0f6666b2060569d680da06c477670f9b.gif -
ranyl at 09:19 AM on 21 March 2011Zero Carbon Australia: We can do it
"CBDunkerson at 04:30 AM on 21 March, 2011 ranyl #46, keep in mind that the current CO2 level is 'artificially inflated' in the sense that it represents an overflow rather than equilibrium value. Basically, about half the CO2 we emit each year is currently being sequestered (mostly in the oceans). If we were to drop to zero emissions that sequestration would continue and the atmospheric concentration would start dropping... probably at a rate of about 2 ppm per year. Thus, even if we hit 450 ppm before zero emissions goes into effect, we would not stay at that level once emissions stopped. As to 2C vs 3-5C... the difference is between fast feedbacks and slow feedbacks. A doubling of CO2 (about 560 ppm) will likely cause about 3C warming from fast feedbacks (i.e. within a few decades), but more likely around 6C when slow feedbacks (i.e. within a couple of centuries) are considered. However, both of those would require that the atmospheric CO2 level remain elevated... which it would not if our emissions drop significantly below the rate at which atmospheric CO2 can be sequestered." Yet others have found on the subject of the removal of CO2 from the atmosphere that, “not only does anthropogenic CO2 in the atmosphere need to be removed, but anthropogenic CO2 stored in the ocean and land needs to be removed as well....meaning an additional amount of CO2 equal to the original CO2 captured would need to be removed” Long Cao and Ken Caldeira Env. Res. Lett, 5 (2010) 024011 (6pp) http://iopscience.iop.org/1748-9326/5/2/024011?fromSearchPage=true Dunford (Science May 2007), showed southern Ocean sink now releasing CO2. (Park Geo.Res.Lett. 2008), showed 50% Reduction of sink of coast of Japan, (Schuster Oct 2007 J. of Geo. Res), Ocean sink 50% reduced N.Atlantic. Lowe (Env.Res.Let 2009,http://iopscience.iop.org/1748-9326/4/1/014012?fromSearchPage=true) , seems to suggest that CO2 levels even with adrupt stops take a long time to come and at a slow rate,"HadCM3LC simulates very low rates of decline in atmospheric CO2 concentration. Mean (regressed) rates of change for the following hundred years are predicted as –0.2 ppm y–1, –0.4 ppm y–1 and –0.75 ppm y–1," an order of magnitude lower that the 2ppm a year rate suggested, and not taking into account the release of CO2 from a warming atmosphere due to permafrost melt, the general relationship that a warming trend causes a release of CO2 nor CO2e which is already at 460ppm, so really getting to 350ppm is a lot of carbon removal. Do realise that the 3-5C is the long term equilibrium sensitivity equivalent and that in 100years you get about 60% of the full equilibrium level temperature change. That suggests that if the Pliocene CO2 levels were ~350ppm, then the earth should heat up 60% of the way to 3-5C by 2100, so 1.8-2.4C, if CO2 levels were ~400ppm in the Pliocene then the earth should rise at least 1C to 1.78ppm at 350ppm but 1.8-2.4C at 400ppm. There is enough uncertainity in this paleoclimatological records to create an endless debate, however considering the ever growing evidence for a higher CS than 3C and the risks involved of too much CO2 maybe 350ppm asap induced by a massive CO2 withdrawn due to man's activties is a pragmatic approach. What carbon peak is safe? (considering that unless CO2 is actively withdrawn it will stay at that level for a long time and CO2e levels) 400ppm means removing 50ppm and more from the atmosphere to get to 350ppm. That is a considerable amount of carbon so is there potential for bioshpere enhancement to draw down that much CO2? If 400ppm is a peak that leaves a very tight budget to replace a whole enery, transport, farming, health, economic and building systems (which are all fossil dependent) to being fossil independent and CO2 sequestering and there are also adaptation needs and the ever increasing population demands. Is such a large challenge of human adaptive ingenuity even worth considering? How quickly can human activity become carbon negative and biosphere enhancing with a best effort from all concerned parties? -
protestant at 09:19 AM on 21 March 2011Pre-1940 Warming Causes and Logic
And STILL not accounting for the oceanic interdecadal variability, which is a good explanation for the 1940 blip and for part of the 2000's blip as well and this is what the current climate models are not accounting for. The models you cite do not reproduce this blip, and it definitely is a problem. It is NOT just about external forcing You should already be aware of that. Also, using linear relationships for temperature changes (delta T = lambda x delta F) is a gross oversimplification because we KNOW climate is nonlinear (and so are feedbacks). Just because the models do reproduce the last 30 years with the supposed sensitivity combined with human factors doesn't mean they would "know" what actually has happened.
-
Daniel Bailey at 09:06 AM on 21 March 2011Most of the last 10,000 years were warmer
Chris: Not all interglacials are created equal. Looking at the past 10,000 years showed an overall decline in temperature until the age of industrialization, when the decline halted and temperatures began their climb
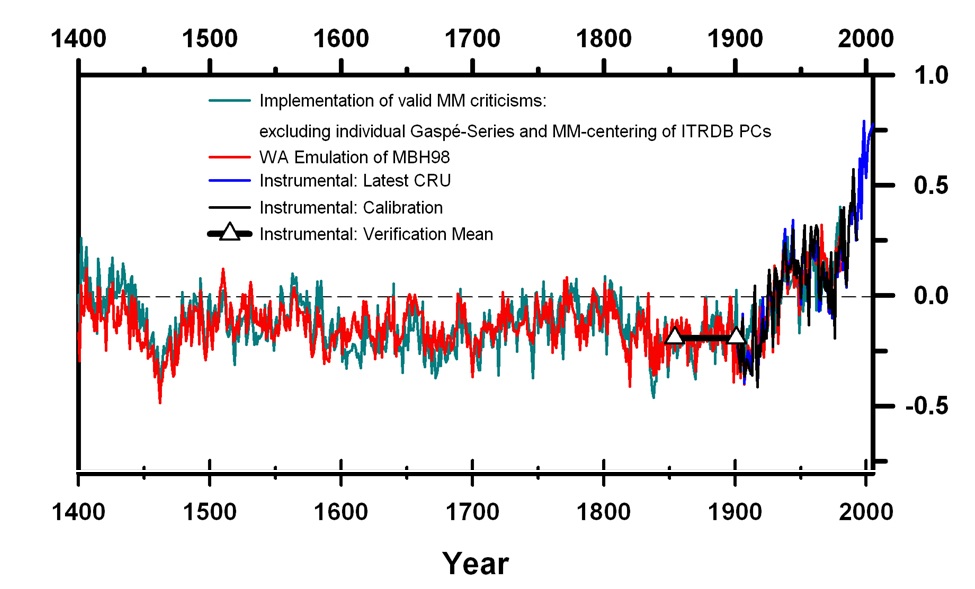
 We have now equaled the highest temperatures of this interglacial (the period known as the Holocene Maximum or the Holocene Altithermal), with yet more warming in the pipeline; even if CO2 emissions are held to zero for the next 40 years, we're still going to be on the receiving end of another 0.6°C warming.
The Yooper
We have now equaled the highest temperatures of this interglacial (the period known as the Holocene Maximum or the Holocene Altithermal), with yet more warming in the pipeline; even if CO2 emissions are held to zero for the next 40 years, we're still going to be on the receiving end of another 0.6°C warming.
The Yooper
-
andthorne at 09:06 AM on 21 March 2011Pre-1940 Warming Causes and Logic
Wrong Reindeer. In 1941, just below the Arctic circle in Canada the temperatures reached the level of a Palm Springs summer, 101 degrees, if I remember correctly and that summer temperatures which normal average 50 degrees were way higher, 70 degrees if I recall correctly. I am away from my research at the moment. The cause, I say, was a methane hydrate explotion below in the Arctic area that leaked the great heat the hydrates contain out of an Arctic pingo during the summer. They began drilling in the Arctic at Norman Wells in 1921; they began extensive water flooding in the late thirties while gearing up for WW II. Fresh water makes methane hydrate. It is methane emmissions we need to stop not CO 2. Andrea Silverthorne -
scaddenp at 08:58 AM on 21 March 2011Sea level rise is exaggerated
For a disastrous multi-meter sea level rise you'd need acceleration but you simply don't have it. What we would EXPECT is surely what models predict. Looking at say Vermeer 2009 I dont think we do expect to much acceleration yet. 2050 will be different. -
Berényi Péter at 08:31 AM on 21 March 2011One of the best climate change ads I've seen
#32 les at 08:15 AM on 21 March, 2011 I'm really curious. Here you go. -
Berényi Péter at 08:28 AM on 21 March 2011Sea level rise is exaggerated
#30 under One of the best climate change ads I've seen les at 07:47 AM on 21 March, 2011 I wasn't sure because the first data points on both are not the same as yours... That's because folks at University of Colorado at Boulders for some obscure reason have omitted the first three data points at the end of 1992 from the graphs, although it's included in the text files. If you give the comparative fit qualities, we can all judge whether a linear fit is not appropriate compared to your function... You miss the point. A linear fit is insufficient to raise alarm, it only implies a 27 cm rise by 2100 which is entirely manageable. For a disastrous multi-meter sea level rise you'd need acceleration but you simply don't have it. -
damorbel at 08:20 AM on 21 March 20112nd law of thermodynamics contradicts greenhouse theory
Re #612 Tom Curtis you wrote:- "3) The molecules in a gas do need to have significant kinetic energy to stay aloft. That is the energy of motion that they have because of the temperature of the gas. If the gas cools" You are so close to an important fact about atmospheres in general. You write "if tha gas cools" - as a molecule rises in the atmosphere it loses kinetic energy(KE) to gravitational potential energy (GPE). But the KE of a gas (well, degree of freedom, DOF; actually) is its temperature, so when it loses KE to GPE it must cool. This is so important because it establishes the basic lapse rate of 6.5C/km(altitude). -
cjshaker at 08:18 AM on 21 March 2011Most of the last 10,000 years were warmer
The temperature proxy record extracted from the Vostok ice cores appears to show the same thing, a peak about 10,000 year ago, and a gradual cooling trend since then. Look at the right side of this graph. The furthest right sawtooth is our current interglacial. It shows a temperature spike, then appears to show a gradual temperature decline. It also shows that this interglacial is colder than all of the previous interglacials over the past 420,000 years http://www.skepticalscience.com/argument.php?p=1&t=235&&a=53 Chris Shaker -
les at 08:16 AM on 21 March 2011One of the best climate change ads I've seen
I mean 17... -
les at 08:15 AM on 21 March 2011One of the best climate change ads I've seen
12 Berényi - please do repost 12 + the required analysis details in the sea rise post. I'm really curious. http://www.skepticalscience.com/sea-level-rise-intermediate.htm -
les at 07:47 AM on 21 March 2011One of the best climate change ads I've seen
29 Berényi Fine, I wasn't sure because the first data points on both are not the same as yours... still, both have a similar rate and precision... so my questions hold. What the huge discrepancy in rate? What do you mean by "very high confidence" for your decceleration? which you seem to be able to include with high precision and, I suppose, confidence. If you give the comparative fit qualities, we can all judge whether a linear fit is not appropriate compared to your function...
Moderator Response:[DB] OK, this has gone on quite enough. Anyone wishing to continue discussing sea level rise can carry this conversation over to the http://www.skepticalscience.com/sea-level-rise-intermediate.htm or similar thread of their choice. In a little bit I'm going to start removing all off-topic comments from this thread. Thanks!
-
Berényi Péter at 07:35 AM on 21 March 2011One of the best climate change ads I've seen
#27 les at 07:20 AM on 21 March, 2011 I'm still curious about your fit It is actually this one (Inverted barometer applied, Seasonal signal included). You can download numeric data from here. A linear fit is clearly not appropriate. But at least one can exclude any acceleration with very high confidence. Which contradicts Hansen's claim ("a disastrous multi-meter sea level rise on the century timescale").
-
les at 07:32 AM on 21 March 20112nd law of thermodynamics contradicts greenhouse theory
707 RickG. I completely share your sentiments - although I hope not sufficiently as to violate the comments policy ;) There's been a lot of words attacking GHE... but no physics that I can discern. I'd suggest that those who feel there's a flaw in the GHE argument construct a clear, physics based, derivation - or find a flaw in explanations such as SoDs - until which time, IMHO, it's probably best to give it a rest. -
Paul D at 07:32 AM on 21 March 2011Zero Carbon Australia: We can do it
Interesting new development in vanadium redox flow batteries: http://www.sciencedaily.com/releases/2011/03/110317141418.htm -
les at 07:29 AM on 21 March 2011One of the best climate change ads I've seen
Moderators - and before you say it - I know, I know... should be in How much will sea levels rise in the 21st Century? -
RW1 at 07:26 AM on 21 March 20112nd law of thermodynamics contradicts greenhouse theory
Rick G, "Both of you take a perfectly legitimate and superbly illustrated schematic showing 'Earth's Global Energy Budget' and purposely misrepresent it out of context, completely ignoring the paper that describes it in detail." I've read the Trenberth 2009 paper, and yes, it misrepresents the most crucial aspect of the entire GHE. That is how much of the emitted surface radiation is from 'back radiation' from the atmosphere and how much is passing through unabsorbed and going straight out to space. The paper and diagram makes it look like of the 396 W/m^2 emitted at the surface, 333 W/m^2 of it is coming back from the atmosphere. This is incorrect. Using Trenberth's numbers, only 157 W/m^2 of surface emitted radiation is from 'back radiation'. The diagram also obscures what percentage of the surface emitted radiation absorbed and re-emitted by the atmosphere is downward emitted and what percentage is upwards emitted out to space. Using his numbers, 157 W/m^2 is downward emitted toward the surface and 169 W/m^2 is upward emitted, with 40 W/m^2 passing through the clear sky atmosphere and 30 W/m^2 passing through the cloudy sky atmosphere. The total transmittance of 70 W/m^2 is not referenced in the paper and seems to only be a rough estimate or guess. -
damorbel at 07:22 AM on 21 March 20112nd law of thermodynamics contradicts greenhouse theory
Re #705 RickG you wrote: "Your basic misconception concerning Trenberth's schematic appears to be about what the schematic is not about. It is not depicting the Stefan–Boltzmann Law and black body radiation." I suggest that you examine the document as closely as I have. All the power figures (W/m^2) e.g. 'Surface Radiation 390W/m^2' and 'Back Radiation 333W/m^2' appear to be derived by applying Stefan's formula (with an emissivity =1) to an estimate of the local temperature. Trenberth mentions 'real' temperatures (°C or K) only seven times and then only to explain how the figures were manipulated to make them more acceptable (see box on p315) The box also contains this unused information:- "The surface emissivity is not unity, except perhaps in snow and ice regions" which beggars belief. Snow certainly has a very low emissivity (and the corresponding low absorptivity) because that is why it takes a long time to melt as ground cover. It is only when the (absorptive) dark earth underneath begins to appear that radiation has a real effect melting the snow. You wrote further:- "The schematic is based on actual instrumental data showing how energy is distributed globally." I don't think you are right here. The only measurements that Trenberth uses are satellite measurments that even he admits are unreliable (because of instrument failure) and disagree violently e.g. compare the 'Solar reflected' (p316) for KT97(Trenberth) at 107W/m^2 and JRA(Japanese re-analysis) at 95.2W/m^2. Trenberth then goes on to use the difference of these measurements to calculate the extra heating due to radiation and the figure vary from positive to negative, depending on who is doing the measurements. Of course it isn't as simple as that; no, many of the figures used have all been re-analysed (aka - they didn't meet requirements) e.g. JRA aka Japanese re-analysis; NRA aka NCEP–NCAR re-analysis and ERA-40 aka 40-yr ECWMF Re-Analysis (p316). This kind of stuff reminds me strongly of [- snip -]Moderator Response: [muoncounter] Edited due to political accusations in violation of Comments Policy. -
les at 07:20 AM on 21 March 2011One of the best climate change ads I've seen
12 Berényi I'm still curious about your fit. You link to http://sealevel.colorado.edu/results.php I guess this data? who show a rate of 3.1 ± 0.4 mm/ year, rather than your 18.8 cm / century 1.88 mm/year ... Why the discrepancy of 1.6? and how did you manage to get that extra significant figure of precision?!?!
Their rate is from a straight line fit. what function have you used?
who show a rate of 3.1 ± 0.4 mm/ year, rather than your 18.8 cm / century 1.88 mm/year ... Why the discrepancy of 1.6? and how did you manage to get that extra significant figure of precision?!?!
Their rate is from a straight line fit. what function have you used?
-
Henry justice at 07:15 AM on 21 March 2011Visual depictions of Sea Level Rise
The IPCC AR4 report projects a sea level rise for this century of 18-59 cm. While the edges of both Greenland's and Antarctica's ice caps have obviously melted a bit, this should balance out by the predicted increase in snow in the greater interior for both icecaps. It will take thousands of years of continuous warming for both of them to melt even at the present rate of emissions of CO2. By the way, these emissions are projected to peak by 2100 and then decline. There is no near term threat of unprecedented sea level rise.
Moderator Response:[DB] Umm, not so much. Greenland has been losing ice overall, with the rate of loss increasing each year:

With Antarctica losing ice in a similar fashion:

No one is saying that these great ice sheets will disappear overnight. But the negative effects on sea levels will become apparent far before then, causing great distress to coastal populations throughout the world.
"By the way, these emissions are projected to peak by 2100 and then decline."
Got a source for that? Because as it now stands, with no firm limits on global GHG emissions in sight it has about a snowflakes chance in...
-
Rob Painting at 07:11 AM on 21 March 2011One of the best climate change ads I've seen
The distance is some four thousand kilometers and Greenland is losing ice in recent years at an annual rate of not more than 0.01%. It is negligible So you haven't bothered to do the math, or are unable to?. I'm not really interested in your opinion that it's negligible BP, I'd like to see if you have actually addressed this issue. If you don't know how to account for the effect, just say so. -
Berényi Péter at 07:00 AM on 21 March 2011One of the best climate change ads I've seen
#23 Rob Painting at 06:03 AM on 21 March, 2011 Have you calculated this?. Is it negligible for New York? Come on, get real. The distance is some four thousand kilometers and Greenland is losing ice in recent years at an annual rate of not more than 0.01%. It is negligible. BTW, anyone can visit the PSMSL (Permanent Service for Mean Sea Level) site. You are free to cherry pick a station which shows considerable acceleration during the last several decades provided it- does not sit on the side of a volcano
- there is no major tectonic fault line there
- it is not swampland
-
RickG at 06:46 AM on 21 March 20112nd law of thermodynamics contradicts greenhouse theory
RW1 & damorbel, Well guys, there is no doubt that neither of you are the slightest bit interested in discussing any science with the intent of sharing information and understanding. Both of you take a perfectly legitimate and superbly illustrated schematic showing 'Earth's Global Energy Budget' and purposely misrepresent it out of context, completely ignoring the paper that describes it in detail. If you are still troubled with Trenberth's schematic and paper, I suggest you contact him personally. His email address, fax and phone number are listed prominently the NCAR site to which I have previously linked. As for me, I am through with your hand waving and obfuscation. -
Paul D at 06:15 AM on 21 March 2011Zero Carbon Australia: We can do it
idunno@49 It is common practice now to work out life cycle emissions as grammes of CO2 per kilowatt hour. These figures include materials used, manufacture, installation and decommissioning. Whether a fan or not, the world nuclear association has compiled quite a good list of research papers that analyse the CO2 footprints of different energy sources: http://www.world-nuclear.org/info/inf11.html Regarding wind turbines. The pad is largely concrete and then the tower is prefab steel bolted to it. On top of that is the nacelle/generator and blades. Tidal turbine farms are probably about 10 years behind wind in development, so the first small scale installations are just being planned/constructed. A 10 turbine farm has been approved this week in Scotland: http://www.independent.co.uk/environment/green-living/tides-to-power-whisky-distilleries-2245207.html -
les at 06:10 AM on 21 March 2011One of the best climate change ads I've seen
To validate this "decelerations" one would need to know the function fitted, the R^2, and the equivalent for a Log function and a straight line, at least. -
Rob Painting at 06:03 AM on 21 March 2011One of the best climate change ads I've seen
BP - Now, in New York rate of sea level rise is decelerating steadily during the last 85 years at about 0.3 m/cy2. During the last twenty years this deceleration, if anything, is more pronounced, not less so. Much of the contribution to sea level rise is now coming from the Greenland ice sheet. This would be expected to cause a reduction in sea level rise in areas adjacent to Greenland, and perhaps have an effect on SLR at New York, as the local gravitational attraction diminished. Have you calculated this?. Is it negligible for New York?.

Prev 1852 1853 1854 1855 1856 1857 1858 1859 1860 1861 1862 1863 1864 1865 1866 1867 Next


