


 Arguments


Recent Comments
Prev 1918 1919 1920 1921 1922 1923 1924 1925 1926 1927 1928 1929 1930 1931 1932 1933 Next
Comments 96251 to 96300:
-
Chemist1 at 14:21 PM on 23 February 2011Hockey Stick Own Goal
Once again fellow posters in general, I did my homework, and see that the data is not so factual or well evidenced...Moderator Response: [muoncounter] I'm sorry, I have no idea what this comment means. Homework? Data? Evidence? -
Tom Curtis at 14:18 PM on 23 February 2011Hockey Stick Own Goal
HR 23, of course the 0.3 degree difference in variation between MBH and Moberg, and the 0.4 degree difference between MBH and Lundqvist is important. That is why climate scientists have not rested on their laurels and continue to refine the reconstructions. What is puzzling is why deniers cannot recognize that the 0.5 difference between IPCC 1990 and Lundqvist. (Note, the variation of Lundqvist compared to MBH, IPCC 1990 and Moberg 2005 is greatly exagerated because of the higher resolution smoothing used.) -
muoncounter at 14:15 PM on 23 February 2011Hockey Stick Own Goal
Albatross, "Why do some people insist on being stuck in circa 2000? " Surely you know the answer to that: It's when warming stopped. -
scaddenp at 14:12 PM on 23 February 2011Hockey Stick Own Goal
"Mann 1998 is junk science" - Mann 1998 was first attempt - it would be better to describe it as superceded science. I would refer to "junk" as papers with serious logical flaws or methodologies that would be inappropriate for the time of publication. -
HumanityRules at 14:12 PM on 23 February 2011Hockey Stick Own Goal
22 muoncounter No science, no comment. -
Marcus at 14:09 PM on 23 February 2011Hockey Stick Own Goal
"Great Mann 1998 is junk science, that's good to know. Mann 2003 also" No-so typical of a denialist to misrepresent the facts. Mann 98 was just plain science. You seem to not understand that paleo-climatology was still in its relative infancy when Mann started this work. Science is rarely letter perfect first time round (if ever), it usually needs an iteration or two (or even 3) to get it completely right. In this case, Mann relied too heavily on a single proxy to obtain his reconstructions-getting a *slightly* flatter temperature graph than what's been obtained in subsequent reconstructions. Given that Mann 2003 is much closer to the more than half a dozen reconstructions that currently exist suggests that he took the criticisms on board & extended his range of proxies the next time around. The point is that no matter what reconstruction you look at, the extent & rate of warming is *nothing* like what we've seen in the last 50 years-no matter what you & your denialist mates say. Yet instead of dealing with this uncomfortable fact, you'd rather create straw-men arguments that reveal a great deal more about your own ignorance of scientific processes than about the science itself. -
muoncounter at 14:09 PM on 23 February 2011Meet The Denominator
PT, My reply was in reaction to Alex's comment here. You are free to read either Alex's statement or my reply in whatever manner you choose; subject, of course to the conventions of normal English usage. -
Albatross at 14:08 PM on 23 February 2011Hockey Stick Own Goal
Are the "skeptics" trying to see how many own goals they can score on this thread? Truly unbelievable. HR, continues to miss the point and argue strawmen. It seems that he has not read the main post which has this quote from the Ljungqvist (2010): "Our temperature reconstruction agrees well with the reconstructions by Moberg et al. (2005) and Mann et al. (2008) with regard to the amplitude of the variability as well as the timing of warm and cold periods, except for the period c. AD 300–800, despite significant differences in both data coverage and methodology.” And "skeptics" love the Ljungqvist reconstruction. How very inconvenient for them that it agrees well with Moberg and Mann, and shows that current N. Hemisphere land temps are warmer than those observe during the MWP. Come on, Marcus never said that MBH98 was "junk science", neither did the NAS panel--now HR is grossly distorting and misrepresenting the facts. And Hegerl and Knutti (2008) is the most recent meta analysis of estimates of climate sensitivity. Why do some people insist on being stuck in circa 2000? -
scaddenp at 14:04 PM on 23 February 2011Hockey Stick Own Goal
Excellent points muoncounter. I've learnt that no point in debating within anyone where their position is such that they can imagine no data that would change their mind. Do philc and chemist1 fit this? Perhaps we should ask. -
Tom Curtis at 14:01 PM on 23 February 2011Hockey Stick Own Goal
HR @18, the real question here is why are you ignoring the push by deniers to retain an obsolete reconstruction based on a single temperature series in central England, plus (for the early periods) the estimates of one researcher? The preference for this obsolete graph is clearly stated by McKitrick, for example in "What is the 'Hockey Stick'debate about?" (April 2005), in which he reproduces that obsolete graph as Figure 3. If you missed that date, McKitrick was still pushing that obsolete graph two months after the publication of Moberg 2005. In view of that, it is disingenuous for deniers to now claim Moberg as confirmation of MacIntyre and McKitrick's views, rather than of Mann's. To make this plain, consider this graph of Mann, Bradley and Hughes 99 (blue), Moberg et al 2005 (black), and IPCC 1990 (McKitrick's preferred obsolete graph, in red).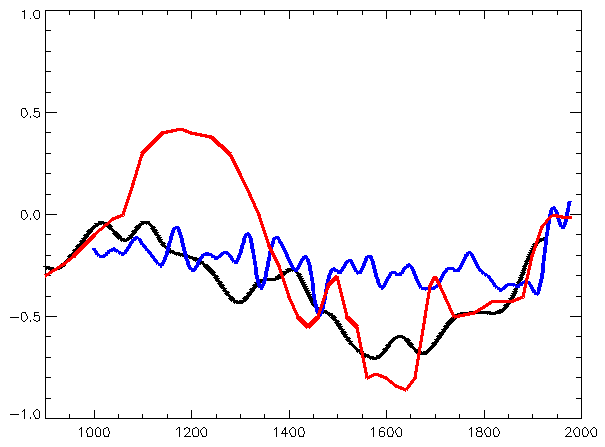 It is very clear that Moberg 2005 matches much better with MBH 99 than with IPCC 1990, particularly during the MWP. MBH 99 clearly understates the LIA, although the extent to which they do may be exaggerated in this graph in that Moberg 2005 shows a much cooler LIA than most modern reconstructions.
So, it is clear that MBH 99 (and 98) are a major advance over IPCC 1990. Since then statistical techniques in reconstructions have improved so that there are several reconstructions that give better results than MBH 99, and are consequently preferred. Stuck in a time warp, deniers are still using IPCC 1990 and attacking MBH 98 as if that somehow undermines modern reconstructions.
As to M&M's particular criticisms of MBH 98, many of them are simply wrong, and the rest much over exaggerated in their effect on the reconstruction. I do not think it is good science to be merely political attack dogs trying to pick up any flaws on papers whose conclusions you dislike while giving a free pass to papers whose conclusions you do like. The complete hypocrisy of M&M is shown by the complete pass they give to IPCC 1990 compared to the fine tooth comb they run through MBH 98.
It is very clear that Moberg 2005 matches much better with MBH 99 than with IPCC 1990, particularly during the MWP. MBH 99 clearly understates the LIA, although the extent to which they do may be exaggerated in this graph in that Moberg 2005 shows a much cooler LIA than most modern reconstructions.
So, it is clear that MBH 99 (and 98) are a major advance over IPCC 1990. Since then statistical techniques in reconstructions have improved so that there are several reconstructions that give better results than MBH 99, and are consequently preferred. Stuck in a time warp, deniers are still using IPCC 1990 and attacking MBH 98 as if that somehow undermines modern reconstructions.
As to M&M's particular criticisms of MBH 98, many of them are simply wrong, and the rest much over exaggerated in their effect on the reconstruction. I do not think it is good science to be merely political attack dogs trying to pick up any flaws on papers whose conclusions you dislike while giving a free pass to papers whose conclusions you do like. The complete hypocrisy of M&M is shown by the complete pass they give to IPCC 1990 compared to the fine tooth comb they run through MBH 98.
-
HumanityRules at 13:58 PM on 23 February 2011Hockey Stick Own Goal
21 Andy S Thanks Andy for that graph. I guess the big problem is 0.4oC or so extra variability seen in the blue curve than the red curve from 1000-1500. If as you suggest this level of difference in temp is not worth arguing over than why are we getting so excited by what's happening present day? 19 Marcus Great Mann 1998 is junk science, that's good to know. Mann 2003 also? And why is this important? Well from a glance at Hegerl 2000 (which should be Hegerl et al 2006 I think Dana) it looks like his results are being influenced by these early incorrect reconstructions. -
muoncounter at 13:58 PM on 23 February 2011Meet The Denominator
Alex, Nicely put, sir. You have a way with words that serves as an excellent example. Unfortunately, a conversation requires two to meaningfully engage -- and often sinks to the lowest common denominator. -
muoncounter at 13:50 PM on 23 February 2011Hockey Stick Own Goal
Let's take a step back here for a minute. We have philc rejecting Moberg, Ljungqvist and GISSTemp here, with Chemist doing the same here. HR, of course, misses the point entirely, choosing to focus on the old hockey stick (an outdated MWP graph) rather than the business end of the hockey stick (most goals are scored when the puck leaves the blade, not the shaft). Are these folks actually saying that not only is there no way to form any reconstruction of past temperatures, but even current temperature measurements are suspect? Does anyone really believe that we do not even know enough to measure temperature? Or how temperature variation impacts things like tree ring growth and other proxies? That there is no valid science behind any of these reconstructions? If so, all such measures are invalid -- and how can they now insist that 'it warmed before' or 'it's not warming rapidly now'? This is denial plain and simple: Denialism is choosing to deny reality as a way to avoid an uncomfortable truth: "[it] is the refusal to accept an empirically verifiable reality. It is an essentially irrational action that withholds validation of a historical experience or event". It is thus entirely useless to debate theoretical models and details of radiative physics (in a separate thread, Chemist injects the old it-violates-thermodynamics-canard and seeks to resurrect the discarded 'iris effect'). To validate theory, we must have some shared sense of reality. -
Andy Skuce at 13:42 PM on 23 February 2011Hockey Stick Own Goal
For the benefit of Humanity, I roughly digitized both the Mann 98 curve that he provided in comment #18 and the green curve in Dana's Figure 1 and replotted them at the same scale. The two curves differ for the period 1600-1700 and at the very beginning of Mann's curve. Was that the big problem highlighted by ClimateAudit?
-
Bibliovermis at 13:31 PM on 23 February 2011Radiative forcing by aerosol used as a wild card: NIPCC vs Lindzen
chemist1 (#51), Laws of ThermodynamicsThe third law of thermodynamics states that if all the thermal motion of molecules (kinetic energy) could be removed, a state called absolute zero would occur.
What relevance does a entropy-less state known as absolute zero have to temperature reconstructions, much less radiative forcing by aerosols? -
boba10960 at 13:04 PM on 23 February 2011Hockey Stick Own Goal
HR@18 I don't understand the problem you are referring to. Figure 1 covers a period twice as long as the original Mann 98 record, so it's not surprising that the figures look different from one another. If you compare results from the same time interval, beginning in 1000, then the results in Figure 1 seem to be very similar to those from Mann. What am I missing? -
Marcus at 12:56 PM on 23 February 2011Hockey Stick Own Goal
Ah HR, I see you Denialists are still dwelling in 1998. Guess what, those of us who live in 2011 know that Mann was already held to account by no lesser body than the National Academy of Sciences. There, he accepted his error & went back & corrected his original work & re-submitted it for publication. There are about half a dozen other climate reconstructions that agree with the revised Mann reconstruction &-guess what-they all come out with peaks *cooler* than the current 30-year period. All of this is a typical denialist straw-man. Errors can be made in *all* branches of science-even climatology-but there are already processes in place to correct them. We certainly don't need the Denialists pushing the issue just to advance their own agenda. -
HumanityRules at 12:17 PM on 23 February 2011Hockey Stick Own Goal
Dana1981, Here's something that I don't get. Fig1 doesn't look like a hockey stick, maybe a broken hockey stick. What looks like a hockey stick is Mann et al 1998 (you can also see from table 2 in the Ljungqvist PDF that Mann 2003 also fails to capture this variability)
 So can we just nail this. The reconstructions that were so critically used by the IPCC are these earlier Mann reconstructions and if you are now accepting Fig1 as the correct reconstructions then it looks like the critics were right to highlight this problem. So would you be supportive of ClimateAudits attempts to highlight this problem early on?
-
scaddenp at 12:15 PM on 23 February 2011Climate sensitivity is low
RW1 - you are asking for documentation of what is implicit in the equations. Lets see if I can attempt it. At heart of equations, you consider a small slice of atmosphere. It has radiation from in from below, (from surface and lower layers) and from above (from upper layers in atmosphere). The equations capture absorption, transmission, emission (in ALL directions - which of course is the inputs to layers above and below) for a given gas composition, P,T. The integral of all the layers is what then allows you to calculate what comes out of the top. All the interaction is captured. You know it correct because the model results agree with empirical measurement. Science of doom explains the textbook. -
Tom Curtis at 11:46 AM on 23 February 2011Hockey Stick Own Goal
philc @13, it is true that Moberg only shows an anomaly of just over 0 degrees C for the most recent date in the 20th Century, but that date is 1979, not 2000 as you assert: As you do not like GISStemp, I consulted HadCRUT3:
 That shows approximately a 0.27 degree rise from 1979 to 2008 in global mean temperature, which as you know was anomalously cold for the 21st century. A better comparison is with Northern Hemisphere temperatures, which Moberg et al reconstructed. HadCRUt3nh shows nearly 0.5 degrees increase over 1976 for 2008, again an anomalously cold year.
For comparison, the MWP in Moberg et al averages around 1970 temperatures or lower, although just four years (1016, 1017, 1105 and 1106) rise to near 2008 levels, with the highest (1105 at 0.3717) being 0.43 degrees warmer than 1979, and hence cooler than the, cool for the 21st century, 2008 in the NH.
In this case, it is you who are trying to hide things on the spaghetti graph.
With regard to GISS temperatures, you are again wrong. First, deniers often claim that the GISS reconstruction of temperatures in the arctic circle are based on only a very few stations because only a very few such stations lie within the arctic circle itself. This deliberately - deceitfully - ignores the significant number of stations lying just outside the arctic circle but well within the range of the arctic circle for GISS's temperature reconstruction.
However, evidence does suggest that there is a problem with the GISS temperature reconstruction. Comparison with the DMI arctic temperature reconstruction shows that the use of stations outside the arctic circle to help reconstruct temperatures within in it has resulted in GISStemp underestimating the warming trend in the arctic by about 0.2 degrees per decade.
That shows approximately a 0.27 degree rise from 1979 to 2008 in global mean temperature, which as you know was anomalously cold for the 21st century. A better comparison is with Northern Hemisphere temperatures, which Moberg et al reconstructed. HadCRUt3nh shows nearly 0.5 degrees increase over 1976 for 2008, again an anomalously cold year.
For comparison, the MWP in Moberg et al averages around 1970 temperatures or lower, although just four years (1016, 1017, 1105 and 1106) rise to near 2008 levels, with the highest (1105 at 0.3717) being 0.43 degrees warmer than 1979, and hence cooler than the, cool for the 21st century, 2008 in the NH.
In this case, it is you who are trying to hide things on the spaghetti graph.
With regard to GISS temperatures, you are again wrong. First, deniers often claim that the GISS reconstruction of temperatures in the arctic circle are based on only a very few stations because only a very few such stations lie within the arctic circle itself. This deliberately - deceitfully - ignores the significant number of stations lying just outside the arctic circle but well within the range of the arctic circle for GISS's temperature reconstruction.
However, evidence does suggest that there is a problem with the GISS temperature reconstruction. Comparison with the DMI arctic temperature reconstruction shows that the use of stations outside the arctic circle to help reconstruct temperatures within in it has resulted in GISStemp underestimating the warming trend in the arctic by about 0.2 degrees per decade.
-
Marcus at 11:32 AM on 23 February 2011Hockey Stick Own Goal
Ah yes, Phil C, the old "GISS is unreliable schtick". For the record, GISS uses far more weather stations to compile it's data than HadCru does-especially around the Arctic regions-& so HadCru is getting a slightly shallower warming trend than RSS (Satellite) & GISS (ground-based). In truth, though, its the UAH trend that is the "odd-one-out", because of a failure to account for Diurnal Drift in the calculation of temperatures. -
Albatross at 11:11 AM on 23 February 2011Hockey Stick Own Goal
philc @13, "The only surprising data in the set is the GISS record and the question is why it suddenly departs from the other temperatures post 2000." The data do not support that assertion-- take your pick, the differences (especially in recent decades) are not significant. On a separate note, why on earth would you want to exclude the marked warming over the Arctic? Ignoring polar amplification won't make it go away.
-
Tom Curtis at 10:42 AM on 23 February 2011Hockey Stick Own Goal
Chemist1 @3 & Bart Verheggen @4, Climate sensitivity is normally treated as being the same for all forcings. Obviously that is only an approximation. Because different forcings have different patterns of geographical and temporal effects, logically they will also have slight differences in feed backs. As one example of this, an increased concentration of CO2 will preferentially warm high latitudes relative to low latitudes. The obvious consequence of this is that CO2 forcing will result in a stronger ice albedo feedback for a given level of mean global temperature rise. In like manner, increased insolation preferentially warms the tropics. As a result they should have a stronger water vapour feed back and upper tropospheric hot spot than would be expected for a positive CO2 forcing. However, this difference in feedbacks is likely to make only a small difference to climate sensitivity, so that equal climate sensitivity for all forcings is a valid approximation. Indeed, General Circulation Models do not even make that approximation. Because they determine the effects of forcings cell by cell, the diferential effects of warming on feedbacks at different locations and altitudes is already incorporated into their design. That the output of GCMs is so consistent with approximately equal feedback is very strong support for the intuitive hypothesis of near equality of sensitivity for all feedbacks. And to avoid the strawman, I said "strong support", not "evidence". The outputs of GCMs are just probabilistic predictions based on well known physical laws. Unless a major error in those predictions can be shown (ie, that predictions of all GCMs are artifacts rather than consequences of the laws they encode), then it is the very strong empirical support of of those physical laws that supports the near equality of sensitivities. (I apologize for the "lecturing tone", it is an unfortunate consequence of writing for both clarity and accuracy. I am not setting myself up as an authority.) -
Alex Poole at 10:37 AM on 23 February 2011Meet The Denominator
muoncounter - You ask me about credibility - Well, the first part of Poptech's reply to me certainly changed my mind about him - I don't think he's much of politician, as no politician trying to convince you of an argument would make such crass comments. To declare someone's personal impression as 'incorrect' is not only breathtakingly arrogant and insulting, but also logically impossible - In the context of my original remark, it could only be incorrect if it's not what I really felt (and only I can know that!). Instead, he's condemmed himself to saving face to the point of absurdity. In my personal impression, he has been demoted from politician to logic troll, and for that, he only has himself to blame. -
philc at 10:32 AM on 23 February 2011Hockey Stick Own Goal
Just what we need, another ill-constructed hocky stick. Since the Ljundqvist paper used the Cru-tem and Had-crut data for recent temperatures that should be shown, not GISS. The GISS temperatures have established that they are high compared to other estimates, apparently because they use a few limited polar measurements to "fill in" data for the arctic circle. You'll note that Moberg etal. and Ljungqvist both show the yr2000 temps at a O-.2 deg. anomaly. The spaghetti graph is good at hiding things. The only surprising data in the set is the GISS record and the question is why it suddenly departs from the other temperatures post 2000. -
Albatross at 09:57 AM on 23 February 2011Radiative forcing by aerosol used as a wild card: NIPCC vs Lindzen
Can all comments about the HS be deleted please and reposted on the appropriate thread? Including this one, but i just wanted people to see this image from the 2007 IPCC Assessment.
-
Albatross at 09:53 AM on 23 February 2011Radiative forcing by aerosol used as a wild card: NIPCC vs Lindzen
Dr. Verheggen, Do you have any thoughts on this paper by Knutti (2008) titled "Why are climate models reproducing the observed global surface warming so well? Knutti talks about aerosols quite a bit.... -
Albatross at 09:51 AM on 23 February 2011Radiative forcing by aerosol used as a wild card: NIPCC vs Lindzen
Chemist, "No problem. I will post the links and 18 flaws tomorrow" Not on this thread please, unless they pertain to the post at hand. But I think that we have a very good idea where you are coming from and it doesn't reflect well on you or your credibility i'm afraid. -
rhjames at 09:51 AM on 23 February 2011Radiative forcing by aerosol used as a wild card: NIPCC vs Lindzen
Yes, the Hockey stick was a big mistake, which is why the IPCC discretely dropped it. When random data is fed into the process, and still comes up with a Hockey Stick, you have to be concerned. To be more specific, Mann's standardisation and short centring methodology produced a hockey stick bias.Moderator Response: [Daniel Bailey] Incorrect. Or better to say: you've been misled. Whether PCA or non-PCA (discussed here), regardless of the dataset or proxy source used, what comes out is still a hockey stick, because that is what is in the data itself (the signal of the warming planet we live on). This has been discussed many times here at Skeptical Science, notable examples are here and here. The search function in the upper left corner of every page will show you many more posts on that matter, or almost any other climate-related subject you can think of. If you have questions along the way, please post them on the most appropriate thread for them & someone will get back to you fairly quickly. Thanks! -
dhogaza at 09:25 AM on 23 February 2011Radiative forcing by aerosol used as a wild card: NIPCC vs Lindzen
Chemist1... " the 3 rd law of thermodyamics has been ignored due to ignorance of the first and second" Doubly not serious. -
Rob Honeycutt at 09:22 AM on 23 February 2011Radiative forcing by aerosol used as a wild card: NIPCC vs Lindzen
Chemist1... "The hockey stick has been debunked..." Well, now I know you're not serious. Good to know. -
MichaelM at 09:20 AM on 23 February 2011Hockey Stick Own Goal
"In their Prudent Path document, Craig and Sherwood Idso argue ..." -
DSL at 09:20 AM on 23 February 2011Hockey Stick Own Goal
Paul, search for Craig Idso. -
Paul Barry at 09:10 AM on 23 February 2011Hockey Stick Own Goal
Could someone explain to me what the term Idso (or is that ldso?) means. Is it an acronym? A quick Google search did not help. Thankyou. -
Chemist1 at 09:07 AM on 23 February 2011Radiative forcing by aerosol used as a wild card: NIPCC vs Lindzen
No problem. I will post the links and 18 flaws tomorrowModerator Response: [DB] Please ensure that you post them on the most appropriate thread here at Skeptical Science and that you accompany them with the appropriate rationale as to why you think they support whatever it is position you are taking. Thanks! -
Chemist1 at 09:06 AM on 23 February 2011Radiative forcing by aerosol used as a wild card: NIPCC vs Lindzen
Rob, I have read each IPCC report to date. Have you? The 2007 report relies heavily on a misunderstood coefficient for buffering capacity. The tree rings are not a good data source, and neither are spleotherms. The hockey stick has been debunked and the 3 rd law of thermodyamics has been ignored due to ignorance of the first and secondModerator Response: [Daniel Bailey] With regard to your hockey stick comment, please refer the moderation guidance given in this comment. For the remainder, many posts exist here at Skeptical Science on the topics you discuss. Please use the search function to find one to better help you discuss those matters here. Thanks! -
RickG at 08:53 AM on 23 February 2011Radiative forcing by aerosol used as a wild card: NIPCC vs Lindzen
Chemist1: In general, the IPCC report contains 18 significant flaws I can see that directly affects trend analysis and.the probability ranges, and level of confidence. NOAA data shows paleoclimate data where the global mean temps were higher and life flourished. The IPCC greatly neglects analysis of such data. Is the report 100% useless? Okay Chemist1, it's time to lay your cards on the table. List those 18 significant flaws and proceed to discuss each and every one as to why they are flawed with supporting evidence. As for the NOAA comment please be specific about what you are commenting about. What data and temps.? A link please. And please show how the IPCC neglects paleoclimate data. The IPCC AR4 WG1 has quite a bit of detail concerning paleoclimate data in Ch 6 which can be found HERE. -
Rob Honeycutt at 08:46 AM on 23 February 2011Radiative forcing by aerosol used as a wild card: NIPCC vs Lindzen
Chemist1... Of course, you could also check out Knutti 2008 for a broader perspective. This does include Lindzen and puts him in proper perspective within the larger body of science. -
Albatross at 08:11 AM on 23 February 2011Radiative forcing by aerosol used as a wild card: NIPCC vs Lindzen
Chemist @46, You are making many unsubstantiated statements. Pielke Snr's area of expertise is land use change, not aerosols. "...and hundreds of others"-- some supporting evidence please. The fact remains that the "skeptics" are contradicting each other, some (like Lindzen) say net aerosol forcing is negligible, and you are saying that aerosols have a potent negative feedback. IIRC, Michaels in his recent testimony to congress suggested that aerosol forcing is a "fudge factor". Which is it? Again, please provide links to papers papers published by Spencer, Christy, Pielke and Lindzen to support that claim please. -
Follow-Up Case Study in Skepticism
thepoodlebites - My apologies, I should have put in a reference for the "random walk" discussion. Gordon and Bye 1993 examined climate temperature progressions, and found that 'random walk' progressions could only be justified for natural periods up to the order of ~5 years; ENSO, QBO, and the like cycles - long term temperature rise cannot be supported as such a random progression. -
Rob Honeycutt at 08:05 AM on 23 February 2011Radiative forcing by aerosol used as a wild card: NIPCC vs Lindzen
Chemist1... "Rob: please see Spencer and Christy's work confirming an iris effect with more spatial resolution and temporal analysis." Okay, you have two data points now. Please take a quick guess at to how many different studies of climate sensitivity the IPCC numbers are based on. -
Chemist1 at 08:02 AM on 23 February 2011Radiative forcing by aerosol used as a wild card: NIPCC vs Lindzen
Meant to respond to Rick regarding the IPCC -
Chemist1 at 08:00 AM on 23 February 2011Radiative forcing by aerosol used as a wild card: NIPCC vs Lindzen
#43 he has other papers that do not ignore such calculations. My own calculations do not ignore them. Lindzen just like all other scientists is not infallible but the data analyisis of Lindzen, Christy, Spencer, Pielke, and hundreds of others is very clear on potent aerosol effects and cirrus cloud responses to higher temps. No, they do not all agree on the exact degree location of mechansisms, but neither do: eric steig, Gavin or Tamino in all regards or contexts. -
Follow-Up Case Study in Skepticism
thepoodlebites - I'll note that there are a few lines in the conclusions of that paper that point out alternate causes, such as solar irradiance (which is dropping, not rising, so not a valid argument) or long term random processes (I've yet to see a reasonable paper on this topic that doesn't ignore known forcings). Hardly a ringing endorsement of said alternative causes... -
Follow-Up Case Study in Skepticism
thepoodlebites - From that AMS paper's summary (emphasis added): "The first three components from the PCA explain 29% of the total variability in the combined runoff/SST dataset. The first component explains 15% of the total variance and primarily represents long-term trends in the data. The long-term trends in SSTs are evident as warming in all of the oceans. The associated long-term trends in runoff suggest increasing flows for parts of North America, South America, Eurasia, and Australia; decreasing runoff is most notable in western Africa. The second principal component explains 9% of the total variance and reflects variability of the El Nin˜o– Southern Oscillation (ENSO) and its associated influence on global annual runoff patterns. The third component explains 5% of the total variance and indicates a response of global annual runoff to variability in North Atlantic SSTs." Note that the major component is long term trends, or climate change. You've just supported the AGW theory. Nobody argues that cyclic variations like ENSO aren't relevant to short term (<15 year) changes. But the long term trends are not to be ignored. -
Chemist1 at 07:52 AM on 23 February 2011Radiative forcing by aerosol used as a wild card: NIPCC vs Lindzen
I posted google scholar links I read each article on the first page of each scholar link Scheinder was more fair minded but he is gone now. He also failed to make his case about cloud cover as a positive feedback. In general, the IPCC report contains 18 significant flaws I can see that directly affects trend analysis and.the probability ranges, and level of confidence. NOAA data shows paleoclimate data where the global mean temps were higher and life flourished. The IPCC greatly neglects analysis of such data. Is the report 100% useless? NO. It does need considerable redesign. -
Albatross at 07:52 AM on 23 February 2011Radiative forcing by aerosol used as a wild card: NIPCC vs Lindzen
Chemist, Why are you resorting to Gish gallop @39? I said nothing about the IPCC. You say, "there are papers published by Lindzen that describe the power of aerosols" Why then if they are so powerful as you claim and as you allege Lindzen claims, does Lindzen ignore them in his calculations as noted above? I stated that it has been established in the literature that aerosols (depending on their size and type) can affect cloud properties by changing their albedo, as well as other properties-- so on that we agree. -
Meet The Denominator
Poptech "Can a scientifically valid paper not be cited? (Yes or No)" - Maybe. Papers that are irrelevant, repetitious, or poorly written can be valid, yet not worth citing. It used to be (>25 years ago) that valid and useful papers could slip through, as nobody reads all of the journals, but with today's search engines that's become quite the rarity. "So all papers that have had comments on them are incorrect? (Yes or No) " - Again, Maybe. It means that someone in the field objected to that particular paper enough to submit a comment. It definitely means that at least some of that paper is contentious - whether poorly argued, poorly evidenced, or contradictory to other work. Usually the comments are clear enough - they will either break the paper or the comment itself. The thing is, Poptech, citations are the 'vote' of people in the field, indicating what is relevant, meaningful, and worth consideration. It's like a jury - trial by a body of your peers. And as I stated earlier, in the post you really didn't respond to - a lack of citations indicates a lack of worth to the field, and some of the worst papers out there are simply ignored. They don't need or get peer-reviewed comments pointing out problems unless somebody is using them as an arguing point - they'll vanish on their own. -
thepoodlebites at 07:43 AM on 23 February 2011Follow-Up Case Study in Skepticism
#73 I've had a chance to review the Dai, Trenbreth, Qian (2004) paper. From PCA, we have observational evidence of surface warming since the 1980's (temperature + precipitation) and drying in regions prone to droughts during El Nino events. The PC1 temporal patterns seem enhanced by the surface temperature data. And we've had more El Nino's than La Nina's in the '80's and '90's. But to connect these results directly to anthropogenic global warming takes a leap of faith. This looks like another case of circular reasoning, assuming the conclusions in the premises. Here's an AMS article that presents possible alternative hypotheses that also should be considered. I conclude that the CO2-induced AGW signal from the observational drought evidence is inconclusive. -
scaddenp at 07:39 AM on 23 February 2011Radiative forcing by aerosol used as a wild card: NIPCC vs Lindzen
Chemist1 - I dont find suggestions for scholar searches remotely helpful. Please post proper link to specific papers that you think show that current understanding (as stated in IPCC assessment) is flawed. Pointing to well known science doesnt mean much to me. That's all acknowledged. Where is support for specific iris effect in wake of Lin, Rapp, Chambers, and other papers? With even Lindzen backing away, I am curious to know what you mean. I am also very curious as to how you explain the current temperature trends if sensitivity is lower than 2.5 (not to mention the empirical determinations for climate sensitivity).
Prev 1918 1919 1920 1921 1922 1923 1924 1925 1926 1927 1928 1929 1930 1931 1932 1933 Next


